Introduction
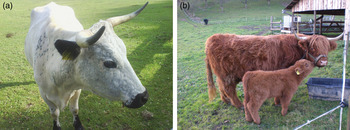
Inflammation of the udder, or mastitis, causes major financial losses for farmers and diminishes the welfare of the animals. Gram-negative bacteria such as the environment-associated Escherichia coli mostly induce acute mastitis that can be mild or severe with grave systemic clinical symptoms (Burvenich et al., Reference Burvenich, Van Merris, Mehrzad, Diez-Fraile and Duchateau2003). In contrast with that the animal-associated Gram-positive Staphylococcus aureus often leads to subclinical and chronic infections with no or only mild symptoms (Riollet, Rainard and Poutrel, Reference Riollet, Rainard and Poutrel2001). To better understand the disease process, primary bovine mammary epithelial cells (pbMEC) can be studied in vitro. Besides producing milk, these cells possess immune functions. Upon pathogen recognition via Toll-like receptors (TLRs) they secrete chemokines and inflammatory cytokines to attract immune cells and trigger the adaptive immune response. At the same time they also produce antimicrobial peptides and acute phase proteins to combat the pathogen directly (Rainard and Riollet, Reference Rainard and Riollet2006). Modern dairy breeds are potentially more affected by mastitis than ancient breeds owing to intensive selection of milk production traits that have a negative genetic correlation with mastitis resistance (Strandberg and Shook, Reference Strandberg and Shook1989). Observations from cattle farmers report that ancient cattle breeds that have never been selected for high milk yield seem to be naturally more resistant or tolerant to mastitis. This could be caused by different environmental and management conditions, but it could also be partly based on different genetics. However, prediction of traits by genetic values is only accurate if there are few large loci responsible for the trait rather than many small loci (Hayes et al., Reference Hayes, Pryce, Chamberlain, Bowman and Goddard2010). Regarding the large number of so far identified candidate genes for mastitis traits (Ogorevc et al., Reference Ogorevc, Kunej, Razpet and Dovc2009) the latter can be assumed in the case of mastitis resistance. In addition, conventional estimation of breeding values showed that heritability of mastitis resistance is generally low (Heringstad, Klemetsdal and Steine, Reference Heringstad, Klemetsdal and Steine2003). It is difficult to find genetic markers for phenotypic resistance when only the genomic architecture but not the resulting functional outcome is studied. That is why we looked at the functional phenotype of the innate immune system in pbMEC of two ancient and two modern cattle breeds. The Brown Swiss (BS) is one of the modern dairy breeds that are commonly used in Germany with 180 000 milk-controlled cows listed in Germany and an average milk yield of 6 800 kg/year (European Brown Swiss Federation, 2012). The Red Holstein (RH) cow is the red-allele carrying variant of the Holstein breed. It has been bred for high production traits for decades. Holstein is superior to most other dairy cattle breeds worldwide in terms of production and it is the most important dairy breed in Germany with 240 000 recorded RH and 2 million recorded Holstein cows that have an average milk yield of 8 245 and 9 008 kg/year (German Holstein Association, 2010). The British White Park (WP) cattle (Figure 1a) has been extensively described (Alderson, Reference Alderson1997) and is thought to be the oldest European cattle breed. Its descriptions as a sacred animal dates back to the pre-Christian Irish epics in the first century AD. It is hardy, robust and kept in extensive low-input grazing systems or parks for beef production (Alderson, Reference Alderson1997). Data from 11 male and 33 female WP cattle were available in Germany in 2009 (Biedermann et al., Reference Biedermann, Hecht, Fandrey, Rudolph and Frolich2009) and the breed has been considered as endangered-maintained in the UK, their country of origin (FAO, 2000). In Germany, the largest herd is kept in the Arche Warder, a zoological park for ancient domestic animal breeds (Biedermann et al., Reference Biedermann, Hecht, Fandrey, Rudolph and Frolich2009). The robust and hardy highland cattle (HLD) (Figure 1b) were originally bred in Scotland hundreds of years ago (Dohner, Reference Dohner2001). It was primarily used in extensive hill or mountain grazing systems for beef production, but was also used to some extent for dairy production (Dohner, Reference Dohner2001). With the herd book established in 1885, it is one of the oldest registered cattle breeds (Mason, Reference Mason2002). Recent livestock numbers in Germany were 2 785 female and 385 male animals in 2010 (BLE, 2012). Our goal was to investigate possible phenotypic breed differences in the innate immune response against mastitis. Therefore, we cultivated pbMEC out of milk from these four breeds and stimulated them with the two major mastitis pathogens E. coli and S. aureus. The breeds were compared in their mRNA expression of 39 target genes of the innate immune system via reverse transcription quantitative polymerase chain reaction (RT-qPCR) and in the synthesis of three antimicrobial proteins via enzyme-linked immunosorbent assay (ELISA).
(a) White Park cow (Arche Warder, Zentrum für alte Haus- und Nutztierrassen e.V., Warder, Germany; photo: Diana Sorg). (b) Highland cow and calf (Rattenweiler, Germany; photo: Diana Sorg).

Material and methods
Cell extraction from milk
Usually, pbMEC are cultivated from udder tissue after biopsy or slaughter. We chose to culture them from milk because it is a non-invasive method and therefore especially suited for rare and valuable animals. It yields less contamination by fibroblasts (Buehring, Reference Buehring1990) and has been shown to be an applicable alternative to tissue sampling (Sorg et al., Reference Sorg, Potzel, Beck, Meyer, Viturro and Kliem2012). For the modern breeds, six healthy BS and six healthy RH cows (from research stations of Technische Universität München, Freising, Germany) in mid-to-late lactation were sampled in the milking parlour by machine milking into an autoclaved milk pail. For the ancient breeds, five healthy HLD (from Arche Warder and a private farm in Rattenweiler, Germany) and five healthy WP cattle (from Arche Warder) in mid-to-late lactation were automatically milked with a portable milking machine into an autoclaved milk pail or by hand milking into autoclaved glass bottles. The cells were extracted and cultivated with the method described in Danowski et al. (Reference Danowski, Sorg, Gross, Meyer and Kliem2012a) until third passage and stored in liquid nitrogen. Briefly, the milk was centrifuged at 1 850 g for 10 min to obtain the cell pellet. The pellet was washed twice with Hank's balanced salt solution (HBSS) containing 200 units/ml penicillin, 0.2 mg/ml streptomycin, 0.1 mg/ml gentamicin and 8.3 µg/ml amphotericin B (Sigma-Aldrich, Munich, Germany) and centrifuged at 600 g for 5 min. It was then resuspended in Dulbecco's modified Eagle's medium with nutrient mixture F12 Ham (DMEM/F12 Ham, Sigma-Aldrich) containing 10 percent fetal bovine serum (FBS, Gibco Life Technologies, Darmstadt, Germany), 1 × ITS supplement (Sigma-Aldrich), antibiotics as described above and 1.76 µg/ml amphotericin B (Sigma-Aldrich). The cells were cultivated in 25 cm2 tissue culture flasks (Greiner, Frickenhausen, Germany) at 37 °C and 5 percent CO2. For two subsequent passages, they were expanded into 75 cm2 flasks (Greiner) by gently detaching them with accutase (PAA, Pasching, Austria). Growth and morphology was checked daily by light microscopy. After the third passage, they were resuspended in freezing medium (70 percent DMEM/F12 Ham, 10 percent FBS, 20 percent dimethyl sulfoxide (DMSO)) and stored in liquid nitrogen. Before freezing, a 16-well chamber slide (Nunc, Langenselbold, Germany) was cultivated for immunocytochemistry by seeding with 10 000 cells per well.
Bacteria
E. coli 1303 (Petzl et al., Reference Petzl, Zerbe, Gunther, Yang, Seyfert, Nurnberg and Schuberth2008) and S. aureus 1027 (Petzl et al., Reference Petzl, Zerbe, Gunther, Yang, Seyfert, Nurnberg and Schuberth2008) had been isolated from cows with clinical mastitis and shown to trigger the immune response in vivo (Petzl et al., Reference Petzl, Zerbe, Gunther, Yang, Seyfert, Nurnberg and Schuberth2008) and in vitro (Gunther et al., Reference Gunther, Esch, Poschadel, Petzl, Zerbe, Mitterhuemer, Blum and Seyfert2011). They were cultivated and harvested with the method used in Danowski et al. (Reference Danowski, Sorg, Gross, Meyer and Kliem2012a, Reference Danowski, Gross, Meyer and Kliemb) and stored at −80 °C. Briefly, one colony of E. coli and of S. aureus was each cultured at 37 °C in Luria–Bertani (LB) medium containing 10 g/l yeast extract (Sigma-Aldrich), 10 g/l NaCl and 5 g/l trypton (Sigma-Aldrich) or in CASO-broth (Sigma-Aldrich), respectively, to the log-phase of growth. Bacterial density was determined photometrically at 600 nm. At several densities, a dilution series of E. coli and S. aureus was cultivated on LB agar (Roth, Karlsruhe, Germany) or on blood agar (Oxoid, Wesel, Germany, with sheep blood from Fiebig, Idstein-Niederauroff, Germany), respectively. The colonies were counted to determine the desired bacterial count and the corresponding optical density (OD). The cultivation was repeated up to the desired OD and stopped by placing the solutions on ice. The bacteria were harvested by centrifugation for 10 min at 1 850 g and washed in PBS twice. They were inactivated for 30 min at 63 °C in a water bath. A diluted sample of both harvested cell pellets was cultivated on a plate at 37 °C overnight to verify inactivation.
Cell stimulation
The 22 cultures were reseeded at 30 000 cells per well in one 12-well plate (Greiner) each and cultivated until confluent. Cells from three wells from each plate were then detached with accutase (PAA, Pasching, Austria) and counted manually for an estimate of the mean cell count per well in the other wells of the plate. Medium was removed and fresh medium without FBS, antibiotics and antimycotic was added. Heat-inactivated bacteria were added in a multiplicity of infection (MOI) of 30 colony forming units (cfu) per cell. This MOI was chosen as a typical bacterial load from other experiments with pbMEC (Danowski et al., Reference Danowski, Sorg, Gross, Meyer and Kliem2012a; Gunther et al., Reference Gunther, Koczan, Yang, Nurnberg, Repsilber, Schuberth, Park, Maqbool, Molenaar and Seyfert2009) to ensure that every culture received the same stimulation per cell. Control wells were left untreated. After 6 h of incubation, two wells each of control and E. coli treated cells were sampled from every plate. After 30 h, two wells each of control, E. coli and S. aureus treated cells, were sampled. After 78 h, two wells each of control and S. aureus treated cells were sampled. The incubation times were chosen to cover the often described earlier onset of the immune reaction to E. coli and the later reaction to S. aureus (Bannerman et al., Reference Bannerman, Paape, Lee, Zhao, Hope and Rainard2004; Gunther et al., Reference Gunther, Esch, Poschadel, Petzl, Zerbe, Mitterhuemer, Blum and Seyfert2011; Petzl et al., Reference Petzl, Zerbe, Gunther, Yang, Seyfert, Nurnberg and Schuberth2008). Cells were harvested with the lysis buffer of the Qiagen AllPrep RNA/Protein kit (Qiagen, Hilden, Germany).
Immunocytochemistry
Immunocytochemical staining of the epithelial marker cytokeratin was performed as described in Danowski et al. (Reference Danowski, Sorg, Gross, Meyer and Kliem2012a, Reference Danowski, Gross, Meyer and Kliemb). Briefly, the cells were fixed on the slides and permeabilized in ice cold methanol/acetone (1:1) for 10 min. They were washed three times for 5 min in PBS-Tween (PBST). Endogenous peroxidases were blocked in 1 percent H2O2 for 30 min. After washing, background staining was reduced with goat serum (1:10 in PBST, DAKO, Glostrup, Denmark) for 10 min at room temperature. Monoclonal mouse anti-cytokeratin pan antibody clone C-11 (1:400 in PBST, Sigma-Aldrich) was incubated overnight at 4 °C in moist atmosphere protected from light. The negative control wells received goat serum (1:10 in PBST) instead. After washing, horseradish peroxidase (HRP) labelled goat anti-mouse-immunoglobulin (1:400 in PBST, DAKO) was incubated for 1 h. HRP was visualized with 0.01 percent diaminobenzidine and 0.01 percent H2O2 in PBST for 15 min at room temperature and protected from light. Nuclei were stained with Haemalaun after Mayer (Roth, Karlsruhe, Germany) for 15 s and developed with tap water. The slides were dehydrated in 50 percent ethanol, 100 percent ethanol and Rotihistol (Roth) for 2 min each and covered with Eukitt (Roth) and a cover slip.
RNA and reverse transcription
The AllPrep RNA/Protein Kit together with the RNAse-free DNAse set (both Qiagen, Hilden, Germany) was used to extract total RNA and protein from the lysed cells and remove DNA contamination following manufacturer's instructions. Concentration and purity of the obtained RNA samples were measured with the Nanodrop 1000 spectrophotometer (Peqlab, Erlangen, Germany) at 260 nm. The integrity of the RNA was analysed with the RNA 6000 Nano Assay kit on Agilent 2100 Bioanalyzer (Agilent Technologies, Waldbronn, Germany). For the reverse transcription to cDNA, a total amount of 100 ng RNA was used in a reaction volume of 30 µl containing 100 units of Moloney murine leukemia virus (M-MLV) H(−) reverse transcriptase and 5 × buffer (Promega, Mannheim, Germany), 0.5 mM dNTPs and 0.5 μM Oligo-d(T) primer (Fermentas, St. Leon-Rot, Germany), and 2.5 μM random hexamer primers (Invitrogen by Life Technologies, Darmstadt, Germany). Reverse transcription reaction was run with annealing (21 °C for 10 min), transcription (48 °C for 50 min) and degrading phase (90 °C for 2 min). To check for genomic DNA contamination, an RNA pool from each extraction run was incubated with the same protocol without reverse transcriptase.
PCR primer pairs
Primer pairs (Metabion, Martinsried, Germany) were designed with HUSAR (DKFZ, German Cancer Research Center, Heidelberg) or PrimerBLAST from NCBI (National Center for Biotechnology Information, National Library of Medicine, Bethesda, MD, USA) using mRNA sequences from the NCBI. Specificity of primer pairs was checked via melting curve analysis and gel electrophoresis of the amplified product. PCR efficiencies of the assays were measured with a five-point dilution series of three cDNA samples in qPCR triplicates and calculated as described in Bustin et al. (Reference Bustin, Benes, Garson, Hellemans, Huggett, Kubista, Mueller, Nolan, Pfaffl, Shipley, Vandesompele and Wittwer2009). Name and symbol, selected relevant functions taken from the Gene Ontology Annotation (UniProt-GOA) database (Dimmer et al., Reference Dimmer, Huntley, Alam-Faruque, Sawford, O'Donovan, Martin, Bely, Browne, Mun Chan, Eberhardt, Gardner, Laiho, Legge, Magrane, Pichler, Poggioli, Sehra, Auchincloss, Axelsen, Blatter, Boutet, Braconi-Quintaje, Breuza, Bridge, Coudert, Estreicher, Famiglietti, Ferro-Rojas, Feuermann, Gos, Gruaz-Gumowski, Hinz, Hulo, James, Jimenez, Jungo, Keller, Lemercier, Lieberherr, Masson, Moinat, Pedruzzi, Poux, Rivoire, Roechert, Schneider, Stutz, Sundaram, Tognolli, Bougueleret, Argoud-Puy, Cusin, Duek-Roggli, Xenarios and Apweiler2012), NCBI reference sequence number, primer pair sequences and amplicon lengths of the genes measured in RT-qPCR are shown in Supplementary Table S1.
RT-qPCR
A primer-specific preamplification step was carried out to adjust cycle of quantification (Cq) values to the measuring range with the following temperature profile: 95 °C for 3 min followed by 18 cycles of 95 °C for 20 s, 55 °C for 3 min and 72 °C for 20 s. 4 μl cDNA were amplified in a volume of 20 µl with the iQ Supermix (Bio-Rad, Munich, Germany) and a primer concentration of 25 nM (Metabion, Martinsried, Germany) of each primer pair over 18 cycles. RT-qPCR was done on the microfluidic high-throughput BioMark™ HD system (Fluidigm, San Francisco, CA, USA) (Spurgeon, Jones and Ramakrishnan, Reference Spurgeon, Jones and Ramakrishnan2008). One 48.48 Gene Expression (GE) Dynamic Array chip was used to measure PCR efficiencies of the assays and four 96.96 GE Dynamic Arrays were used to measure gene expression in the samples. One representative and stably expressed sample was chosen as between-chip calibrator and measured repeatedly on all chips. 5 ìl sample premix containing 2.5 μl SsoFast EvaGreen Supermix (Bio-Rad), 0.25 µl of sample loading reagent (Fluidigm), 0.1 µl ROX (diluted 1:3, Invitrogen), 1.25 μl preamplified and 1:9 diluted cDNA and water, as well as 5 μl assay premix containing 2 µl 10 µM primer pairs in the final concentration of 4 ìM, 2.5 µl Assay loading reagent (Fluidigm) and water were prepared and transferred to the primed GE Dynamic Array 96.96. The samples and assays were mixed inside the chip with the Nanoflex IFC controller (Fluidigm). The final concentration of primers in the individual reaction was 400 μM. The temperature profile was 98 °C for 40 s then followed by 40 cycles consisting of 95 °C for 10 s and 60 °C for 40 s. A melting curve of all PCR products was performed after the run to check for specificity. The Cq, where the fluorescence signal crossed the threshold, was detected by the BioMark Data Collection Software 2.1.1. built 20090519.0926 (Fluidigm, San Francisco, CA, USA). RT-qPCR was conducted following the minimum information for the publication of quantitative real-time PCR experiments (MIQE)-Guidelines (Bustin et al., Reference Bustin, Benes, Garson, Hellemans, Huggett, Kubista, Mueller, Nolan, Pfaffl, Shipley, Vandesompele and Wittwer2009).
Data analysis of RT-qPCR
Melting Curve Analysis Software 1.1.0. built 20100514.1234 (Fluidigm) and Real-time PCR Analysis Software 2.1.1. built 20090521.1135 (Fluidigm) were used to determine the valid PCR reactions. Invalid reactions were not used for later analysis and treated as missing data. Owing to loss of measurement precision, Cq values higher than 30 were treated as missing data and values between 25 and 30 were replaced by 25. Raw Cq values were processed with Genex 5.3.2 (MultID Analyses AB, Gothenburg, Sweden), using interplate calibration and reference gene normalization. Actin gamma 1 (ACTG1), keratin 8 (KRT8) and H3 histone, family 3A (H3F3A) were identified as suitable reference genes with the Normfinder tool within Genex 5.3.2. (MultID). The subtraction of reference gene Cq value index from target gene Cq value yielded the dCq value. Genex 5.3.2 (MultID) was also used for principal component analysis (PCA). All other statistical calculations were conducted with SigmaPlot 11 (Systat, Chicago, IL, USA) or SPSS Statistics Standard 21.0 (IBM, Armonk, NY, USA). Fold change in expression was calculated with the 2−ddCq method (Livak and Schmittgen, Reference Livak and Schmittgen2001). Independent t-tests were used to compare basal expressions and fold changes in expression between breeds (P < 0.05). Paired t-tests or signed rank tests on dCq values were used to find differentially expressed genes between treatment and control. Graphs were drawn with SPSS (IBM) or SigmaPlot 11 (Systat). It must be noted that no correction for multiple testing was imposed on the P-values. This study is of descriptive and explorative character only, not of a diagnostic one. Such a correction would have been too stringent and masked many of the differences.
Protein quantification with ELISA
Total protein content in the extracted cell protein was determined with the bicinchoninic acid (BCA) assay (Smith et al., Reference Smith, Krohn, Hermanson, Mallia, Gartner, Provenzano, Fujimoto, Goeke, Olson and Klenk1985) and measured with a photometer (Tecan, Männedorf, Switzerland). Lactoferrin (LF) was measured with the ELISA protocol and reagents used by Danowski et al. (Reference Danowski, Gross, Meyer and Kliem2012b). Cell protein was diluted 1:1 in PBST and measured in duplicates. Interleukin-10 (IL-10) was determined using the ELISA protocol from Groebner et al. (Reference Groebner, Schulke, Schefold, Fusch, Sinowatz, Reichenbach, Wolf, Meyer and Ulbrich2011) with minor modifications: the capture antibody mouse anti-bovine IL-10 antibody clone CC318 (AbD Serotec, Düsseldorf, Germany) was used at 5 µg/ml and the detection antibody biotinylated monoclonal mouse anti-bovine IL-10 antibody clone CC320 (AbD Serotec) was used at 1 µg/ml and incubated for 2 h. Samples were diluted 1:50 in PBST. Serum amyloid A (SAA) was measured in 30 h E. coli treated and control samples with the PHASE Serum amyloid A Multispecies ELISA kit (TriDelta, Maynooth, Ireland) according to manufacturer's instructions. Samples were diluted 1:67 in PBST.
Data analysis of ELISA
LF contents were calculated from the standard curve (Magellan data analysis software, Tecan, Männedorf, Switzerland). They were normalized to the total protein content of the sample and presented as ng LF/μg cell protein. A paired t-test in SigmaPlot 11 (Systat, Chicago, IL, USA) was used to test for differential expression of LF between treated and control samples at each time point (P < 0.05). Independent t-tests were used to compare treated and control levels between breeds. Owing to a lack of a commercial standard, relative IL-10 concentration was determined by normalizing the OD to the total protein content of the sample. To avoid interplate bias we gave the ratio of normalized ODs of treated and control samples that were each measured together on the same plate, multiplied by 100, this yielded IL-10 in % of control. SAA contents were determined with the standard curve as indicated in the manual. A paired t-test or signed rank test in SigmaPlot (Systat, Chicago, IL, USA) was used to compare SAA content in 30 h E. coli treated and control samples (P < 0.05). An independent t-test was used to compare breeds (P < 0.05).
Results
Cell culture and immunocytochemistry
An average of 5.98 million cells per animal with a range of 1–19 million cells was harvested for storage in liquid nitrogen. All the cultures showed a clear and continuous staining for cytokeratin, whereas the negative controls remained unstained. No cell types other than epithelial-like cells could be detected. All cultures showed the typical cobblestone-like shape with varying cell sizes. An example is shown in Supplementary Figure S2.
Gene expression
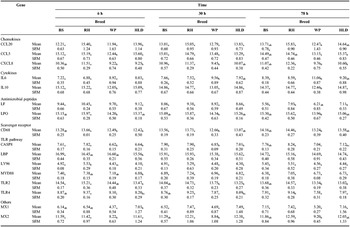
Table 1 shows the normalized basal expression of 16 innate immune genes in the untreated control samples after 6, 30 and 78 h incubation. These 16 genes were differentially expressed between breeds at one time point at least. CXCL8, LPO, CD68, CASP8, TLR2, TLR4 and MX2 were differentially expressed at all three time points. Six genes of the TLR pathway were differentially expressed at 6 h. Notably in CASP8, CXCL8, TLR2 and TLR4, the ancient breeds had lower Cq values and therefore higher expression levels than the modern breeds. WP had higher expression levels of CCL5, IL10, MX1 and MX2 than the other breeds. It also had a higher CCL20, CD68 and LPO expression than RH.
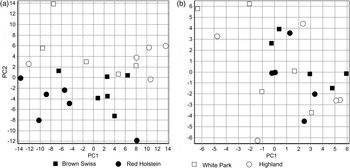
PCA of (a) dCq values (basal expression of unstimulated control) and (b) ddCq values (difference between treated and control dCq) of 28 target genes in pbMEC from four cattle breeds after stimulation with E. coli and S. aureus. Each symbol represents all respective samples of one animal.

Basal mRNA expression (mean dCq and SEM) of innate immune genes in pbMEC from four cattle breeds, unstimulated control after 6, 30 and 78 h.

Note: BS = Brown Swiss, RH = Red Holstein, WP = White Park, HLD = Highland. Means with different subscript letters are significantly different between the breeds (P < 0.05).
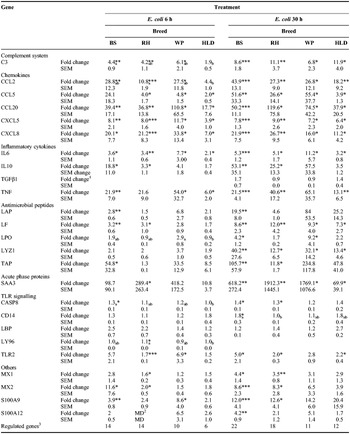
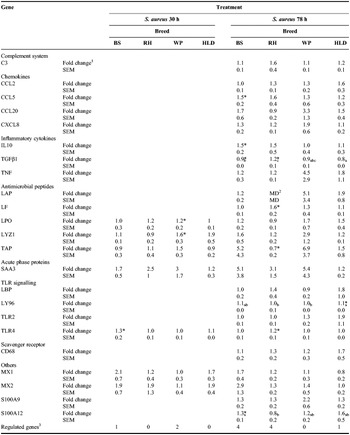
Tables 2 and 3 show the relative fold changes in gene expression of innate immune genes between control and treated cells. Only genes that were differentially expressed in one breed (P < 0.05) or were at least 1.5-fold up-regulated are presented. Table 2 shows the fold changes in gene expression after 6 and 30 h exposure to E. coli. After 6 h, HLD had lower fold changes than BS in complement component 3 (C3) and caspase 8 (CASP8), lower fold changes than RH in chemokine (C-C motif) ligand 2 (CCL2) and lymphocyte antigen 96 (LY96) and lower fold changes than WP in lactoperoxidase (LPO). C3, chemokines and cytokines were strongly up-regulated. Antimicrobial peptides were only up-regulated in the modern breeds. S100 and MX genes were more differentially expressed in the modern breeds. The most regulated gene after 6 h exposure to E. coli was SAA3 with nearly 290-fold in RH. After 30 h exposure to E. coli, BS had higher fold changes than RH in CD14. C3, chemokines, cytokines and antimicrobial peptides were strongly up-regulated. With the two E. coli treatments, more of the antimicrobial peptides were up-regulated in BS than in the other breeds. After 6 h exposure to E. coli there was no up-regulation of these in the ancient breeds. The S100 and MX genes were only up-regulated in the modern breeds. The most regulated gene after 30 h exposure to E. coli was SAA3 with 1900-fold in RH. Table 3 shows the fold changes in gene expression after 30 and 78 h exposure to S. aureus. There were no breed differences after 30 h exposure to S. aureus. The only differentially expressed genes were the antimicrobial peptides LPO and LYZ1 in WP and TLR4 in BS. After 30 h exposure to S. aureus LYZ1 had the highest significant fold change with 1.6 in WP. After 78 h exposure to S. aureus, HLD differed from BS in transforming growth factor β1 (TGFβ1). They were both down-regulated and differed from RH which was up-regulated. LY96 was slightly elevated in HLD compared with WP and RH. After 78 h exposure to S. aureus, the highest significant fold change was found in LF in RH with 1.6. SEM was generally very high. In general, the modern breeds had a higher number of regulated genes than the ancient breeds (Tables 2 and 3). Figure 2 shows the PCA on the dCq values of the control samples (Figure 2a) and the ddCq values, the differences between control and treated dCqs (Figure 2b). Each symbol represents all data of all respective samples from one animal. A visual clustering can be observed in the basal expression (Figure 2a): RH and BS form two subgroups in the lower half of the picture. WP and HLD are mixed together, but separated from the modern breeds in the upper half of the graph. No such separation is visible in the PCA on the ddCqs of gene expression.
Fold changes of the normalized relative gene expression of innate immune genes in pbMEC from four cattle breeds after 6 h and 30 h stimulation with E. coli.

Note: BS = Brown Swiss (n = 6), RH = Red Holstein (n = 6), WP = White Park (n = 5), HLD = Highland (n = 5); Stars indicate significant differences between treated and control dCq: *P < 0.05, **P < 0.01, ***P < 0.001. Fold change means with different subscript letters differ between breeds (P < 0.05).
1Empty genes: no significant breed differences in expression fold changes and no fold changes >1.5 at this time point.
2Missing data.
3 P < 0.05 for dCq difference between treatment and control.
Fold changes of the normalized relative gene expression of innate immune genes in pbMEC from four cattle breeds after 30 h and 78 h stimulation with S. aureus.

Note: BS = Brown Swiss (n = 6), RH = Red Holstein (n = 6), WP = White Park (n = 5), HLD = Highland (n = 5); Stars indicate significant differences between treated and control dCq: *P < 0.05, **P < 0.01, ***P < 0.001. Fold change means with different subscript letters differ between breeds (P < 0.05).
1Empty genes: no significant breed differences in expression fold changes and no fold changes >1.5 at this time point.
2Missing data.
3 P < 0.05 for dCq difference between treatment and control.
Protein production
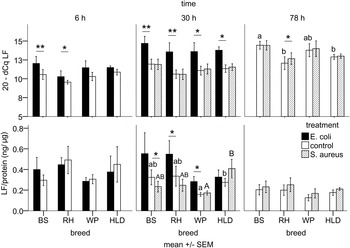
LF content in total cell protein is shown together with the inversed expression of its gene (20-dCq), so that higher bars represent higher gene expression (Figure 3). While an up-regulation in the gene expression could be observed in most E. coli treatments and after 78 h with S. aureus, only RH and WP had a significant protein increase with 30 h exposure to E. coli. BS even showed a down-regulation in LF protein with 30 h exposure to S. aureus. BS had higher gene expression levels than RH and HLD in 78 h control cells. HLD had higher control and S. aureus treated LF protein levels after 30 h compared with WP.
Relative gene expression and LF content in ng/μg cell protein in pbMEC from ancient (WP, HLD; n = 5) and modern (BS, RH; n = 6) cattle breeds stimulated with E. coli (6 and 30 h) and S. aureus (30 and 78 h). Stars indicate significant differences between the treatments, letters indicate significant differences of S. aureus treated (upper case letters) and control levels (lower case letters) between the breeds (P < 0.05). BS = Brown Swiss, RH = Red Holstein, WP = White Park, HLD = Highland cattle.

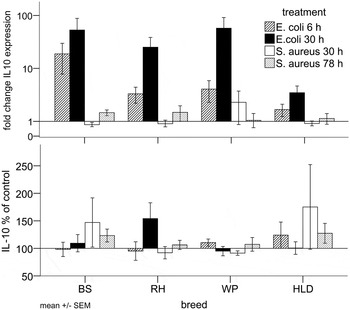
IL-10 was determined relatively as IL-10 in % of control and is shown together with the fold change of its gene expression (Figure 4). There were no significant breed differences. While there was an often significant up-regulation in IL10 gene expression (see Tables 2 and 3) the rise in protein production was not consistent throughout the breeds and the treatments. In BS, there was a qualitative increase of approximately 50 and 25 percent of IL-10 protein after 30 and 78 h exposure to S. aureus, respectively. RH had a qualitative increase of about 60 percent with 30 h exposure to E. coli. WP showed no visible changes compared with controls. In HLD, there was about 50 percent more IL-10 with 6 h E. coli and 78 h S. aureus treatments, as well as about 100 percent more with 30 h S. aureus treatment. SEM of the protein data was considerably high.
Fold change of IL10 expression and relative IL-10 content in % of untreated control in total cell protein of pbMEC from ancient (WP, HLD; n = 5) and modern (BS, RH; n = 6) cattle breeds stimulated with E. coli (6 and 30 h) and S. aureus (30 and 78 h). BS = Brown Swiss, RH = Red Holstein, WP = White Park, HLD = Highland cattle.

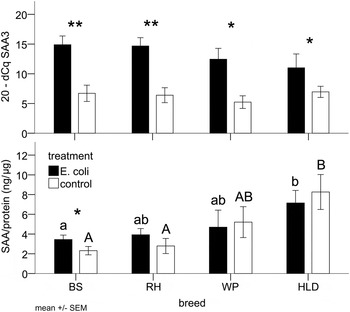
SAA content was measured in control and E. coli treated cells after 30 h stimulation and is shown together with the inversed expression of its gene (20-dCq), so that higher bars represent higher gene expression (Figure 5). Gene expression was significantly increased by the treatment, but only in BS this was also true for the protein production. BS and RH differed significantly from HLD in basal SAA levels (control). However, only BS differed significantly from HLD in E. coli treated SAA levels.
Relative expression of the SAA3 gene and SAA content in ng/μg cell protein in pbMEC from ancient (WP, HLD; n = 5) and modern (BS, RH; n = 6) cattle breeds stimulated with E. coli for 30 h. Stars indicate significant differences between treatments, different letters indicate significant differences of treated (lower case letters) and control cells (upper case letters) between breeds (P < 0.05). BS = Brown Swiss, RH = Red Holstein, WP = White Park, HLD = Highland cattle.

Discussion
Breed comparison
On the level of basal expression in the PCA, there was a visible separation of ancient from modern breeds and within the two modern breeds. The higher basal expression of the components of the TLR pathway in the ancient breeds could be responsible for an earlier recognition of invading pathogens and therefore lead to an earlier and more effective immune response. The same could be true for the higher basal levels of SAA protein in the ancient breeds which could have a protective effect against pathogens, as SAA is an opsonising agent (Shah, Hari-Dass and Raynes, Reference Shah, Hari-Dass and Raynes2006). Interestingly, basal LF protein levels were lower in the ancient breeds, but differed significantly only between WP and HLD. WP and HLD also differed in basal expression of MX1 and CCL5. So the breeds seem to be all different from each other and cannot just be grouped together in “modern” and “ancient”. It is difficult to interpret the fold changes of gene expression, as the SEM were considerably high and led to weak significances for visibly high fold changes. In addition, the PCA on ddCq did not reveal any clustering of the animals. However, this set aside, there was a higher number of significantly up-regulated genes in the modern breeds, especially for the antimicrobial peptides, the TLR pathway and the MX genes. HLD had the lowest fold changes in SAA3 expression, but the highest basal levels of SAA protein after 30 h. Although the whole picture is diffuse and complex, it seems as if in those parts of the immune system where we found a difference between the breeds, a higher basal expression led to a lower response. Kandasamy et al. (Reference Kandasamy, Green, Benjamin and Kerr2012) tested the extent of the immune response of cows that had before been classified as “high-” and “low-responder” animals to an intramammary E. coli challenge. They found that the weaker immune response of low-responder animals was more effective and led to a shorter resolution phase of the inflammation. Hence, a strong immune response is not necessarily a benefit for the animal. Another prominent example for this phenomenon is the well-studied tolerance of the Bos indicus Sahiwal cattle to the indigenous protozoan parasite Theileria annulata. Compared with Holstein calves in vivo (Glass et al., Reference Glass, Preston, Springbett, Craigmile, Kirvar, Wilkie and Brown2005) they showed fewer clinical symptoms, recovered from a higher dose of pathogen and had lower acute phase protein levels. In another comparison with Sahiwal cattle, macrophages from Holstein cattle showed higher up-regulation of inflammatory and immune response genes (Glass et al., Reference Glass, Crutchley and Jensen2012).
To our knowledge, there are no studies on the intra-mammary immune system of ancient cattle breeds such as WP and HLD. There has been evidence that the immune system of modern breeds shows differences in details, but overall is highly conserved (Bannerman et al., Reference Bannerman, Kauf, Paape, Springer and Goff2008a, Reference Bannerman, Springer, Paape, Kauf and Goff2008b), which is in accordance with our results. The in vivo response of Holstein and Jersey cows to E. coli differed only in the time point of milk cytokine and somatic cell count (SCC) increase, not in overall levels (Bannerman et al., Reference Bannerman, Kauf, Paape, Springer and Goff2008a). To an S. aureus challenge Holstein and Jersey animals also responded with similar overall levels of milk SCC and cytokines except for neutrophils and N-acetyl-beta-D-glucosaminidase (NAGase) activity (Bannerman et al., Reference Bannerman, Springer, Paape, Kauf and Goff2008b). Different LF contents in milk have already been observed between Holstein, Jersey and Simmental cows (Krol et al., Reference Krol, Litwinczuk, Brodziak and Barlowska2010) as well as between dairy and beef cattle (Tsuji et al., Reference Tsuji, Hirata, Mukai and Ohtagaki1990), which adds to our findings of different LF contents in pbMEC. There are several polymorphisms located in the LF gene in different cattle breeds that could be the reason for differential LF expression and production (O'Halloran et al., Reference O'Halloran, Bahar, Buckley, O'Sullivan, Sweeney and Giblin2009). The different SAA contents in our pbMEC can be compared with a study where after an LPS challenge SAA in blood serum increased more rapidly in Angus than in Romosinuano steers (an indigenous Colombian breed) and remained at higher levels for 8 h (Carroll et al., Reference Carroll, Burdick, Reuter, Chase, Spiers, Arthington and Coleman2011). Although in the cells from our ancient breeds the absolute levels of SAA protein were higher than in the modern breeds, there was no significant rise after pathogen stimulation. Cattle breed differences in gene expression and protein production of the immune system have not been systematically studied so far, but our findings and the above-mentioned studies show that there is evidence for such diversity.
The considerable animal differences within each breed, reflected by the high SEMs and by the wide spread of the symbols representing animals in the PCAs, could be explained by the existence of a substantial between-cow variation in the immune response which has already been shown for Holstein cattle in vitro and in vivo (Kandasamy et al., Reference Kandasamy, Green, Benjamin and Kerr2012). It could be caused by genetic polymorphisms that are linked to a certain breed, but could also be spread all over the cattle population. Furthermore, it has been suggested that a proportion of unexplained phenotypic variation in the dairy cow is because of epigenetic regulation (Singh et al., Reference Singh, Erdman, Swanson, Molenaar, Maqbool, Wheeler, Arias, Quinn-Walsh and Stelwagen2010).
General remarks about the immune response
C3, chemokines, inflammatory cytokines and the inflammation marker SAA3 experienced a strong up-regulation by E. coli in all the breeds. The antimicrobial peptides were also strongly up-regulated after 30 h in E. coli treated cells. This confirms that our pbMEC continued to exert sentinel functions to trigger the innate immune response upon pathogen recognition as well as an active defence by attacking and opsonising bacterial cells. Interestingly, in our study the TLR pathway was not as markedly regulated, although it is one of the starting points of the immune signalling cascade and has been shown to be a source for potential mastitis resistance (Griesbeck-Zilch et al., Reference Griesbeck-Zilch, Osman, Kuhn, Schwerin, Bruckmaier, Pfaffl, Hammerle-Fickinger, Meyer and Wellnitz2009). However, in another study the regulation of TLRs in pbMECs was similarly weak, but the authors still concluded that there was a functioning and locally effective immune system (Strandberg et al., Reference Strandberg, Gray, Vuocolo, Donaldson, Broadway and Tellam2005). We also found a regulation of the genes we had termed as “others”. The calcium-binding, pro-inflammatory, regulatory and anti-oxidant S100 calcium-binding proteins A9 (S100-A9) and A12 (S100-A12) seem to be a class of protective and defence proteins (Hsu et al., Reference Hsu, Champaiboon, Guenther, Sorenson, Khammanivong, Ross, Geczy and Herzberg2009) that act in addition to LF, lysozyme 1 (LYZ1), LPO and the β-defensins lingual antimicrobial peptide (LAP) and tracheal antimicrobial peptide (TAP). The antiviral myxovirus (influenza virus) resistance 2 (mouse) gene (MX2) has a yet unknown role in mastitis and remains a subject of further research.
Pathogen comparison
It has previously been shown that S. aureus elicits a different and often weaker immune response than E. coli in vitro (Griesbeck-Zilch et al., Reference Griesbeck-Zilch, Meyer, Kuhn, Schwerin and Wellnitz2008) and in vivo (Petzl et al., Reference Petzl, Zerbe, Gunther, Yang, Seyfert, Nurnberg and Schuberth2008). The dose of inoculum could have been too low so that the cells did not receive enough signals to trigger the response. Our results can be compared with a similar study with pbMEC from milk and the same strains of pathogens (Danowski et al., Reference Danowski, Sorg, Gross, Meyer and Kliem2012a): in that study, too, the immune response to S. aureus was much weaker than to E. coli. Our data support the hypothesis that the often subclinical and chronic outcome of S. aureus mastitis is caused by this reduced reaction of the mammary immune system.
Gene expression and protein comparison
LF gene expression was generally better reflected by the ELISA measurements than the other two proteins. Although IL10 gene expression was significantly up-regulated in the two modern breeds there was no consistent rise of the protein in cell content. SAA3 expression was up-regulated by E. coli after 30 h, but the protein levels reflected that only in BS and RH. For all these three genes (in SAA for the SAA encoding-gene SAA2) microRNAs have been identified that could lead to a differential expression, translation and massive variation in protein levels (Longley, Steel and Whitehead, Reference Longley, Steel and Whitehead1999; Sharma et al., Reference Sharma, Kumar, Aich, Hariharan, Brahmachari, Agrawal and Ghosh2009; Liao, Du and Lonnerdal, Reference Liao, Du and Lonnerdal2010). These microRNAs could also be differentially expressed between the breeds and determine the breed differences in mRNA expression. LF was also secreted into the media, but the concentrations were mostly below the measuring range (data not shown). This and a delay between mRNA expression and protein synthesis of the three genes could also account for the differences.
Conclusions
To our knowledge this is the first time that the mammary immune system of the ancient WP and HLD cattle was studied in vitro. The four breeds BS, RH, WP and HLD were found to differ in parts of the gene expression and protein production. A higher basal expression of some genes and proteins in the cells from the ancient breeds seemed to lead to a lower immune response after pathogen recognition. However, the main immune system pathways that were activated were the same, indicating that the complex network of immune response is to some extent conserved between the Bos taurus breeds. With this experimental setup it is possible to study other breeds and other pathogens in the same way, especially with the non-invasive pbMEC extraction from milk which is suitable for the sampling of valuable animals of rare breeds. We confirmed the existence of previously described substantial cow-to-cow variation in immune response. The classification of high- and low-responder animals and the underlying genetic and epigenetic mechanisms remain subject to further analysis.
Acknowledgments
We thank Dr Wolfram Petzl (Ludwigs-Maximilians-Universität München, Germany) for donating the bacteria and Katrin Danowski for donating primer pair oligos. Our special thanks go to the whole staff of Arche Warder for handling the animals and general support with the sampling. This work was supported by the “Vereinigung zur Förderung der Milchwissenschaftlichen Forschung an der TU München e. V.” (Freising, Germany); the “Drs. Bruns-Stiftung” (Steinfeld, Germany) and the “Dr.-Ing. Leonhard-Lorenz-Stiftung” (Garching, Germany).
Conflict of Interest statement
The authors declare that there is no conflict of interest.
Supplementary material
Supplementary materials of this paper is available at http://journals.cambridge.org/agr