INTRODUCTION
Triticale, a cross between wheat and rye, was first produced in the late 1800s with the aim of combining the grain qualities of wheat with the low-input requirements and hardiness of rye (Carman Reference Carman1884). It has been grown commercially since the 1970s on a steadily increasing area, but by 2013 it covered only 3·8 million ha worldwide, compared with 219 million ha wheat in the same year (FAO 2014). In the UK in 2013, triticale was grown on 11 000 ha, compared with 1 615 000 ha for wheat (FAO 2014). This relatively low adoption in the UK is due both to limited market demand for triticale and a perception amongst growers that triticale is a low-yielding crop, suited only to marginal soils. The perceived low yield of triticale is supported by national data: the UK average triticale yield for 2010–2013 was reported to be 3·8 t/ha, compared with 7·4 t/ha for wheat. However, due to the relatively small quantities grown and traded, data on triticale production is not routinely collected, and the yield data are acknowledged to be unreliable. Triticale is rarely traded in the UK, being more commonly used for on-farm feeding, often as a forage crop rather than taken to harvest for grain. Of the triticale that is sold off-farm, it is thought that much is mixed with and sold as wheat, further distorting the production data.
Triticale can be used for animal feed with roughly equivalent nutritional value to wheat and barley and a reportedly higher content of the essential amino acid lysine (Djekic et al. Reference Djekic, Mitrovic, Milovanovic, Djuric, Kresovic, Tapanarova, Djermanovic and Mitrovic2011). Whilst rye is little used in pig and poultry rations due to high levels of non-starch polysaccharides, considered anti-nutritive, the non-starch polysaccharide content of triticale is much closer to that of wheat than rye (McGoverin et al. Reference McGoverin, Snyders, Muller, Botes, Fox and Manley2011). It has been used successfully at high inclusion levels in both pig (Beltranena et al. Reference Beltranena, Salmon, Goonewardene and Zijlstra2008) and poultry (Hermes & Johnson Reference Hermes and Johnson2004; Korver et al. Reference Korver, Zuidhof and Lawes2004; Widodo et al. Reference Widodo, Nolan and Iji2015) rations, although some studies have shown reductions in growth rate (Brand et al. Reference Brand, Olckers and Vandermerwe1995; Kliseviciute et al. Reference Kliseviciute, Gruzauskas, Grashorn, Raceviciute-Stupeliene, Sasyte, Svirmickas and Bliznikas2014). Recently triticale has been used as a feedstock for bioethanol production in Europe (Obuchowski et al. Reference Obuchowski, Banaszak, Makowska and Luczak2010) and work in the UK has demonstrated its suitability for bioethanol production relative to wheat, especially with regard to greenhouse gas (GHG) savings (Davis-Knight & Weightman Reference Davis-Knight and Weightman2008; Weightman & Davis-Knight Reference Weightman and Davis-Knight2008; Kindred et al. Reference Kindred, Weightman, Roques and Sylvester-Bradley2010; Weightman et al. Reference Weightman, Kindred and Clarke2011).
There is plentiful evidence that triticale usually out-yields wheat in dry conditions, such as Mediterranean environments (Graham et al. Reference Graham, Geytenbeek and Radcliffe1983; Hadjichristodoulou Reference Hadjichristodoulou1984; Josephides Reference Josephides1992; Gulmezoglu et al. Reference Gulmezoglu, Alpu and Ozer2010; Villegas et al. Reference Villegas, Casadesús, Atienza, Martos, Maalouf, Karam, Aranjuelo and Nogués2010; Estrada-Campuzano et al. Reference Estrada-Campuzano, Slafer and Miralles2012). Comparisons of wheat and triticale in temperate conditions and high-yielding soils are much scarcer: triticale out-yielded wheat in experiments in Denmark (Jørgensen et al. Reference Jørgensen, Deleuran and Wollenweber2007) and Estonia (Alaru et al. Reference Alaru, Laur, Eremeev, Reintam, Selge and Noormets2009), but produced a lower yield than wheat in an experiment in the Netherlands (Ellen Reference Ellen1993). In one UK study, triticale had comparable yield to wheat on low fertility soils with low inputs, but a lower yield than wheat under high inputs (Gutteridge et al. Reference Gutteridge, Hornby, Hollins and Prew1993); however, that study was conducted over 20 years ago, so the results may not be representative of modern triticale varieties. In more recent work, triticale outperformed wheat for yield and gross margin at sites with light soils or severe take-all levels, but not at fertile sites with low take-all pressure (Overthrow & Carver Reference Overthrow and Carver2003).
Efficient use of fertilizer nitrogen (N) is of great importance both to gross margins on farm, local diffuse pollution, climate change through GHG emissions and to global food security (Snyder et al. Reference Snyder, Bruulsema, Jensen and Fixen2009). The high yields reported for triticale on poor soils or with low inputs suggest that triticale may take up or use N more efficiently than wheat (Gutteridge et al. Reference Gutteridge, Hornby, Hollins and Prew1993; Alaru et al. Reference Alaru, Laur, Eremeev, Reintam, Selge and Noormets2009). However, none of the experiments mentioned above included sufficient N rates to compare yield responses to N and economically optimal N requirements for wheat and triticale. Other traits thought to contribute to the high yield of triticale, relative to wheat, include resistance or tolerance to take-all (Gutteridge et al. Reference Gutteridge, Hornby, Hollins and Prew1993; Overthrow & Carver Reference Overthrow and Carver2003), high numbers of grain per ear (Ellen Reference Ellen1993; Estrada-Campuzano et al. Reference Estrada-Campuzano, Slafer and Miralles2012) and per unit area (Estrada-Campuzano et al. Reference Estrada-Campuzano, Slafer and Miralles2012), efficient radiation interception (Giunta et al. Reference Giunta, Pruneddu and Motzo2009), strong early vigour and early root growth, efficient remobilization of stem carbohydrates, high transpiration use efficiency, reduced tillering, and differences in the length of developmental stages (Bassu et al. Reference Bassu, Asseng and Richards2011).
In 2007, the current authors grew triticale in trials alongside wheat varieties and were surprised that triticale out-yielded the best wheat varieties by over 0.5 t/ha, both with and without N fertilizer on a fertile deep silt soil (Kindred et al. Reference Kindred, Weightman, Roques and Sylvester-Bradley2010). The present paper reports 16 subsequent experiments setup to compare yields and N responses of wheat and triticale, to evaluate whether triticale can deliver higher yields with lower N requirements on high-yield potential sites in the UK. Measures of biomass, harvest index and yield components were made on some of these experiments to help elucidate the differences between wheat and triticale. Additional crop measurements on selected experiments to test hypotheses for the difference between triticale and wheat are reported by et al. (Reference Clarke, Roques, Weightman and Kindred2016).
MATERIALS AND METHODS
Experiments
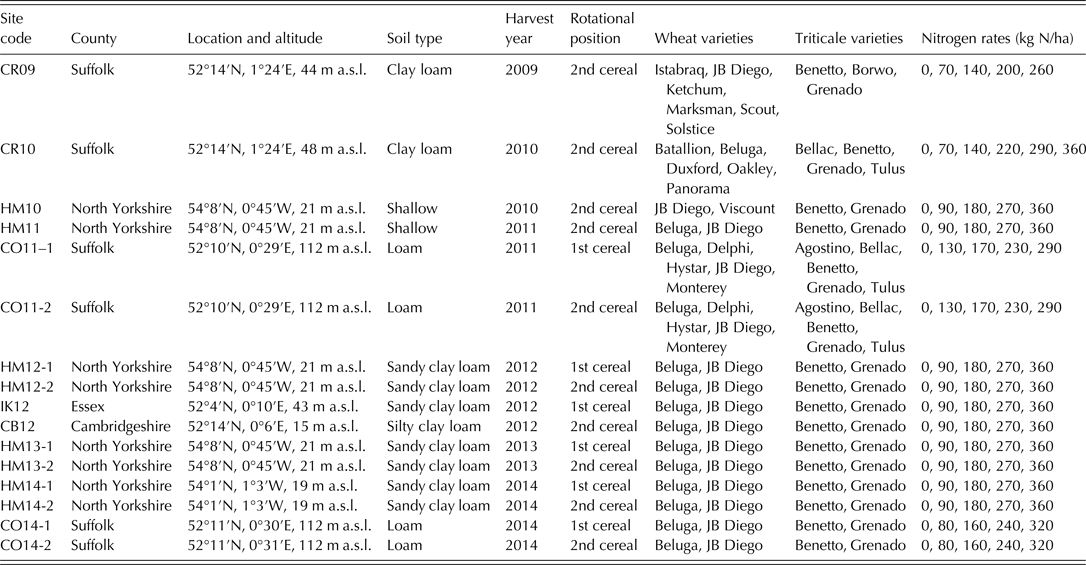
A total of 16 experiments were carried out in the UK from harvest years 2009–2014. Each experiment included at least two winter wheat and two winter triticale varieties, each grown at a minimum of five N fertilizer rates from 0 kg N/ha to super-optimal. Treatments were replicated three times. The location, soil type and rotational position (first or second cereal) varied between experiments (Table 1).
Locations, soil types, harvest years and treatment details for each experiment

Experiments were laid out in a split–split-plot design with N rate as the main plot, species as the sub-plot and variety as the sub–sub-plot. Varieties from different species were not randomized together, to avoid shading of wheat by triticale, which is taller. At three sites (HM12, HM13 and HM14), first and second cereal positions were included in a single experiment, as the first level of main plot within each block. This was achieved by setting up the blocks the previous year with the second cereal areas preceded by wheat and the first cereal areas preceded by oats.
Experiments were sown using plot drills with at least 1·5 m width and plot lengths of at least 12 m. Within each experiment, wheat and triticale received the same maintenance applications of phosphorus (P) and potassium (K) and were drilled and harvested on the same day.
Nitrogen treatments were applied as ammonium nitrate prills (34·5% N), broadcast by hand. Each N rate was applied in two or three split applications, timed according to UK guidelines (Anon 2010).
Of the wheat varieties used, Batallion, Ketchum, Marksman, Panorama and Solstice are milling wheats; Delphi, Monterey and Scout are soft biscuit wheats; Beluga, Duxford, Istabraq and Viscount are soft feed wheats, JB Diego and Oakley are hard feed wheats, and Hystar is a hybrid hard feed wheat.
Weather conditions
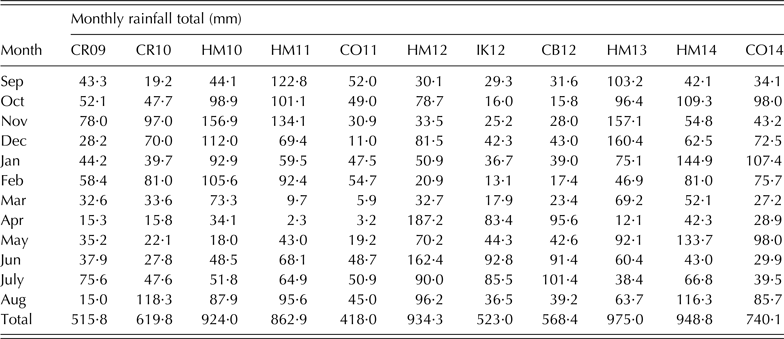
Experiment CR09 experienced an unusually dry spring (Table 2). In harvest year 2010 the UK experienced a cold winter and dry spring, but not sufficiently so to have a major impact on crop growth. In 2011, there was an exceptionally dry spring – the driest on record in England and Wales. By contrast, in 2012 England had the wettest April to June period and the wettest year on record. Harvest year 2013 was notable for a cold and prolonged winter, resulting in most crops being about 3 weeks late in hitting key growth stages throughout spring and early summer; rainfall was within the normal range. 2014 was an unusually warm year, with a wetter than usual winter but spring rainfall within the normal range; June and July were sunnier than usual, contributing to high cereal yields across the UK.
Monthly rainfall totals (mm) for each site, from September in year of drilling to August in harvest year

Rainfall data for CB12 from local Met Office weather station; data for other sites sourced from IRRIGUIDE (Bailey & Spackman Reference Bailey and Spackman1996).
Assessments
Whole crop samples were collected prior to harvest in 13 of the 16 experiments, by sampling 50 tillers per plot from selected varieties and N rates. Samples were separated into straw and ears and the ears threshed using a hand threshing machine to separate grain and chaff. Each component plant part was dried for at least 24 h at 100 °C then weighed, to determine the proportion of biomass in each fraction, i.e. grain, straw and chaff. Results were converted to biomass in t/ha using yield data from plot combines. Straw and chaff samples were re-combined before analysis for N concentration (mg/g) by the Dumas method (Dumas Reference Dumas1831). Grain samples collected from the combine harvester were similarly analysed for N concentration.
Lodging (% plot area at greater than 45° from vertical) and leaning (% plot area at 10°–45° from vertical) were assessed immediately prior to harvest at all sites. These data were used to calculate a lodging index on a 0–100 scale (Berry et al. Reference Berry, Spink, Sterling and Pickett2003):
 $${\rm lodging\ index}\, = \,{\rm \%\ area\ lodged} + \displaystyle{{{\rm \%\ area\ leaning}} \over {\rm 2}}$$
Grain yield was assessed at all sites using a plot combine on an individual plot area of at least 15 m2. Grain moisture was measured and the yield results corrected to t/ha at 85% dry matter.
In four experiments (CR09, CR10, HM14-1 and HM14-2), thousand grain weight (TGW) (in g) was measured on the same treatments used for the biomass assessments described above. The number of ears/m2 was calculated using yield data from the plot combine and the grain weight per tiller measured above. The number of grains per ear was calculated using TGW, grain yield and ears/m2.
Specific weight (kg/hl) was measured on all grain samples at all sites. Grain protein content (% dry matter) was measured by NIR on all samples at all sites except HM10.
Statistical analysis
A linear plus exponential model (George Reference George1984) was used to fit grain yield responses to N:
 $$y\, = \,a\, + \,br^{\rm N}\, + \,c{\rm N}$$
where y is grain yield (t/ha at 85% dry matter), N is the amount of N applied (kg N/ha), and a, b, c and r are empirically derived parameters, which (crudely) describe respectively the asymptote, the magnitude of the yield response to N, the rate of yield loss due to overapplication of N and the shape of the response.
Each linear plus exponential function was fitted using a stepwise process involving the following steps: (i) fitting a common curve to all varieties; (ii) fitting parallel curves for each variety by allowing parameter a to vary; (iii) fitting non-parallel curves for each variety by allowing parameters a, b and c to vary; and (iv) fitting separate curves for each variety by allowing all parameters to vary. The sums of squares explained at each stage was calculated, and a test was made of the improvement in fit over the previous model. If there was no significant improvement between two stages, then the previous model was taken as the best description of the data.
This stepwise curve-fitting approach was also done for each site by species (wheat and triticale) instead of by variety. However, the variation explained at steps (ii), (iii) and (iv) was on average 9% lower than for the analysis by varieties. These results are not presented, as they do not allow examination of how the differences between wheat and triticale compare with the differences between varieties within each species.
The economically optimum N rate (Nopt) was determined from the fitted parameters:
 $${\rm N}_{{\rm opt}}\, = \left( {{\rm ln}\displaystyle{k \over {1000{\rm} - c}} - {\rm ln}(b{\rm ln}r)} \right)/{\rm ln}r$$
where k is the breakeven price ratio, i.e. the crop yield (kg) needed to pay for 1 kg N. A value of 6 was used for k, which is typical for the current market and is equivalent to a grain price of £120/t for both wheat and triticale and an N cost of £245/t for ammonium nitrate (34·5% N). The yield at Nopt was calculated from the fitted parameters using Eqn (1).
To examine the effects of species on Nopt, the fitted parameters from step (iii) above were used for each site to calculate a separate Nopt for each variety. A paired t test was done to compare the mean Nopt for wheat with the mean Nopt for triticale at each site. For the 13 sites which included the varieties Beluga, Benetto, Grenado and JB Diego (Table 1), an analysis of variance (ANOVA) was done to examine the effect of variety on Nopt, using site as the block factor.
To examine the effects of species on yield at Nopt, the fitted parameters from step (ii) above were used for each site to calculate a common Nopt for all varieties, which was then used to calculate yield at Nopt as in Eqn 2. A paired t test was done to compare the mean yield at Nopt for wheat with the mean yield at Nopt for triticale at each site. For the 13 sites which included the varieties Beluga, Benetto, Grenado and JB Diego (Table 1), an ANOVA was done to examine the effect of variety on yield at Nopt, using site as the block factor.
A normal type curve with depletion (Murray & Nunn Reference Murray and Nunn1987) was used to fit grain protein responses to N:
 $$y\, = \,d + c \times {\rm exp}( - {\rm exp}( - a \times ({\rm N} - b)))$$
where y is grain protein (% dry matter), N is the amount of N applied (kg N/ha), and a, b, c and d are empirically determined parameters.
Lodging index, biomass, harvest index and crop N content were analysed by split-plot ANOVA.
Paired t tests were done to compare the mean specific weight and mean grain protein for wheat and for triticale at each site. For the 13 sites, which included the varieties Beluga, Benetto, Grenado and JB Diego (Table 1), ANOVAs were done to examine the effect of variety on specific weight and grain protein, using site as the block factor.
Genstat 14th edition (VSN International Ltd.) was used for all statistical analyses.
RESULTS
Lodging
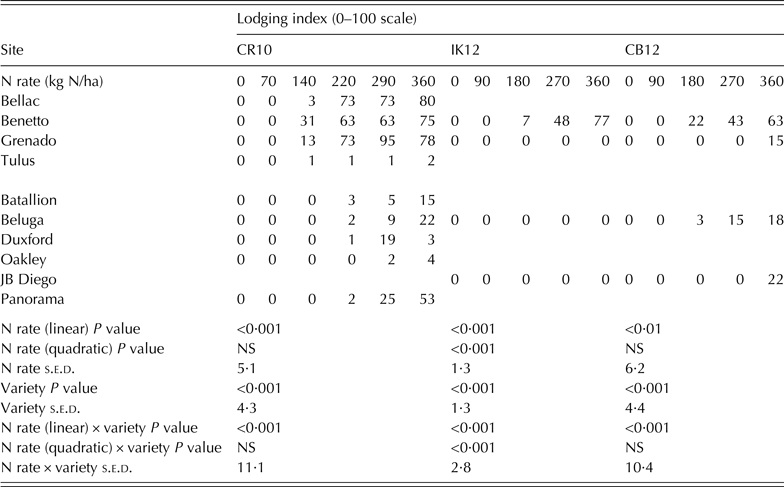
There was no lodging or leaning in any treatment at HM10, HM11, CO11, HM13, HM14-2 or CO14. At CR09 there was a small amount of leaning in Benetto, giving a maximum lodging index of 2·5 at the highest N rate. At HM12 there was a small amount of leaning in Benetto, Grenado and Beluga at the higher N rates in both the first and second cereals, to a maximum lodging index of 8·3. At HM14-1 there was some leaning in all varieties, to a maximum lodging index of 6·7.
Lodging was severe enough that it may have affected yield only at CR10, IK12 and CB12 (Table 3). There were significant effects of N rate and variety at all three sites: lodging severity increased with N rate and was generally more severe in triticale varieties than wheat varieties. At CR10 lodging occurred post-maturity, as harvest of the trial was delayed by a wet summer, which resulted in brackling (bending or breaking of the top stem node) and consequent bird damage in all triticale varieties except Tulus.
Effects of nitrogen (N) rate and variety on lodging index (0–100 scale) for the three experiments in which lodging occurred

NS, not significant.
Yield
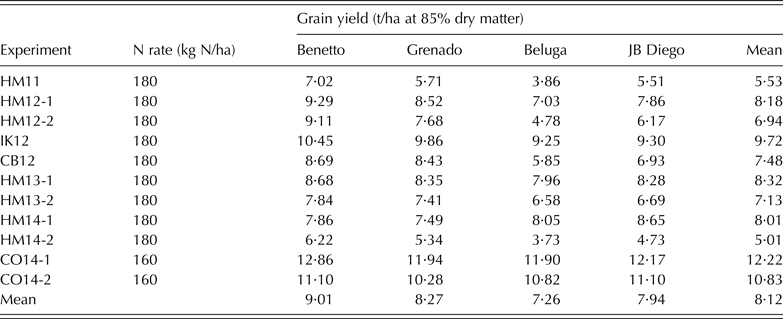
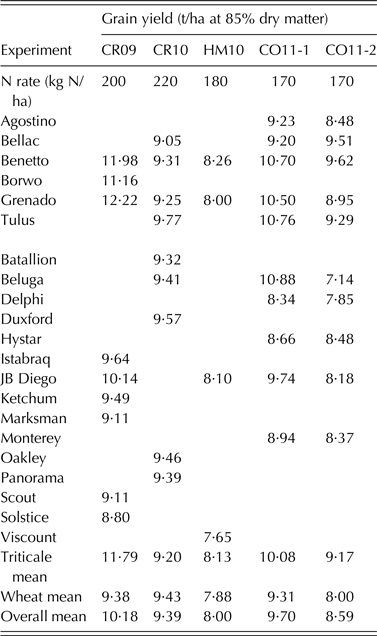
At commercially standard N rates (160–200 kg N/ha), site mean yields ranged from 8·0 to 12·2 t/ha for first cereals and 5·0 to 10·8 t/ha for second cereals. The highest and lowest yielding sites were all in 2014 (Tables 4 and 5).
Grain yield at commercial standard nitrogen (N) rates for the 11 sites including only triticale varieties Benetto and Grenado, and wheat varieties Beluga and JB Diego

NS, not significant.
Grain yield at commercial standard nitrogen (N) rates for the five sites not included in Table 4

The highest yielding variety was a triticale at 14 out of 16 sites, and the mean triticale yield was higher than the mean wheat yield at 13 out of 16 sites. The size of the triticale advantage was not strongly linked to drought conditions in spring, as triticale consistently out-yielded wheat in 2012, a very wet season, as well as in the dry seasons 2009 and 2011.
The mean yield advantage of triticale at standard N rates was 0·53 t/ha (5·9%) for first cereal sites and 1·26 t/ha (17·3%) for second cereal sites. However, the yield advantage of triticale was not linked to site yield potential: the regression of triticale yield advantage over wheat at a common Nopt (t/ha) against site mean yield at Nopt (t/ha) was not significant. Across all sites the mean yield benefit of triticale at optimal N rates was 0·78 t/ha, or 8·8% (P < 0·01).
Yield response to N
At CO11-1 and CO14-2, statistics supported the fitting of linear plus exponential N response curves with all parameters separate; and at CR09, CR10, HM11, CO11-2, CB12, HM13-2, HM14-1 and CO14-1, statistics supported the fitting of curves with all linear parameters separate. In both cases, this gave different optimum N rates for each variety. At the other six sites, parallel response curves were the most suitable option (Fig. 1). The fitted N response curves explained between 0·61 (HM14-2) and 0·98 of the variation (CO14-2).
Fitted linear plus exponential yield responses to nitrogen (N) rate for various triticale varieties (solid lines) and wheat varieties (dotted lines) at 16 sites. Calculated economic optimum N rates are shown for each variety (filled triangles for triticale and open triangles for wheat). Varieties are identified by the first three letters of their name, in roman text for triticale and italics for wheat. Variance explained by fitted curves as follows: CR09 0·96, CR10 0·95, HM10 0·96, HM11 0·89, CO11-1 0·91, CO11-2 0·93, HM12-1 0·82, HM12-2 0·77, IK12 0·96, CB12 0·88, HM13-1 0·90, HM13-2 0·76, HM14-1 0·94, HM14-2 0·61, CO14-1 0·86, CO14-2 0·98.

Species did not have a significant effect on Nopt, as shown by a t-test comparing the mean Nopt for triticale with that of wheat at each site, calculated using parameters from fitted linear plus exponential curves with fixed r parameter, and k = 6 (Eqn (2)). However, variety did affect Nopt (P < 0·01), across the 13 sites which included four varieties in common (Table 1); Nopt was highest for JB Diego (188 kg N/ha), followed by Benetto (178 kg N/ha), Grenado (164 kg N/ha) and Beluga (155 kg N/ha).
At all sites except HM14-1, the variety with the highest yield at its economically optimum N rate was a triticale variety (Fig. 1). When parallel response curves were used to compare yields at a single Nopt for each site, the highest yielding variety was a wheat only at CO14-2; the best wheat and triticale varieties yielded the same at CR10; and at the other 14 sites the highest yielding variety at Nopt was a triticale. When mean triticale and mean wheat yields at a common Nopt for each site were compared, triticale gave a yield benefit of 0·78 t/ha (P < 0·01). Across the sites that included four varieties in common, mean yield at a common Nopt for each site was highest for Benetto (9·88 t/ha), followed by Grenado (9·20 t/ha), JB Diego (8·95 t/ha) and Beluga (8·48 t/ha) (P < 0·001). The average yield benefit of triticale over wheat was 1·01 t/ha (12·4%) as a second cereal compared with 0·48 t/ha (5·0%) as a first cereal.
Biomass and nitrogen partitioning
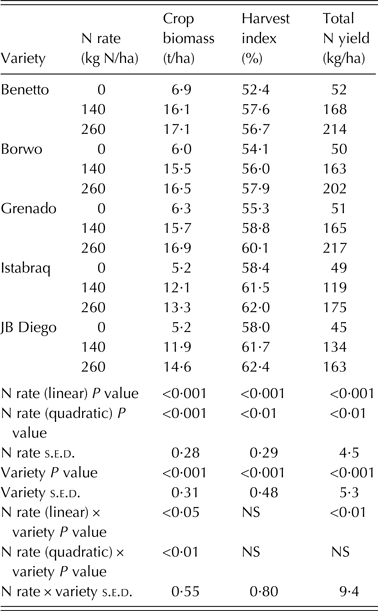
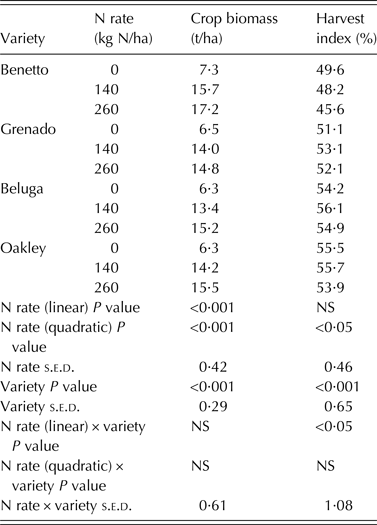
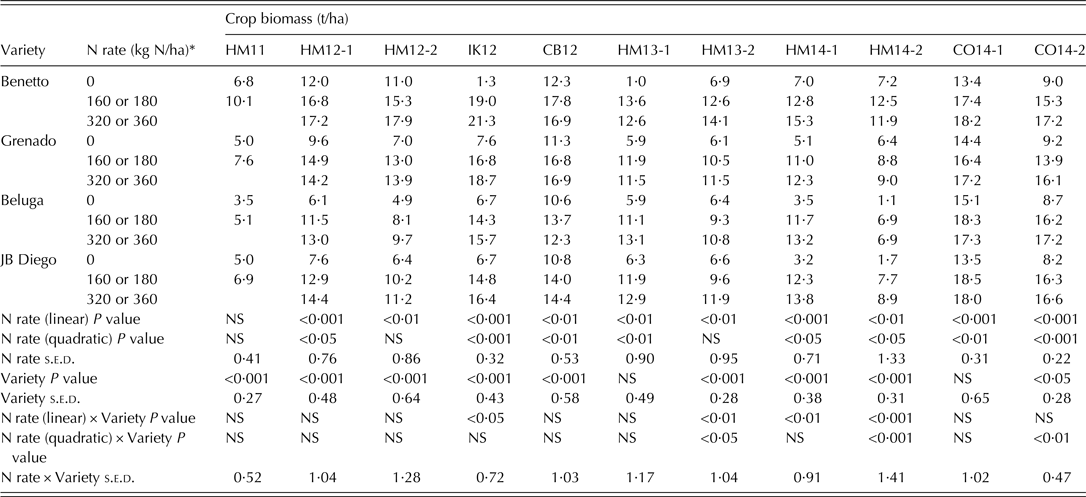
Site mean crop biomass at commercially standard N rates (140–180 kg N/ha) ranged from 12·0 t/ha (HM14-1) to 17·6 t/ha (CO14-1) for first cereals and 7·4 t/ha (HM11) to 15·6 t/ha (CB12) for second cereals. Variety had a significant effect on total crop biomass at 11 of the 13 sites at which biomass was measured (Tables 6–8). At seven of these sites, all the triticale varieties had higher mean biomass than all the wheat varieties; at a further three sites, the variety with highest biomass was a triticale variety. The high biomass of triticale relative to wheat was caused by it having both higher grain yield (Fig. 1) and higher straw yield than wheat at most sites. Biomass increased with N rate at all sites but there was a significant interaction between N rate and variety at only five out of 13 sites. At these sites, the difference in biomass between triticale and wheat varieties was larger at the lower N rates than at the highest N rate.
Effects of nitrogen (N) rate and variety on total crop biomass, harvest index and total N yield at CR09

NS, not significant.
Effects of nitrogen (N) rate and variety on total crop biomass and harvest index at CR10

NS, not significant.
Effects of nitrogen (N) rate and variety on total crop biomass at 11 sites

NS, not significant
* N rates 0, 160 and 320 kg N/ha were used in the CO14 experiments; N rates 0, 180 and 360 kg N/ha were used in all other experiments.
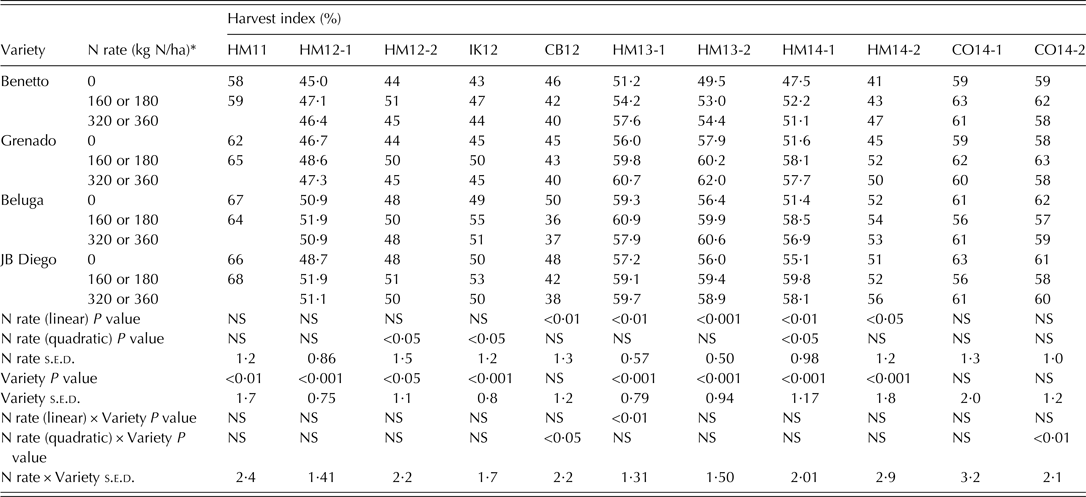
Site mean harvest index at commercially standard N rates (140–180 kg N/ha) ranged from 49·9% (HM12-2) to 59·1% (CO14-1) for first cereals and 40·7% (CB12) to 63·8% (HM11) for second cereals. Variety had a significant effect on harvest index at ten of the 13 sites at which biomass was measured (Tables 6, 7 and 9). At seven of these sites, all the triticale varieties had lower harvest index than all the wheat varieties; at the remaining three sites, the triticale variety Benetto had the lowest harvest index, but Grenado had higher harvest index than at least one of the wheat varieties. Nitrogen rate had a significant effect on harvest index at seven sites, with harvest index generally increasing from 0 N to the middle N rate, but varying little between the middle and top N rates. There was a significant interaction between N rate and variety at only three sites.
Effects of nitrogen (N) rate and variety on harvest index at 11 sites

NS, not significant
* N rates 0, 160 and 320 kg N/ha were used in the CO14 experiments; N rates 0, 180 and 360 kg N/ha were used in all other experiments.
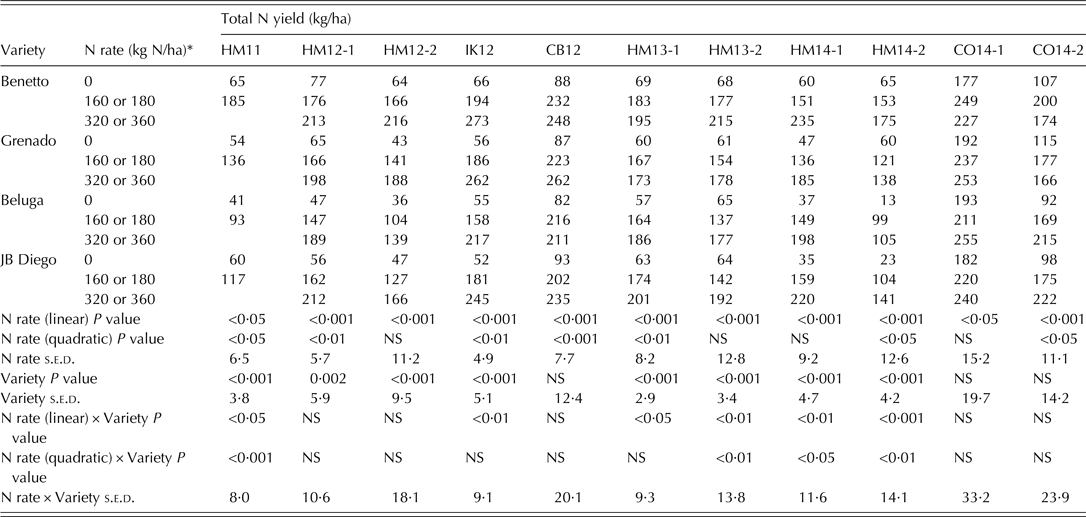
Site mean crop N content at commercially standard N rates (140–180 kg N/ha) ranged from 149 kg N/ha (HM14-1) to 229 kg N/ha (CO14-1) for first cereals and 119 kg N/ha (HM14-2) to 218 kg N/ha (CB12) for second cereals. Variety had a significant effect on total crop N content at nine of the 12 sites at which crop N content was measured (Tables 6 and 10). At six of these sites, all the triticale varieties had higher average crop N content than all the wheat varieties; at four of the remaining sites, the triticale variety Benetto had the highest N content but Grenado had lower N content than at least one of the wheat varieties. Nitrogen content increased with N rate at all sites, and there was a significant interaction between N rate and variety at six sites. At most of these sites, triticale varieties had a higher N content at 0 N than the wheat varieties, or a steeper increase in N content between 0 N and the middle N rate.
Effects of nitrogen (N) rate and variety on total crop N yield at 11 sites

NS, not significant
* N rates 0, 160 and 320 kg N/ha were used in the CO14 experiments; N rates 0, 180 and 360 kg N/ha were used in all other experiments.
Yield components
There was a significant effect of N rate on all yield components at all four sites, except for ears/m2 at HM14-2, for which there was unusually high variation in the data (Fig. 2). However, TGW was less responsive to N rate than ears/m2 and grains/ear.
Effects of N rate on the yield components ears/m2, grains/ear and thousand grain weight (g at 85% dry matter) for various triticale varieties (solid lines) and wheat varieties (dotted lines) at four sites.

There was a significant effect of variety on all yield components at all four sites, except for grains/ear at HM14-2. There were significant interactions between N rate and variety only for ears/m2 at HM14-2 and TGW at CR09 and CR10.
The high yield of triticale relative to wheat at CR09 and HM14-2 (Fig. 1) resulted from a combination of more ears/m2 and more grains/ear; triticale varieties did not have higher TGW than wheat at these sites (Fig. 2). At CR10 wheat and triticale yields were very similar, but there were differences in yield components: triticale varieties had more grains/ear but lower TGW than wheat. At HM14-1, where triticale varieties had higher yield than wheat at 0 N but lower yield than wheat at higher N rates, triticale again had more grains/ear but lower TGW.
Grain quality
Across all sites, triticale had a lower mean specific weight than wheat: 70·12 kg/hl for triticale, compared with 73·27 kg/hl for wheat (P < 0·001). When the four most commonly used varieties were compared across 13 sites, the mean values were 74·78 kg/hl for JB Diego, 71·79 kg/hl for Beluga, 70·92 kg/hl for Benetto and 70·40 kg/hl for Grenado (P < 0·001).
Across all sites, triticale had a lower mean grain protein than wheat: 10·38% for triticale, compared with 10·82% for wheat (P < 0·05). When the four most commonly used varieties were compared across 13 sites, the mean values were 10·97% for JB Diego, 10·86% for Beluga, 10·48% for Benetto and 10·35% for Grenado (P < 0·001). At individual sites there was some overlap between grain protein in wheat and triticale varieties (Fig. 3), but there was a trend for most triticale varieties to have lower grain protein than most wheat varieties, across all N rates.
Fitted normal type curves with depletion showing grain protein (% dry matter) responses to nitrogen (N) rate (kg/ha) for various triticale varieties (solid lines) and wheat varieties (dotted lines) at 15 sites. Grain protein was not measured at HM10.

Discussion
The current experiments demonstrate beyond doubt that triticale varieties can consistently out-yield wheat varieties on good soils representative of the majority of UK arable production. The main wheat varieties included in the current study (Beluga and JB Diego) have been widely grown commercially since 2010 and 2008, respectively, and still yield 102% of the yield of control varieties in the UK Recommended List (Anon 2015a ). JB Diego was the most popular variety grown in 2015, comprising 0·10 of the winter wheat area in England and Wales (Anon 2015b ). Before conducting the current experiments, nobody in the arable industry or research community in the UK would have credited triticale as being capable of out-yielding the best wheat varieties. Given the acknowledged lower input requirements for triticale, it should be seen as a potential crop to deliver sustainable intensification; growing more with less (Tilman et al. Reference Tilman, Balzer, Hill and Befort2011).
It has been shown that the yield benefit of triticale relative to wheat is not confined to marginal soils, since triticale yields at optimum N rates exceeded 9 t/ha in all first cereal experiments and 6·5 t/ha in all second cereal experiments, and the yield advantage of triticale over wheat did not correlate negatively with site mean yield. Similarly, although triticale is known to be less susceptible than wheat to drought (Erekul & Köhn Reference Erekul and Köhn2006; Estrada-Campuzano et al. Reference Estrada-Campuzano, Slafer and Miralles2012), the current experiments show that triticale can out-yield wheat even when water is not limiting; in 2012 England had the wettest April to June period and the wettest year on record, yet in each of the four 2012 experiments, the best triticale variety out-yielded the best wheat variety by more than 1 t/ha.
The current experiments also confirm that the yield benefit of triticale over wheat is greater as a second cereal than as a first cereal. This is thought to be chiefly due to take-all resistance or tolerance in triticale (Gutteridge et al. Reference Gutteridge, Hornby, Hollins and Prew1993, Reference Gutteridge, Bateman and Todd2003; Overthrow & Carver Reference Overthrow and Carver2003; Clarke et al. Reference Clarke, Roques, Weightman and Kindred2016). However, triticale does not provide a take-all break in the rotation, as it is still susceptible to take-all, and may even allow greater build-up of the take-all pathogen Gaeumannomyces graminis in the soil than the more susceptible wheat (Bithell et al. Reference Bithell, Butler, Harrow, Mckay and Cromey2011). Differences in take-all measured on a sub-set of the current experiments showed only modestly lower infections in the triticale varieties (Clarke et al. Reference Clarke, Roques, Weightman and Kindred2016).
The yield benefit of triticale over wheat results from greater total biomass rather than greater harvest index. The yield benefit was also mainly associated with more grains per ear, as found by Estrada-Campuzano et al. (Reference Estrada-Campuzano, Slafer and Miralles2012), with little difference in ears/m2. Other measurements made on a sub-set of the current trials showed higher light interception from triticale despite a similar green area index (GAI), and an earlier onset and longer duration of grain filling (Clarke et al. Reference Clarke, Roques, Weightman and Kindred2016). The same study showed little evidence of greater rooting to depth in triticale. It therefore seems that a combination of source (greater light capture) and sink strength (grains/ear) may be driving the higher yields. Further investigations are required to properly understand the physiological basis of the yield advantage of triticale, including consideration of radiation use efficiency which was not possible here. Such an analysis could be enlightening to prioritize traits for selection for wheat breeding improvement as well as triticale and other cereals. Blum (Reference Blum2014) puts the greater yield potential of triticale down to greater stomatal conductance (Motzo et al. Reference Motzo, Pruneddu and Giunta2013) and lower respiration rates (Winzeler et al. Reference Winzeler, McCullough and Hunt1989).
Triticale's reputation for a higher lodging risk relative to wheat, due to its greater height, was confirmed by the three experiments in which substantial lodging occurred. However, the absence or low severity of lodging in the other 13 experiments, even at super-optimal N rates, and the high yield of triticale even where lodging had occurred, indicate that lodging risk need not be a substantial barrier to triticale cultivation, though it remains a concern given the devastating impact of lodging in a high-risk year (Berry et al. Reference Berry, Spink, Sterling and Pickett2003). The experience of brackling after maturity in the wet harvest at CR10 demonstrates the importance of a timely harvest for triticale. All the experiments received robust applications of plant growth regulators (PGRs), and it seems clear that these are required to support high yields at high N rates.
The reputation of triticale for effective N scavenging (Jørgensen et al. Reference Jørgensen, Deleuran and Wollenweber2007; Alaru et al. Reference Alaru, Laur, Eremeev, Reintam, Selge and Noormets2009) is somewhat supported by the current results, with all triticale varieties having higher recovery of soil N at zero N than all wheat varieties at seven of the 12 sites at which it was measured. However, the triticale advantage was less convincing in Grenado, which had lower N recovery at zero N than at least one wheat variety at the other five sites.
In contrast to initial expectations, the current experiments have not shown triticale to have a consistently lower optimum N rate than wheat. This is in contrast to a parallel study with 20 wheat varieties and the triticale variety Grenado in five N response experiments in 2011 and 2012, in which Grenado gave significantly lower N optima (Sylvester-Bradley et al. Reference Sylvester-Bradley, Kindred, Berry, Storer, Kendall and Welham2015). However, given the correlation between yield and N requirement seen in wheat (Sylvester-Bradley & Kindred Reference Sylvester-Bradley and Kindred2009), the higher yield of triticale than wheat might reasonably be expected to be associated with a higher N requirement, which is not apparent. Triticale varieties therefore have high yields for their N optima and could be described as HYLO: high yield low optima (Kindred & Sylvester-Bradley Reference Kindred and Sylvester-Bradley2010). For the four varieties which were common to most experiments, mean nitrogen use efficiency (NUE; kg grain produced per kg fertilizer N applied) at Nopt was 65·0 kg grain/kg N for Benetto, 63·7 kg/kg for Grenado, 62·0 kg/kg for Beluga and 59·2 kg/kg for JB Diego. The higher NUE of triticale than wheat resulted mostly from higher N uptake indicating greater N fertilizer recovery by triticale than by wheat. The lower grain protein content of triticale also reduces crop demand for N in the grain, hence may contribute to a relatively reduced N optima (Sylvester-Bradley & Kindred Reference Sylvester-Bradley and Kindred2009).
The lack of a consistent difference between N optima for wheat and triticale casts doubt upon the UK fertilizer guidelines for triticale, which recommend applying a maximum of 150 kg N/ha to triticale; in contrast, the maximum recommendation for winter wheat on medium or deep clay soils is 250 kg N/ha (Anon 2010). In the current experiments, the average Nopt for triticale was below 150 kg N/ha at only two out of 16 sites. Consequently, it is probable that many triticale crops are failing to realize their yield potential due to underfertilization. No statistical justification was found for a lower N recommendation for triticale than for wheat, where grain prices are equal; however, where triticale grain is sold at a discount to wheat, this reduces its breakeven ratio k and hence the Nopt (Eqn (2)).
The consistently high yields of triticale demonstrated in the present study should make it an attractive crop for growers, particularly in the second cereal position in the rotation. However, there remains a lack of demand for triticale in the grains market. In the UK, triticale typically trades at prices 2–10% lower than wheat as a feed grain. Whilst the lower grain protein content, lower specific weight and higher viscosity of triticale grain must be acknowledged, it seems the major reasons for the lower price compared to wheat are that the low volumes grown and traded lead to extra costs in storage and distribution, an inconsistent supply hinders its use by major suppliers of feed formulations, and the lack of a commodities market means it cannot be traded forward. If more triticale grain were available however, at the right price, there would seem little physical or nutritional reason why it could not be used to a much greater extent in ruminant and non-ruminant diets. Assuming a conservative 5% yield advantage of triticale over second wheat (12% mean in the present study) a 20% switch to triticale of the estimated 500 000 ha of second wheat could give an additional 40 000 t grain per year, worth over £5 million/year to UK farmers. An impetus is required to create sufficient demand for farmers to have the confidence to grow triticale, yet sufficient volume is required for traders and end-users to confidently incorporate triticale into their systems. Use as a feedstock for bioethanol production could potentially provide such an impetus; there is a potential feedstock demand for over 2 million t/year of cereals in the UK, for which analyses from samples reported in the present study (Weightman et al. Reference Weightman, Kindred and Clarke2011; Clarke et al. Reference Clarke, Roques, Weightman and Kindred2016) and other European (Obuchowski et al. Reference Obuchowski, Banaszak, Makowska and Luczak2010) and international studies (Beres et al. Reference Beres, Pozniak, Eudes, Graf, Randhawa, Salmon, Mcleod, Dion, Irvine, Voldeng, Martin, Pageau, Comeau, Depauw, Phelps and Spaner2013a , Reference Beres, Pozniak, Bressler, Gibreel, Eudes, Graf, Randhawa, Salmon, Mcleod, Dion, Irvine, Voldeng, Martin, Pageau, Comeau, Depauw, Phelps and Spaner b ) have shown the suitability of triticale. Lower protein is associated with higher ethanol yields (Kindred et al. Reference Kindred, Verhoeven, Weightman, Swanston, Agu, Brosnan and Sylvester Bradley2008). Furthermore, the higher yield of triticale gives it better GHG savings; using the approach and emission factors for N fertilizer and other inputs used by Sylvester-Bradley et al. (Reference Sylvester-Bradley, Kindred, Wynn, Thorman and Smith2014) gives 490 kg CO2e/t grain for Benetto compared with 590 kg CO2 e/t grain for JB Diego, with both grown as second cereals at 200 kg N/ha (Clarke et al. Reference Clarke, Roques, Weightman and Kindred2016). Crucially, to use triticale in bioethanol production requires sustainability reporting and calculation of GHG savings (Renewable Energy Directive 2009/28/EC, EU 2009) which in turn requires official recognition of yields; the current official Defra statistics give yields for triticale half those of wheat, as do widely used reference sources such as Nix (Reference Nix2014). For triticale to meet its potential for delivering greater productivity and increased food security it is crucial that the yields communicated to the industry through such sources are accurate and reflect what is achievable.
Longer term, the technical improvement of triticale grain quality so it can compete with wheat for human consumption, is seen by Blum (Reference Blum2014) as the best prospect for triticale increasing its area globally. Research is ongoing (McGoverin et al. Reference McGoverin, Snyders, Muller, Botes, Fox and Manley2011), but various quality traits hinder its suitability as an alternative to wheat for milling (Dennett et al. Reference Dennett, Wilkes and Trethowan2013; Dennett & Trethowan Reference Dennett and Trethowan2013).
The short history and low adoption of triticale, relative to wheat, means that the breeding effort, which has been expended on triticale is much less than that on wheat, especially in the UK where there has been no recent breeding specifically for or in the UK environment. This makes the superior yield of unadapted triticale varieties over elite UK wheat varieties even more impressive, and suggests that there may be more scope for yield improvements in triticale than in wheat. Furthermore, even if triticale is not widely taken up as a crop in its own right, its high N uptake and biomass yield may provide insights to further wheat breeding. Recent increases in wheat yield potential have more often been associated with increased biomass than increased harvest index (Foulkes et al. Reference Foulkes, Snape, Shearman, Reynolds, Gaju and Sylvester-Bradley2007); hence, further understanding the physiological causes of the yield advantage of triticale is important.
The drafting of the present paper and the management of experiments from 2012 to 2014 was co-funded by Innovate UK in partnership with ADAS, Agrovista, Ensus, GrowHow, RAGT, Saaten Union and Senova. Experiments at HM in 2010 and 2011 and grab sample measurements for HM in 2012–2014 were funded by AHDB Cereals & Oilseeds (formerly HGCA). Experimental funding for CR09 and CR10 is gratefully acknowledged from RAGT, Senova, Syngenta and Saaten Union, and funding from BASF is acknowledged for CR10. The authors thank Chris Dyer and Denise Ginsburg of ADAS UK Ltd. for statistical help.