Introduction
Environmental and genetic factors influence organ development, potentially leading to abnormal functional and structural effects in tissues and organs. Nowadays, both arterial hypertension and obesity are prevalent public health problems, which may be related to an adverse event that occurs during intrauterine development. Gestational protein restriction is associated with low birthweight and increased risk for the development of cardiovascular diseases and metabolic syndrome in adult life.Reference Ashton 1 – Reference Barker 4 Maternally underfeeding offspring in adulthood present pronounced reduction of nephron numbers associated with glomerular hyperfiltration/overflow that may account for the glomerular filtration barrier breakdown and early glomerulosclerosis, decreased fractional urinary sodium excretion and higher blood pressure when compared with a standard-diet-fed age-matched group.Reference Mesquita, Gontijo and Boer 5 – Reference Sene L de, Mesquita and de Moraes 7 On the other hand, in the modern lifestyle, the eating habits of the worldwide population include a general preference for high-fat and carbohydrate-rich compound diets. These habits interact with genetic factors, which may explain the increasing rates of excessive body fat worldwide.Reference Finucane, Stevens and Cowan 8 , Reference Grubbs, Lin and Vittinghoff 9 Early high-fat diet (HFD) intake and obesity are related to the increased prevalence of cardiovascular disease, dyslipidemia, type 2 diabetes mellitus and chronic kidney disease.Reference Parker 10 , Reference Haslam and James 11
A recent study has demonstrated progressive kidney dysfunction in female rats after 9 weeks of HFD intake.Reference Pinhal, Lopes and Torres 12 This disorder occurred in parallel to glomeruli podocyte injuries associated with enhanced expression of proteins intrinsically related to the fibrotic process (TGF-β1, collagen and fibronectin). Angiotensin II (AngII) stimulates the proliferation of kidney fibroblasts in culture and increases the expression of messenger RNA encoding transforming growth factor-beta (TGF-β), fibronectin and collagen type I.Reference Sene L de, Mesquita and de Moraes 7 , Reference Pinhal, Lopes and Torres 12 – Reference Ruiz-Ortega and Egido 16 In addition, we observed proteinuria and renal sodium and water retentionReference Pinhal, Lopes and Torres 12 in this model and in obese rat subjects.Reference De Almeida, Monte-Alegre, Zanini, Souza, Etchebehere and Gontijo 17 In a recent study, Grubbs et al.Reference Grubbs, Lin and Vittinghoff 9 showed that obesity is associated with declines in kidney function in a cohort of young adults with preserved glomerular filtration rate (GFR) at baseline.
Taking these findings into account, evidence suggests that an absolute reduction in the number of nephrons may sensitize to renal injury in obese subjects. In this way, body mass and nephron number mismatch, observed in maternally underfed offspring and potentially involved in obesity-related glomerulopathy, may therefore originate from the fetal environment. However, the exact mechanism involved in kidney disorders provoked by HFD ingestion and obesity is not established. Thus, in the current study, we investigated the effect of early-age and long-term HFD intake on renal function and arterial blood pressure in gestational protein-restricted offspring when compared with standard-diet age-matched controls. In addition, the expression of type 1 AngII receptor (AT1R), fibrotic markers and urinary protein excretion rate were evaluated in parallel with scanning electron microscopy (SEM) to verify the impact on glomerular structure and function.
Materials and methods
Animals and diets
The experiments were conducted on age-matched rats of sibling-mated Wistar HanUnib rats (0.250–0.300 kg) that were allowed free access to water and standard rodent chow (Nuvital, Curitiba, Brazil). The experimental protocol was approved by the Institutional Ethics Committee (CEUA/UNESP #408) and the general guidelines established by the Brazilian College of Animal Experimentation were followed throughout the investigation. The day that sperm was observed in the vaginal smear was designated as day 1 of pregnancy. In total, 40 dams were maintained on isocaloric standard rodent laboratory diet with free access to tap water and standard rat laboratory chow (Na content: 135±3 μEq/g; K content: 293±5 μEq/g), with normal protein (17%) content (NP, n=20) or low protein (6%) content (LP, n=20) diet ad libitum intake throughout the entire pregnancy. The male pups weaned in 3 weeks and only one offspring of each litter was used for each experiment. The dams and offspring were maintained under a controlled temperature (25°C) and lighting conditions (07:00 am–07:00 pm) and, male pups were followed up to 14 weeks of age. The male pups were followed and maintained with normal diet until 8 weeks of age. From the 8th to 13th week, animals of the NP group were fed with a standard diet (NPN group, n=10, diet with 2.93 cal/g) or HFD (NPH group, n=10, diet with 5.44 cal/g). The HFD, AIN-93G modified diet such as recommended to support growth, pregnancy and lactation phases by American Institute of Nutrition, 1993.Reference De Almeida, Monte-Alegre, Zanini, Souza, Etchebehere and Gontijo 17 The LP animal group was also divided into two groups, one receiving a standard diet (LPN group, n=10) and one on HFD (LPH group, n=10). About 14-week-old rats were sacrificed and the pelvic, gonadal and retroperitoneal adipose tissue was removed and weighed. The adiposity index was calculated by the ratio of the total adipose tissue weight to body weight.
Blood pressure measurement
Arterial pressure was measured at the 8th, 10th and 12th weeks (n=8–10 rats for each group), using an indirect tail-cuff method combined with a pneumatic pulse transducer/amplifier (IITC Life Science, BpMonWin Monitor Version 1.33). This indirect approach allowed repeated measurements with a close correlation (correlation coefficient=0.975) compared with a direct intra-arterial recording.Reference Mesquita, Gontijo and Boer 5 – Reference Sene L de, Mesquita and de Moraes 7 , Reference Pinhal, Lopes and Torres 12
Renal function evaluation
The GFR and tubule sodium handling were estimated, respectively, by creatinine (CCr) and lithium clearances (CLi) in conscious rats at 14 weeks of age. In brief, 14 h before the renal test, 60 µmol LiCl 100 g−1 body weight was provided by gavage. After an overnight fast, each animal received a load of tap water by gavage (5% of body weight); followed by a second load of the same volume 1 h later and spontaneously voided urine was collected over a 120 min period into a graduated centrifuge tube. At the end of the experiment, blood samples were drawn through cardiac puncture in anaesthetized rats, and urine and plasma samples were collected for analysis.Reference Pinhal, Lopes and Torres 12 , Reference Furlan, Marshal and Macedo 13 , Reference Roza, Possignolo, Palanch and Gontijo 18 Plasma and urine sodium, potassium and lithium concentration were measured by flame photometry (Micronal, B262, São Paulo, Brazil), whereas creatinine concentrations were determined spectrophotometrically (Instruments Laboratory, Genesys V, USA). Proteinuria was detected using the BIOPROT U/LCR (Bioclin) and urine pH was determined using a pH metre (Qx1500, Qualxtron) weekly from the 8th to 14th week of age.
Serum lipid levels
The serum cholesterol (BIOCLIN K-083), triglyceride (BIOCLIN K-117) and high-density lipoprotein (HDL) cholesterol (BIOCLIN K-015) levels were determined by the enzyme-colorimetric method for absorbance at 500 nm, whereas the serum levels of low-density lipoprotein (LDL) cholesterol (BIOCLIN K-088) were analyzed at an absorbance of 600 nm.
Histology and immunohistochemistry (IHC)
Kidneys were removed, weighed and placed in fixative (paraformaldehyde 4% in 0.1 M phosphate buffer, pH 7.4) for 15 h, followed by 70% alcohol, until being processed for paraffin inclusion. The paraffin blocks were cut into 5 µm thick sections. The picrosirius technique was used to evaluate the density of collagen. Ten cortical fields of histological sections (n=5 for each group) were analyzed, and the average of the readings determined the density of collagen. Images were captured with a photo microscope and analyzed by Leica Qwin 3.1 for Windows. For IHC, paraffin sections were incubated overnight at 4°C with primary antibodies for TGF-β1 (sc-146 Santa Cruz, 1:200), AT1R (sc-1173 Santa Cruz, 1:150) and fibronectin (sc-18825 Santa Cruz, 1:300). Secondary antibodies were used according to the primary antibody. Finally, sections were revealed with 3,3′-diaminobenzidine (DAB), counterstained with Mayer’s hematoxylin, dehydrated and mounted. The images were stored and analyzed using the Image-J software. Briefly, the boundaries of glomeruli and tubules were traced manually using a computer mouse and the mean of intensity/area of each was calculated automatically. All of the sections used for quantification were from experiments in which the immunostaining was considered optimal and conduced in the same day. No immunoreactivity was observed in the control experiments in which the primary antibodies were omitted.
SEM
In the 14th week of age, male rats from all groups (NPN n=3; NPH n=3; LPN n=3; LPH n=3) were used. The rats were anaesthetized with a mixture of ketamine (75 mg/kg body weight, i.p.) and xylazine (10 mg/kg body weight, i.p.) and perfused by the left carotid artery with saline containing heparin (5%) for 15 min under constant pressure. This was followed by perfusion with 0.1 m phosphate buffer (PB; pH 7.4) containing 4% (w/v) paraformaldehyde and 0.1 m sucrose for 25 min. After perfusion, renal cortical slices were immersed in Karnovsky’s fixative (2% glutaraldehyde, 2% paraformaldehyde in 0.1 m phosphate buffer, pH 7.4) at 4°C overnight. After rinsing in phosphate buffer for 1 h, the specimens were post-fixed in buffered 1% OsO4 at 4°C in the dark for 2 h and immersed in a 2.3 m sucrose solution at 4°C overnight. The specimens were subsequently immersed for 30 min in liquid nitrogen and then fractured, washed in the same buffer, dehydrated in a graded acetone series and critical-point dried (Leica CPD030). After identifying the fractured surface, the specimens were mounted on stubs, sputtered (SCD050, Bal-Tec) with gold for 120 s and examined and photographed with an SEM (Quanta 200; FeiCompany) operated at 10 kV.
Data presentation and statistical analysis
The results are expressed as the mean±s.d. or median and quartile deviation when appropriate. CCr was used to estimate the GFR and CLi was used to assess the proximal tubule output.Reference Pinhal, Lopes and Torres 12 , Reference Furlan, Marshal and Macedo 13 , Reference Roza, Possignolo, Palanch and Gontijo 18 Fractional sodium excretion (FENa) was calculated as CNa/CCr×100, where CNa is sodium clearance and CCr is creatinine clearance. The fractional-proximal (FEPNa) and post-proximal (FEPPNa) sodium excretion were calculated as CLi/CCr×100 and CNa/CLi×100, respectively. The data obtained over time were analyzed using one-way ANOVA, a repeated measures two-way ANOVA, or non-parametric analysis by the Kruskal–Wallis test. Post-hoc comparisons between selected means were performed with Bonferroni’s contrast test when the initial ANOVA indicated statistical differences between the experimental groups. Data analysis was performed with GraphPad Prism 5.00 for Windows (1992–2007 GraphPad Software Inc., La Jolla, CA, USA). The level of significance was set at P⩽0.05.
Results
Birthweight, body weight, body adiposity index, blood pressure and serum lipid levels
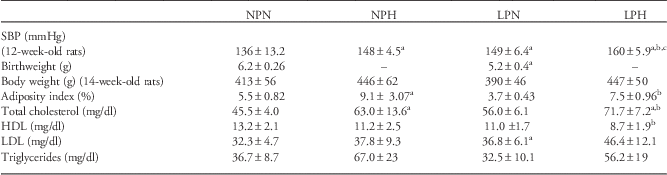
The present study shows that LP male pup birthweight was significantly reduced when compared with that of NP pups (NP: 6.2±0.26 g, n=150 v. 5.2±0.4 g, n=146, P<0.0001). However, the body masses at 14-week-old were similar to observed in NP age-matched group (NPN 413±56 g; NPH 446±62 g; LPN 390±46 g; LPH 447±50 g, n=9) (Table 1). The Table 1 also shows an increased body adiposity index in 14-week-old HFD offspring (NPH and LPH, n=20 rats for each group) when compared with control groups. In addition, beyond the 10th week of age, LPN (n=8–10) rats presented increased blood pressure compared with that found in NPN (n=8–10) offspring. Moreover, LPH offspring had a higher arterial pressure than age-matched NPH and NPN (n=8–10 for each group) rats (Table 1). LPH offspring had lower levels of HDL cholesterol compared with the control group (NPN), and the LDL cholesterol level in the LPH group was significantly higher than compared with the NPN group. The total cholesterol and triglyceride levels were higher in the NPH and LPH groups compared with NPN and LPN rats (Table 1).
The results of systolic blood pressure (SBP), adiposity index and serum lipid profiles are expressed as the mean±s.d.

NPN, normal protein-intake offspring fed standard rodent; NPH, normal protein-intake offspring fed high-fat diet; LPN, maternal protein-restricted offspring fed standard rodent; LPH, maternal protein-restricted offspring fed standard rodent; HDL, high-density lipoprotein; LDL, low-density lipoprotein.
Data were analyzed using one-way ANOVA with post-hoc comparisons by Bonferroni’s contrast test.
The level of significance was set at P⩽0.05; a v. NPN, b v. LPN and c v. NPH.
Renal function data
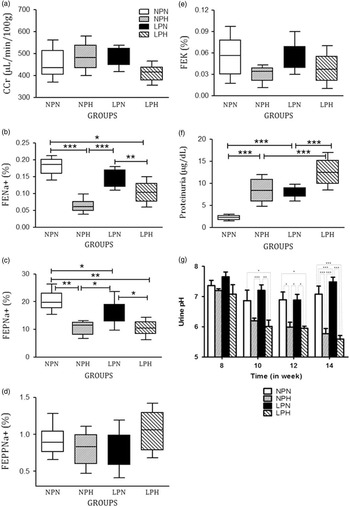
Our results show a decreased fractional urinary sodium excretion (FENa+) in NPH, LPN and LPH offspring compared with the NPN group, associated with an unchanged GFR, estimated by CCr. The decreased FENa+ in HFD offspring (NPH and LPH) was accompanied by enhanced proximal tubular sodium reabsorption (FEPNa+), whereas post-proximal sodium (FEPPNa+) and potassium handling did not differ among the groups (Fig. 1a–1e). Increased proteinuria was observed in NPH and LPN rats and was strikingly accentuated in LPH offspring when compared with urinary protein excretion in the NPN group (Fig. 1f). Our results also show a pronounced reduction in urinary pH in HFD-intake offspring from the 8th to 14th week (Fig. 1g).
(a) Creatinine clearance (CCr), (b) fractional sodium excretion (FENa), (c) proximal (FEPNa) and (d) post-proximal (FEPPNa) fractional sodium excretion, (e) fractional potassium excretion (FEK), (f) urinary pH and (g) proteinuria excretion in 14-week-old offspring. n=8 for each experimental group. The results are expressed as the median and quartile deviation. Renal data were analyzed using non-parametric analysis by a Kruskal–Wallis test with post-hoc comparisons by Bonferroni’s contrast test; urinary pH data were analyzed using two-way ANOVA test; the level of significance was set at P⩽0.05. *P<0.05, **P<0.001, ***P<0.0001. NPN, normal protein-intake offspring fed standard rodent; NPH, normal protein-intake offspring fed high-fat diet; LPN, maternal protein-restricted offspring fed standard rodent; LPH, maternal protein-restricted offspring fed standard rodent.

Histology and IHC
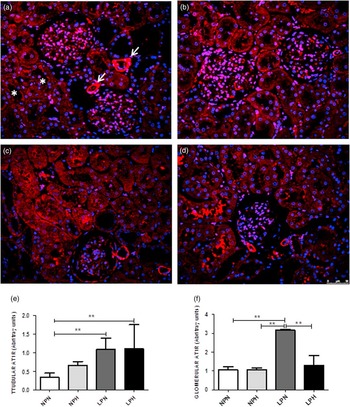
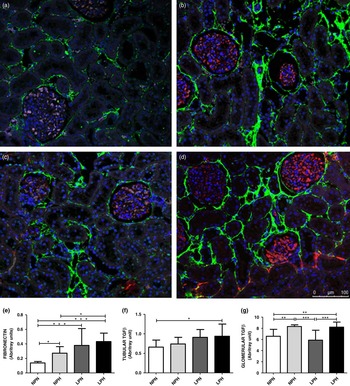
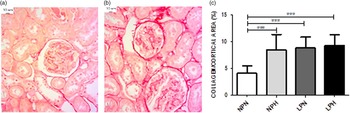
According to the IHC results, the kidney showed a higher basolateral tubular and glomerular AT1R expression in the LPN and LPH groups when compared with NPN offspring (Fig. 2). The kidney TGF-β1 expression was enhanced in animals submitted to LP and HFD (Fig. 3). We observed increased expression of fibronectin in the glomerular capsule and peritubular spaces in NPH and LPN and prominently in LPH offspring when compared with the control group (Fig. 3). By picrosirius technique estimation, we saw a significant enhancement of collagen content in the renal cortical region in LP and HFD offspring when compared with that observed in the NPN group (Fig. 4).
Renal AT1R immunostaining. In the control (a), we can observe localization in the vascular wall (arrow) and apical tubular membrane (*). In the NPH group (b), AT1R expression was more intensive in the glomeruli and basolateral portion of the tubular cells. The enhancement was more evident in the LPN and LPH groups [(c) and (d), respectively and (e)]. Only in LPN the glomerular immunostaining was significantly enhanced (f). The results are expressed as the mean±s.d.; data were analyzed using one-way ANOVA with post-hoc comparisons by Bonferroni’s contrast test; the level of significance was set at P⩽0.05. **P<0.001. NPN, normal protein-intake offspring fed standard rodent; NPH, normal protein-intake offspring fed high-fat diet; LPN, maternal protein-restricted offspring fed standard rodent; LPH, maternal protein-restricted offspring fed standard rodent.

Renal fibronectin (green) and TGF-β1 (red) immunostaining. In control (a) we can observe a basal membrane content of fibronectin and NPH (b), LPN (c) and LPH (d) groups present raised content that was more evident in the later. The groups submitted to high fat diet present enhanced glomerular TGF-β1 expression. In (e), (f) and (g) we have the results of immunofluorescence quantification. Data were analyzed using a repeated measures two-way ANOVA with post-hoc comparisons by Bonferroni’s contrast test. Data were analyzed using one-way ANOVA with post-hoc comparisons by Bonferroni’s contrast test; the level of significance was set at P⩽0.05. *P<0.05, **P<0.01, ***P<0.001. NPN, normal protein-intake offspring fed standard rodent; NPH, normal protein-intake offspring fed high-fat diet; LPN, maternal protein-restricted offspring fed standard rodent; LPH, maternal protein-restricted offspring fed standard rodent.

Using the picrosirius technique for collagen observation, we can see in (a), a representative image from the NPN group and in (b), the pattern found in the LPH group. In (c), cortical collagen quantification is displayed. The results are expressed as mean±s.d. (n=5, from five different mothers). The results are expressed as the mean±s.d.; data were analyzed using one-way ANOVA with post-hoc comparisons by Bonferroni’s contrast test; the level of significance was set at P⩽0.05. *** P<0.0001. NPN, normal protein-intake offspring fed standard rodent; NPH, normal protein-intake offspring fed high-fat diet; LPN, maternal protein-restricted offspring fed standard rodent; LPH, maternal protein-restricted offspring fed standard rodent.

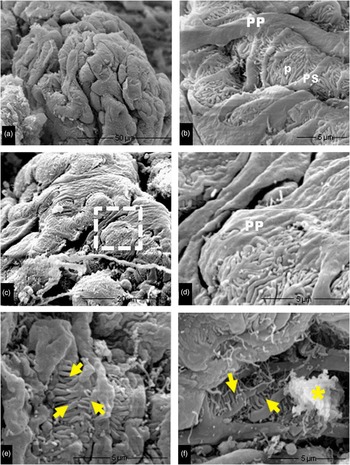
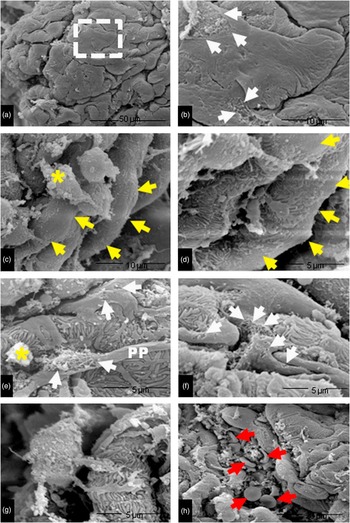
The study by SEM shows pronounced and widespread simplification of glomerular visceral epithelium accompanied by the loss of integrity of the glomerular filtration slits, detachment of pedicels from the glomerular basement membrane (GMB) and, glomeruli accumulation of protein and vesicular clusters in the offspring NPH when compared with the NPN group (Fig. 5). The study also presents a striking effacement of the foot process in the LPN group and the wearing of the podocytes by rupture of cell membranes (Fig. 6a and 6b), changes much more pronounced in LPH offspring. The current study also demonstrates extends ‘bare’ areas in GBM indicating loss of podocytes (Fig. 6c and 6d) and, the most podocytes showed large areas of flattening disruption of the plasma membrane (Fig. 6e–6g). We also verified the disruption of glomerular capillaries with erythrocytes passing through the filtration membrane to Bowman space (Fig. 6h).
Photomicrographs of glomeruli from NPN (a) and (b) and NPH (c–f). The normal ultrastructure of the glomerular capillaries covered by the visceral epithelium of Bowman’s capsule is shown in (a). In (b), a detail is shown displaying the primary extensions (PP), secondary extensions (PS) and pedicels (p) of podocytes. Note the integrity of the filtration slits formed by the interdigitation of pedicels. In (c), there is an overview and in (d) a detail is shown where the flattening of podocytes is evident. In (e) and (f), there is a loss in the integrity of the glomerular filtration slits from the loss of adhesion of the pedicels (yellow arrows) and accumulation of proteinaceous and vesicular materials (yellow asterisks). NPN, normal protein-intake offspring fed standard rodent; NPH, normal protein-intake offspring fed high-fat diet.

Photomicrographs of glomeruli from LPN (a and b) and LPH (c–h). In (a), there is a flattening and simplification of podocytes. In region (b), a dotted square demarcated in (a) is shown at higher magnification. Note the areas bounded by arrows where disruption of the podocyte membrane occurred. In (c), glomerular capillaries have lost podocytes (white arrows) and in (d) there is a detail of this region. In (e), we show a primary process (PP) with a ruptured membrane showing cytoskeletal elements and the accumulation of proteinaceous materials (yellow asterisks). We also found a ruptured membrane [black arrows in (e) and (f)] and a podocyte without its plasmatic membrane (g). In (h), we can observe the image of a glomerular capillary showing ruptured capillary, erythrocytes (red arrows) and other constituents. LPN, maternal protein-restricted offspring fed standard rodent; LPH, maternal protein-restricted offspring fed standard rodent.

Glomeruli ultrastructure
The SEM results showed pronounced and widespread simplification of glomerular visceral epithelium accompanied by a loss of integrity of the glomerular filtration slits, detachment of pedicels from the GMB and glomerular accumulation of protein and vesicular clusters in the NPH offspring when compared with the NPN group (Fig. 5). We also observed a striking effacement of the foot process in the LPN group and the wearing of the podocytes by rupture of the cell membranes (Fig. 6a and 6b), with these changes much more pronounced in LPH offspring. Furthermore, there were extended ‘bare’ areas in the GBM indicating the loss of podocytes (Fig. 6c and 6d), and most podocytes showed large areas where there was a flattening disruption of the plasma membrane (Fig. 6e–6g). We also verified the disruption of the glomerular capillaries, with erythrocytes passing through the filtration membrane to the Bowman space (Fig. 6h).
Discussion
In animal experiments and in humans, low birthweight is often associated with a high prevalence of cardiovascular and metabolic disorders and kidney dysfunction in adulthood.Reference Luyckx and Brenner 19 Moreover, studies by Lin et al. and others have demonstrated that a HFD and high body mass index are directly associated with increased proteinuria in middle-aged humans.Reference Kanasaki, Kitada, Kanasaki and Koya 20 – Reference Lin, Judd and Le 23
Studies have demonstrated that a reduction in nephron number, and therefore, the whole kidney glomerular filtration area, in maternal low protein-intake offspring results in decreased urinary sodium excretion and reduced renal reserve and, at least in part, may explain the higher prevalence of hypertension and renal disease in low birthweight offspring.Reference Mesquita, Gontijo and Boer 5 , Reference Mesquita, Gontijo and Boer 6 In the current study, we find that, at least in part, renal fibrotic proteins and TGF-β1 expression are associated with later adult renal function disorder as an outcome, suggesting that the kidney is an organ in which prolonged fat diet intake underlies the early loss of organ function and occurrence of chronic kidney disease. In the present study, the 6-week HFD-treated NP and LP offspring showed increased cholesterol and triglyceride plasma levels, which were associated with a significant increase in the adiposity index when compared with age-matched control rats. This study also confirms a significant increase in arterial pressure induced by gestational protein restriction, which was accentuated by HFD ingestion.
Podocyte cells are incapable of regenerative postnatal replication; therefore, the loss of podocytes may lead to ‘bare’ areas in the glomerular basal membrane, which represents potential starting points for irreversible glomerular injury.Reference Nolan, O’Meara and Godson 22 , Reference Fan, Xing, Ding, Guan and Zhang 24 , Reference Villar-Martini, Carvalho, Neves, Aguila and Mandarim-de-Lacerda 25 Consistent with these findings, it has been reported that a relative reduction in the coating area of glomerular podocytes on the glomerular surface is in fact found in obesity-related glomerulopathy patients.Reference Kanasaki, Kitada, Kanasaki and Koya 20 – Reference Nolan, O’Meara and Godson 22 In the present study, LP offspring maintained on a standard diet presented effacement of podocytes and extensive loss of the normal structure of the filtration diaphragm. These morphological glomerular abnormalities were notably accentuated in LP offspring after 6 weeks of HFD intake. Here, we also found that striking glomerular structural alterations were accompanied by proteinuria in the 6-week HFD-treated LP and NP offspring, denoting a decreased efficiency of the glomerular filter barrier compared with age-matched normal diet-fed rats.
In 1974, Weisinger et al. Reference Weisinger, Kempson, Eldridge and Swenson 26 described the first association seen between massive obesity and nephrotic syndrome in four patients. The development of glomerular hypertrophy and focal segmental glomerulosclerosis has been generally associated with high fat intake and massive obesity and has been recognized as obesity-related glomerulopathy.Reference Nolan, O’Meara and Godson 22 The current study verified the increased glomerular expression of TGF-β1, fibronectin and collagen, intrinsically related to the fibrotic process and strongly associated with HFD intake. Furthermore, the histochemical analysis in the present study demonstrated that increased kidney TGF-β1 immunostaining in HFD-treated NP, and to a greater extent in LP offspring, compared with that observed in the NP-treated group, was closely associated with the renal expression of the type I AngII receptor. AngII plays a key role in the progression of chronic kidney damage, contributing to renal fibrosis. Many in vitro and experimental studies have demonstrated that AngII activates renal cells to produce profibrotic factors and extracellular matrix proteins.Reference Vehaskari, Stewart, Lafont, Soyez, Seth and Manning 27 , Reference Alexander, Brock, Gimbrone and Rittenhouse 28 The interrelation between AngII and TGF-β is well established; AngII and TGF-β share many profibrotic mediators and intracellular signaling systems.Reference Navar and Nishiyama 29 , Reference Sharma, Sharma, Greene, McCarthy and Savin 30 Therefore, in this study, a demonstrated increased expression of type 1 AngII receptors in the kidney could be the driving force that initiates the profibrotic process by enhanced TGF-β1 renal expression in HFD-treated offspring compared with control rats. Moreover, recently, using the gestational protein-restricted model, we have shown that the glomerular miR200 family can be upregulated early by the action of TGF-β1 inducing type I collagen expression that may subsequently cause a glomeruli epithelial-to-mesenchymal transition (EMT) by decreasing these miRNAs at later time points.Reference Sene L de, Mesquita and de Moraes 7
The current study confirms recent findings Reference Sene L de, Mesquita and de Moraes 7 , Reference Pinhal, Lopes and Torres 12 in gestational low-protein and hyper-fat diet models, indicating that glomerular cells, particularly podocytes, undergo phenotypic conversion characterized by accentuated loss of podocyte-specific structures and gain of transitional features, particularly in HFD-treated offspring, suggesting a process reminiscent of EMT.Reference Li, Kang and Dai 31 Using a culture of immortalized mouse podocytes, Li et al.Reference Li, Kang and Dai 31 showed that after TGF-β1 stimulation, there was a loss of epithelial markers, such as Zonula occludens (ZO)-1, and acquisition of mesenchymal markers, such as desmin, collagen I and fibronectin.
The present study confirm previous data showing that LP male pup body weight was significantly reduced when compared to that of NP pups. However, the body masses at 14-week-old were similar to observed in NP age-matched group. We therefore postulate that the fetal environment strongly influences the number of nephrons in an individual. In addition, the number of nephrons is correlated with birthweight,Reference Luyckx and Brenner 19 , Reference Villar-Martini, Carvalho, Neves, Aguila and Mandarim-de-Lacerda 25 and a low birthweight has been postulated to be a risk factor for hypertension, cardiovascular disease and the progression of renal disease in later life.Reference Lackland, Egan, Syddall and Barker 32 , Reference Hsu, Lin, Vittinghoff and Shlipak 33 Thus, based on clinical and experimental evidence, we hypothesize that an absolute reduction in the number of nephrons that occurs in programmed LP offspring Reference Mesquita, Gontijo and Boer 5 , Reference Mesquita, Gontijo and Boer 6 sensitizes to renal injury induced by HFD intake and/or obesity. Studying the model of low-protein diet during pregnancy, our findings corroborate Brenner’s hypothesis that hyperfiltration in low birthweight rats lead to glomerular hypertension and, in future life, to renal disease.Reference Mesquita, Gontijo and Boer 5 , Reference Mesquita, Gontijo and Boer 6 , Reference Pinhal, Lopes and Torres 12 Herein, as previously demonstrated in LP programmed studies, even with a decreased nephron number, growth-restricted rats have a normal GFR in the whole kidney, estimated by creatinine clearance. This finding suggests compensatory glomerular hyperfiltration despite a loss of efficiency of the filter barrier.Reference Mesquita, Gontijo and Boer 5 , Reference De Almeida, Monte-Alegre, Zanini, Souza, Etchebehere and Gontijo 17 , Reference Kim, Kim, Hong and Lee 34 In rats, HFD intake causes kidney dysfunction preceded by endothelial dysfunction and arterial hypertension, both induced by increasing oxidative stress, a powerful inflammatory response and disruption of the renal filtration barrier.Reference De Almeida, Monte-Alegre, Zanini, Souza, Etchebehere and Gontijo 17 Our investigation also demonstrated a pronounced decrease in fractional urinary sodium excretion in both NP and LP HFD-treated offspring. The decreased FENa+ was accompanied by a fall in FEPNa + and occurred despite an unchanged CCr and certainly on the sodium filtered load. Enhanced tubule sodium reabsorption was accompanied by the elevation of urinary H+ excretion (decreased urine pH), allowing us to hypothesize that a proximal Na/H exchanger participates in this mechanism.
Although the precise mechanism by which renal sodium excretion decline in HFD-treated offspring remains to be elucidated, the loss of organ function, sympathetic neural and renin–angiotensin activity and abnormal renal control of the fluid and electrolyte balance is thought to play a dominant role in long-term sodium and water retention. Factors such as leptin Reference Balmforth, Shepherd, Warburton and Ball 35 and oxidative stress Reference Moellenhoff, Blume, Culman, Chatterjee, Herdegen, Lebrun and Unger 36 , Reference Palmer and Frindt 37 may contribute to the sympathetic drive in HFD-intake animals. Our results demonstrated by immunostaining the upregulated expression of AT1R in programmed HFD-treated rats; thus, increased renal angiotensin activity may induce reactive oxygen species production by nicotinamide adenine dinucleotide 2′-phosphate (NAD) (P) H oxidases.Reference Wehling 38 We suggest that direct intrarenal actions of AngII contribute to increased tubular reabsorption, including constriction of efferent glomerular arterioles, which alter peritubular capillary dynamics and renal medullary blood flow and have direct actions on tubular epithelial cell transport. Furthermore, the increased AT1R expression found in the current study may have a close relationship with glomerular hyperfiltration/hypertension because progressive deterioration in renal disease is attenuated by treatment with angiotensin-converting enzyme inhibitors.Reference Tsuboi, Utsunomiya and Hosoya 39
We cannot rule out that a possible indirect physical mechanism could underlie the decrease in renal sodium excretion. In the present study, we propose that haemodynamic glomerular changes causing a decreased peritubular blood flow are responsible for the enhanced sodium reabsorption in the proximal segments of the nephron in diet-programmed rats. The FENa+ responses observed in the present study may result from the interactions of a variety of mechanisms, such as angiotensin-induced renal arteriolar post-glomerular vasoconstriction, overexcitability of the sympathetic nervous system and direct tubule effects in HFD-treated offspring and consequently, association with arterial hypertension.
In conclusion, to the best of our knowledge, these are the first data showing a speedy, progressive and extensive deterioration of renal function in LP maternal programmed animals, induced by 6-week HFD treatment, in particular associated with a striking structural disorder characterized by enhanced glomerular expression of proteins intrinsically related to the fibrotic process. These results suggest that nephron disorders that occur in programmed offspring may sensitize to renal injury in HFD-intake offspring. Furthermore, this study suggests that the pronounced podocyte abnormalities observed are induced by glomerular overload/hyperfiltration, which is accompanied by the activation of TGF-β1 expression, resulting in increased fibronectin and collagen expression. In addition, we hypothesize that presumable podocyte injury in parallel with the observed proteinuria is worsened by long-term HFD intake and is associated with renal sodium and water retention and arterial hypertension. In conclusion, long-term HFD intake of low-protein programmed offspring enhances the susceptibility for adult renal disease and increased renal collagen expression and, subsequently, may cause renal failure at later time points in rats.
Acknowledgments
Grants from CNPq, CAPES and FAPESP (2013/12486-5) supported this work.
Financial Support
The financial grants from CNPq, CAPES and FAPESP (2013/12486-5) supported this work.
Conflicts of Interest
None.
Ethical Standards
The experimental protocol was approved by the Institutional Ethics Committee (CEUA/UNESP #408).