Implications
The application of once-daily milking (ODM) in ruminants is a management practice that saves time and labour. However, this practice is associated with a negative impact on milk yield that limits its large-scale adoption. The understanding of the regulatory mechanisms involved in the negative impact on milk yield during ODM may give indications to minimise them.
Introduction
Once-daily milking (ODM) is a management practice adopted by some goat producers in order to simplify their dairying activities. However, adoption of this practice is hindered by the loss of milk yield that occurs when a farmer switches from twice-daily milking (TDM) to ODM. The loss of milk yield varies from 15% to 30% in small ruminants (Nudda et al., Reference Nudda, Bencini, Mijatovic and Pullina2002; Marnet and Komara, Reference Marnet and Komara2008). Milk yield declines when the number of mammary epithelial cells (MECs) and/or their synthetic activity decreases (Stelwagen, Reference Stelwagen2001; Capuco et al., Reference Capuco, Ellis, Hale, Long, Erdman, Zhao and Paape2003). However, very few studies have investigated the effects of ODM on the cellular regulation pathways related to the observed loss of milk yield.
The regulation of lactose synthesis may be involved in the effects of ODM on milk yield. Indeed, lactose plays an important role in determining the milk volume secreted by the mammary gland because of its osmotic properties. Lactose synthesis may be modulated by the availability of glucose, its precursor and/or via regulation of the enzymes involved in its synthesis. Glucose transport in MEC is mainly ensured by the type 1 glucose transporter (GLUT1), which is the predominant glucose transporter in the mammary gland (Zhao and Keating, Reference Zhao and Keating2007). Several enzymes are involved in lactose synthesis, including galactosyltransferase (GT). This enzyme, associated with its co-factor α-lactalbumin (α-LA) to form lactose synthase, catalyses the final lactose synthesis reaction. For this reason, lactose synthesis should also be modulated by transcriptional regulation of these proteins.
After peak lactation, it is the loss of secretory cells, which accounts for the decrease in milk yield throughout declining lactation (Knight and Wilde, Reference Knight and Wilde1993). This decrease in cell numbers has been attributed to an increase in mammary apoptosis (Knight and Wilde, Reference Knight and Wilde1993). Similarly, the loss of milk yield during ODM may also be due to a decrease in the number of mammary cells. Indeed, ODM is known to induce apoptosis in the goat mammary gland (Li et al., Reference Li, Rudland, Fernig, Finch and Wilde1999). The apoptotic state of a tissue can be evaluated by quantifying certain proteins involved in this death process. Previous studies carried out in mammary tissue or MEC used mRNA quantification of the pro-apoptotic proteins caspase-3 and Bax, together with the anti-apoptotic protein Bcl-2, as indicators of cell death (Wareski et al., Reference Wareski, Motyl, Ryniewicz, Orzechowski, Gajkowska, Wojewodzka and Ploszaj2001; Sorensen et al., Reference Sorensen, Norgaard, Theil, Vestergaard and Sejrsen2006; Boutinaud et al., Reference Boutinaud, Ben Chedly, Delamaire and Guinard-Flament2008).
Studying cellular regulation entails the collection of MEC. Sampling of the tissues after slaughter or by using a biopsy needle are ways of collecting MEC, but these techniques are invasive. The collection of MEC from milk is a non-invasive alternative, which was previously used to study mammary gene expression in cows (Hayashi et al., Reference Hayashi, McCoard, Roy, Barnett, Mackenzie and Mcnabb2004; Murrieta et al., Reference Murrieta, Hess, Scholljegerdes, Engle, Hossner, Moss and Rule2006) and in goats (Boutinaud et al., Reference Boutinaud, Rulquin, Keisler, Djiane and Jammes2002). An improvement in the method was developed in cows, consisting of the specific purification of MEC from somatic milk cells using magnetic beads (Boutinaud et al., Reference Boutinaud, Ben Chedly, Delamaire and Guinard-Flament2008). The use of milk MEC enables repeated sampling without carryover effects.
In this study, we used a non-invasive method for MEC recovery to analyse the transcriptional regulation of synthetic activity and apoptosis indicators occurring in the epithelium during ODM in an effort to explain goat mammary adaptation to ODM.
Material and methods
Animals and experimental design
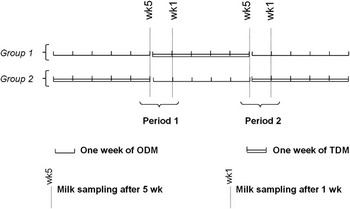
Eight multiparous Alpine goats in mid-lactation producing 3.0 ± 0.7 kg/day of milk were assigned to two groups of four goats each. In the first group, goats were subjected to ODM for 5 weeks and switched to TDM for a further 5 weeks before returning to ODM for 5 weeks (Figure 1). The other group was subjected to the opposite order of milking frequency for the same periods of time, as shown in Figure 1. The two groups of goats were fed according to INRA’s recommendations (INRA, 2007) in order to meet their TDM milk production needs. The goats thus received 800 g alfalfa, 1 kg energy concentrate and ad libitum hay and water, each day. The diet and the milking routines and equipment were previously described by Komara et al. (Reference Komara, Boutinaud, Ben Chedly, Guinard-Flament and Marnet2009). The goats in the TDM were milked at 0645 h and 1645 h, whereas those in ODM were milked at 1645 h.
Experimental design: in group 1 (n = 4) goats were subjected to ODM for 5 weeks, then switched to TDM for further 5 weeks, returning thereafter to ODM for 5 weeks. Group 2 (n = 4) was subjected to the opposite order of milking frequency, for the same durations. Milk samples for MEC purification were collected at morning milking after 1 and 5 weeks of each milking frequency. Periods 1 and 2 were the periods used for the statistical model (ODM = once-daily milking; TDM = twice-daily milking; MEC = mammary epithelial cell).

Milk samples
Milk production was recorded with a Waikato milk meter mk5 (Waikato, Hamilton, New Zealand) at each milking (5 days/week). Twice a week (Tuesday and Thursday), the fat and protein content and somatic cell count (SCC) in representative samples collected at morning and afternoon milkings were determined by a commercial laboratory using infra-red analysis (Lillab, Châteaugiron, France). Morning and afternoon samples were analysed separately and a proportional average was calculated. Milk lactose was analysed weekly using a colorimetric enzymatic reaction (kit for lactose/D-galactose, Roche, Meylan, France) and a multiparameter analyser (Kone Instrument Corporation, Espoo, Finland). Milk samples were analysed four times, as shown in Figure 1: after 1 and 5 weeks of each milking frequency (TDM or ODM) with regard to their total N, true protein N (precipitation at pH 4.6 with trichloroacetic acid and filtration) and casein (precipitation at pH 4.6 with 10% acetic acid and 1 M sodium acetate) content (Kjeldahl method, temporary norm FIL 20B).
Purification of MECs
Milk samples were collected at the morning milking after 1 and 5 weeks of each period (Figure 1) for MEC purification as described by Boutinaud et al. (Reference Boutinaud, Ben Chedly, Delamaire and Guinard-Flament2008). Briefly, 1.4 kg of fresh milk was centrifuged at 1500 g for 15 min at 4°C. The fat layer and the skimmed milk were discarded and the cell pellet was retained. The cell pellet was suspended in phosphate-buffered saline (PBS). After two washes in PBS, the cell pellet was re-suspended in 1 ml of PBS containing 1% bovine serum albumin (BSA). Twenty microlitres of this cell suspension were counted with a haematocytometer (VWR International, Fontenay sous Bois, France) using light microscopy to determine the total milk cell count. A 200-μl volume of magnetic beads (Pan Mouse IgG, Dynal Biotech, Invitrogen, Cergy Pontoise, France) was incubated with 4 μl of anti-cytokeratin-8 antibody (clone K8.13, Sigma-Aldrich Chimie, Lyon, France) in 1 ml of 1% PBS–BSA for immunocytochemical binding of MEC. Each cell sample was incubated with 25 μl of the bead/antibody mix described above. After 1 h of incubation, the samples were placed in a magnetic particle concentrator (MPC-S; Dynal Biotech, Invitrogen, Cergy Pontoise, France) and the supernatant containing non-selected cells was removed. The purified MECs were re-suspended in 1 ml of 1% PBS–BSA. A 20-μl aliquot of purified cell suspension was collected for haematocytometer cell count of purified MEC. The MECs were pelleted by centrifugation (5 min, 4°C, 5000 g) and 1 ml of Trizol (Invitrogen) was added. The cell samples were mixed and stored at −80°C until RNA extraction.
RNA extraction
The extraction of total RNA from MEC was done in Trizol, according to the manufacturer’s recommendations. The RNA pellet was suspended in RNase-free water and the total quantity of RNA was determined with an Agilent 2100 bioanalyzer (Agilent Technologies, Massy, France). RNA quality was assessed using the RNA integrity number generated by version B.02 of Agilent 2100 Expert Software (Agilent Technologies).
Real-time reverse transcriptase-PCR (RT-PCR)
Complementary DNA was obtained using the First Strand cDNA kit (Roche Diagnostics, Meylan, France), according to the manufacturer’s instructions, with 250 ng of total RNA. PCR amplifications of cDNA samples were carried out using the primers already described for cyclophilin, α-LA, κ-CN (κ-casein), GT, GLUT1, Bax and cytokeratin-8 (Boutinaud et al., Reference Boutinaud, Ben Chedly, Delamaire and Guinard-Flament2008) and for Bcl-2, r18S, caspase-3, β-actin and RPLP0 (Ben Chedly et al., Reference Ben Chedly, Lacasse, Marnet, Wiart-Letort, Finot and Boutinaud2009).
Real-time PCR was performed using SYBR Green PCR Master Mix (Applied Biosystems, Foster City, CA, USA), according to the manufacturer’s instructions. Briefly, 12.5 ng cDNA were mixed with 6 pmol of all forward and reverse primers and adjusted to 12.5 μl with SYBR Green PCR Master Mix (2×) and DNase-free water. The PCR amplification protocol consisted of 2 min of incubation at 50°C followed by 10 min at 95°C and 40 cycles of 15 s at 95°C and 60 s at 60°C. Finally, a dissociation protocol was carried out, involving a linear increase of 1°C/min from 60°C to 95°C with continuous fluorescence acquisition. The PCR reactions on each sample were performed in triplicate.
Quantification of mRNA
The number of amplified mRNA molecules was determined as described by Boutinaud et al. (Reference Boutinaud, Shand, Park, Phillips, Beattie, Flint and Allan2004) according to the following formula:

where, Nb Mol is the approximate number of mRNA molecules; Ct is the average cycle threshold for PCR in triplicate for a considered gene; and S is the slope of the calibration curve performed using serial cDNA dilutions of the same sample.
The calibration curves were generated for each target and housekeeping gene using serial dilutions of a mammary tissue cDNA sample (1 : 10, 1 : 20, 1 : 50, 1 : 100, 1 : 200, 1 : 1000 and 1 : 2000). A non-template negative control was incorporated in all PCR runs.
mRNA levels of the studied genes were expressed relative to a reference gene. The cyclophilin, β-actin, r18S and glyceraldehyde-3-phosphate dehydrogenase genes were evaluated as potential reference genes. The BestKeeper (Pfaffl et al., Reference Pfaffl, Tichopad, Prgomet and Neuvians2004), GeNorm (Vandesompele et al., Reference Vandesompele, De, Pattyn, Poppe, Van, De and Speleman2002) and NormFinder (Andersen et al., Reference Andersen, Jensen and Orntoft2004) programs were used to assess the variability of candidate reference genes. Cyclophilin was the gene with the most stable expression and was thus used as the reference gene during this study. The results for each target gene are expressed as a ratio using the selected reference gene.
Statistical analyses
Milk data, cell data and gene expression data were analysed by ANOVA using the SAS MIXED procedure (SAS Institute, 1999) with the REPEATED statements. The weeks were used as a repeated effect and the goats as the subject. The effect of milking frequencies (ODM and TDM), weeks (weeks 1 and 5), periods (periods 1 and 2), the goats and the interaction between milking frequencies and weeks were tested. Cell data were log10-transformed before analysis. Statistical analysis of real-time PCR data was carried out on the semi-absolute mRNA molecule number of the target gene/reference gene ratio multiplied by 104 and log10-transformed. The effects were considered significant at P < 0.05.
Results
Milk production and composition
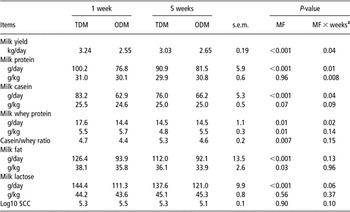
Overall, ODM induced a decrease in milk yield compared to TDM (P < 0.001). As shown in Table 1, the effect of ODM declined with time (milking frequency × week, P = 0.04). The milk loss averaged 21% after 1 week of ODM and was reduced to 13% after 5 weeks.
Effect of MF after 1 and 5 weeks on milk yield and composition in dairy goatsFootnote †

MF = milking frequency; TDM = twice-daily milking; ODM = once-daily milking; MF × weeks = interaction between MF and weeks of treatment; SCC = somatic cell count.
† MF = ODM or TDM.
‡ n = 8.
Milking frequency did not affect the lactose content of milk. Therefore, lactose yield followed the same pattern as milk yield, with a reduction during ODM compared to TDM (P < 0.001) and a trend towards an interaction between milking frequency and weeks (P = 0.06). The loss of lactose averaged 23% after 1 week and 12% after 5 weeks.
As for lactose, the protein yield was lower during ODM than during TDM (P < 0.001), and an interaction between milking frequency and weeks was found (P = 0.01). Milk protein loss averaged 23% after 1 week and 10% after 5 weeks. There was no effect of milking frequency on protein content, but there was a trend towards a lower milk casein content (P = 0.07) during ODM than during TDM. Conversely, the milk whey protein content was greater during ODM than during TDM (P = 0.01), leading to a lower casein/whey protein ratio (P < 0.01). Nevertheless, the yields of casein and whey proteins were lower during ODM than during TDM (P ⩽ 0.01), which fell, respectively, by 24% and 18% after 1 week and 13.0% and 0.3% after 5 weeks.
ODM decreased the milk fat content (P = 0.03) and yield (P < 0.001) compared to TDM. The reduction in milk fat yield averaged 26% after 1 week and 18% after 5 weeks. There was no interaction between milking frequency and week with regard to milk fat yield (P = 0.13) or content (P = 0.96), indicating that these parameters were not affected by the duration of ODM. Milking frequency did not affect the SCC.
Purification of milk MEC and gene quantification
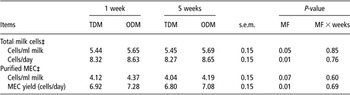
On average, 570 ± 112 × 103 cells/ml of total milk cells were recovered. The number of purified MEC averaged 23 ± 4 × 10³ cells/ml of milk, which led to 16.5 ± 2.7 × 10⁶ purified MEC recovered per sample. The milk MEC thus recovered represented an average of 4.6 ± 0.6% of total milk cells. As shown in Table 2, we observed a greater total milk cell yield and content per day (P = 0.01) associated with a greater yield of purified milk MEC per day (P = 0.01) in ODM than in TDM milk samples. Total RNA recovered from purified milk MEC averaged 31.8 ± 4.6 μg. Five samples were not analysed owing to the poor quality of their RNA (RNA integrity number <5).
Effect of MF on milk cells and purified MEC recovered after 1 and 5 weeks in dairy goatsFootnote †

MF = milking frequency; MEC = mammary epithelium cell; TDM = twice-daily milking; ODM = once-daily milking; MF × weeks = interaction between MF and weeks of treatment.
† MF = ODM or TDM.
‡ Log10-transformed data (n = 8).
mRNA levels of proteins involved in lactose and milk protein synthesis
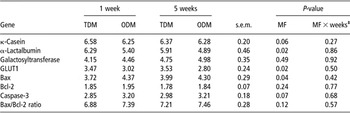
ODM tended to reduce mRNA levels of κ-CN (Table 3). ODM downregulated the mRNA levels of α-LA and of the glucose transporter GLUT1 (P = 0.02) compared to TDM. No effect of milking frequency was observed with regard to GT mRNA levels. No interaction was observed between milking frequency and weeks in terms of the mRNA levels of the different genes studied.
Effect of MF on log10-transformed mRNA levels in milk-purified MECs recovered after 1 and 5 weeksFootnote †

MF = milking frequency; MECs = mammary epithelium cells; TDM = twice-daily milking; ODM = once-daily milking; MF × weeks = interaction between MF and weeks of treatment; GLUT1 = type 1 glucose transporter.
† MF = ODM or TDM.
‡ n = 8.
mRNA levels of apoptosis-related proteins
Bax mRNA levels were higher during ODM than during TDM (P < 0.05; Table 3). A tendency was also observed towards higher caspase-3 mRNA levels during ODM than TDM (P = 0.07). Milking frequency had no effect on Bcl-2 (P = 0.24) mRNA levels or the Bax/Bcl-2 ratio (P = 0.12). No interaction was observed between milking frequency and weeks relative to the mRNA levels of apoptosis-related proteins.
Discussion
In this study, we used a non-invasive method, purification of MEC from milk, to evaluate transcriptional regulation of some proteins involved in the synthesis of milk constituents and in apoptosis. Other methods are available for MEC recovery such as mammary sampling after slaughter or mammary biopsies. These techniques are invasive and are not adapted for timeline studies. A new non-invasive method using purified milk MEC developed by Boutinaud et al. (Reference Boutinaud, Ben Chedly, Delamaire and Guinard-Flament2008) was adapted to goats and consisted in the use of milk-purified MEC. The purification of MEC from goat milk permitted the recovery of a sufficient quantity of MEC for extracting total RNA and for carrying out RT-PCR analyses. A higher percentage of goat MEC (4%) was purified from the total milk somatic cell population compared to 2% in cows (Boutinaud et al., Reference Boutinaud, Ben Chedly, Delamaire and Guinard-Flament2008). Epithelial cells represent a higher proportion of milk somatic cells in goats than in cows (Boutinaud and Jammes, Reference Boutinaud and Jammes2002). The use of milk cells presents several advantages compared to biopsies. This method enables repeated sampling without carryover effects. Thus, in this study, we were able to test the effect of weeks (weeks 1 and 5) during ODM in an inverted experimental design. Biopsies will be questioned in the future from an ethical point of view and alternative solutions should be envisaged. Milk cells are the most promising. This study is the first report that presents the purification of MEC from goat milk. This method provides the possibility to quantify gene expression, specifically in MEC. The tissue sampling methods, such as biopsy, permit the recovery of not only MEC but also other cells such as immune cells, myoepithelial cells and adipocytes. The heterogenicity in cell type can interfere with the result of gene expression, especially for a ubiquitously expressed gene such as housekeeping genes. The use of milk MEC raises a certain number of questions. It has been suggested that milk cells are dying cells and may already be committed to apoptosis. However, <10% of total milk cells exhibited DNA fragmentation, which usually characterises apoptosis in goat milk (Boutinaud and Jammes, Reference Boutinaud and Jammes2002). We make the assumption that epithelial cells can be detached from mammary epithelium at milking due to the effect of pressure and contractions of mammary myoepithelial cells. It has been reported that milk somatic cells are viable (Feng et al., Reference Feng, Salter, Parr and Garnsworthy2007) and that more than 90% of MEC are viable (Thompson et al., Reference Thompson, Kadlubar, Vena, Hill, McClure, McDaniel and Ambrosone1998). In addition, previous studies have shown that milk cell transcripts well represent the mammary tissue in bovine (Hayashi et al., Reference Hayashi, McCoard, Roy, Barnett, Mackenzie and Mcnabb2004; Murrieta et al., Reference Murrieta, Hess, Scholljegerdes, Engle, Hossner, Moss and Rule2006) and in caprine species (Boutinaud et al., Reference Boutinaud, Rulquin, Keisler, Djiane and Jammes2002). Moreover, in a recent experiment, we compared the use of milk MEC and biopsy during ODM and we found the same downregulation of genes involved in milk synthesis using both methods (Boutinaud et al., Reference Boutinaud, Galio and Devinoy2009). Therefore, we suppose that the transcription profile of the milk-isolated MEC is representative of that of the MEC in the tissue.
The decline in the milk yield of goats associated with ODM compared to TDM ranges from 6% to 40% (Wilde and Knight, Reference Wilde and Knight1990; Salama et al., Reference Salama, Such, Caja, Rovai, Casals, Albanell, Marin and Marti2003). Factors such as the duration of ODM application, the period of measurement, the stage of lactation and the breed of animals are probably responsible for much of this variability. Milk yield was reduced by ODM during this study, but the effect was less pronounced after 5 weeks of ODM (−12%) than after 1 week of the treatment (−22%). This observation was in line with the findings of Salama et al. (Reference Salama, Such, Caja, Rovai, Casals, Albanell, Marin and Marti2003), who reported a greater loss of milk yield (19%) during the first 3 months of ODM than at the end of lactation (14%). During that study, the difference in the rate of milk yield declined during ODM was attributed to either the stage of lactation or the duration of ODM, as they were confounded. During this study, the experimental design enabled a distinction between these effects and the results, thus confirming that the duration of ODM exerted an effect on loss of milk yield. Conversely, the duration of ODM does not alter the effect on milk yield and composition in dairy cows (Pomies et al., Reference Pomies, Remond and Pradel2004). This suggests that in contrast with cows, the goat mammary gland could progressively adapt to ODM, thus gradually reducing the negative impacts of this management practice.
The decrease in milk lactose yield observed under ODM can be attributed to a reduction in lactose synthesis by MEC and a loss of lactose in the bloodstream due to the openings of tight junctions (Stelwagen et al., Reference Stelwagen, Farr, McFadden, Prosser and Davis1997). No indicators of tight junction openings were measured during this study. During a recent experiment, goats were milked at several successive 36-h milking intervals (Ben Chedly et al., 2009). This extended milking interval only induced tight junction openings at the first occurrence; but this effect had already disappeared at the second one. Thus, the loss of lactose due to tight junction openings is not very likely. Conversely, previous studies have shown that ODM decreased the activity of some key enzymes involved in lactose synthesis, such as GT (Wilde and Knight, Reference Wilde and Knight1990; Farr et al., Reference Farr, Stelwagen, Kerr, Davis and Eichler1995). The results of this study did not reveal an effect of ODM on GT transcripts, but rather a decrease in the levels of α-LA mRNA, the co-factor of GT during lactose synthase. These results agree with our previous observations in cows (Boutinaud et al., Reference Boutinaud, Ben Chedly, Delamaire and Guinard-Flament2008) but differs from that of Bryson et al. (Reference Bryson, Wilde and Addey1993). However, in the latter experiment, goats were unilaterally subjected to ODM (no reduction in the systemic hormonal effect of milking stimulation), and Northern blotting (which is less sensitive than real-time RT-PCR) was used for mRNA quantification. ODM was also found to decrease GLUT1 transcripts during that experiment. Our results agree with the inhibitory effect of milk accumulation on GLUT1 protein and mRNA levels reported in rats (Camps et al., Reference Camps, Vilaro, Testar, Palacin and Zorzano1994). The ODM-induced downregulation of the GLUT1 observed could lead to a reduction in glucose availability for lactose synthesis, as previously observed by arteriovenous difference in cows (Delamaire and Guinard-Flament, Reference Delamaire and Guinard-Flament2006). Therefore, adaptation of the goat mammary gland to ODM seems to involve the negative regulation of lactose synthesis, due to the regulation of lactose synthase activity by way of transcriptional inhibition of its co-factor α-LA, and/or the reduction of glucose availability by way of a decrease in GLUT1 expression.
ODM reduced protein yield, with caseins being affected to a greater extent than whey proteins. This decrease in protein yield was of the same magnitude as the decline in milk volume, as also reported by Salama et al. (Reference Salama, Such, Caja, Rovai, Casals, Albanell, Marin and Marti2003). As in the case of lactose, we observed an adaptation of the mammary gland to ODM so that the loss of milk casein yield was more pronounced after 1 week than after 5 weeks. The effect of ODM on milk caseins was associated with a trend towards a downregulation of κ-CN transcripts, a phenomenon that has already been reported after 7 days of ODM in cows (Boutinaud et al., Reference Boutinaud, Ben Chedly, Delamaire and Guinard-Flament2008).
Milk whey protein secretions were also reduced by ODM, but to a lesser extent than milk volume, leading to an increase in the whey protein content. The disruption of tight junctions during ODM may permit the passage of plasma proteins, such as serum albumin into milk, thus increasing the milk whey protein content. As mentioned previously, leakage through tight junctions is an unlikely possibility, as this is a transient phenomenon in the goat mammary gland. Conversely, a relative reduction in milk whey protein synthesis by MEC may be the consequence of the decrease in α-LA transcripts.
Milking frequency affected both milk fat yield and content. A reduction in milk fat content under ODM was observed despite a decrease in milk volume. This indicates that ODM downregulates milk fat synthesis more than milk volume. Our results agree with those of Marnet and Komara (Reference Marnet and Komara2008), but differ from those of Salama et al. (Reference Salama, Such, Caja, Rovai, Casals, Albanell, Marin and Marti2003), who reported a 10% increase in milk fat content during ODM in goats. The mechanism by which milking frequency affects milk fat synthesis remains unknown, but recent study in unilaterally ODM cows has shown a reduction in the gene expression of enzymes involved in milk fat synthesis (Boutinaud et al., Reference Boutinaud, Galio and Devinoy2009). This suggests that the decrease in milk fat content can be attributed to transcriptional regulation.
The milk SCC was not significantly affected by ODM. This was consistent with the findings of Salama et al. (Reference Salama, Such, Caja, Rovai, Casals, Albanell, Marin and Marti2003) in goats, Castillo et al. (Reference Castillo, Such, Caja, Casals, Albanell and Salama2008) in ewes and Lacy-Hulbert et al. (Reference Lacy-Hulbert, Woolford, Nicholas, Prosser and Stelwagen1999) and Stelwagen et al. (Reference Stelwagen, Davis, Farr, Eichler and Politis1994) in cows. Other studies have reported an increase in the SCC in cows subjected to ODM (Stelwagen and Lacy-Hulbert, Reference Stelwagen and Lacy-Hulbert1996; Kelly et al., Reference Kelly, Reid, Joyce, Meaney and Foley1998). Although the SCC is not a precise indicator of inflammation, our data suggest that ODM does not induce a severe inflammatory reaction in the goat mammary gland, and this is also consistent with the limited permeability of secretory epithelium and limited tight junction disruption that had been observed with 36-h milking intervals (Ben Chedly et al., 2009).
The decrease in milking frequency induced an increase in transcripts of the pro-apoptotic protein Bax. However, milking frequency exerted no effect on the Bax/Bcl-2 ratio, which is one of the measures used to estimate apoptosis. Boutinaud et al. (Reference Boutinaud, Ben Chedly, Delamaire and Guinard-Flament2008) also observed an increase in Bax mRNA levels during ODM, with no significant change to the Bax/Bcl-2 ratio in bovine milk MEC. In addition, ODM reduced the number of epithelial cells in the goat mammary gland (Boutinaud et al., Reference Boutinaud, Rousseau, Keisler and Jammes2003). Li et al. (Reference Li, Rudland, Fernig, Finch and Wilde1999) had previously demonstrated an increase in the apoptosis rate in goat udders milked once daily for 3 weeks. As previously reported, and in addition to the increase in the pro-apoptotic protein transcripts, we observed a tendency towards an increase in purified milk MEC collected from milk. An evaluation of the loss of epithelial cells in milk showed that more MEC were excreted in the milk each day during ODM than during TDM. This suggests a higher rate of epithelial cell exfoliation during ODM. In cows, reduction of milking frequency is associated with an increase of several matrix metalloproteinases in milk (Bernier-Dodier et al., Reference Bernier-Dodier, Delbecchi, Wagner, Talbot and and Lacasse2010). As their name implies, these enzymes can digest the matrix proteins that anchor the cells. If matrix metalloproteinase activity was enhanced in milk during ODM, they may have increased the release of MEC in milk. Further studies need to be carried out in order to access the mechanism by which ODM trigger exfoliation and apoptosis of MEC.
Conclusion
In this study, a non-invasive method was used (purification of milk MEC) to evaluate the transcriptional regulation of proteins involved in the synthesis of milk constituents and in apoptosis. This method enabled a specific recovery of MECs with a repeated sampling preventing any carryover effects. The results obtained showed that ODM induced a decrease in milk, lactose, protein and fat yields. The effect of ODM on milk secretion involved the transcriptional regulation of lactose enzymes and milk protein synthesis acting on α-LA, GLUT1 and κ-CN. ODM treatment also induced an upregulation of pro-apoptotic transcripts in milk MEC, suggesting an induction of apoptosis after 1 and 5 weeks. However, the ODM effect on MEC turnover should be investigated by further studies. The negative effects of ODM were less marked after 5 weeks of ODM, suggesting that the goat mammary gland adapts its secretory activity. Therefore, starting this management strategy in mid-lactation may not induce a long-term negative impact on the mammary gland and thus, might be useful to reduce the workload on a farm.
Acknowledgements
We thank Nicole Huchet and Isabelle Jicquel for their technical assistance. We are also grateful to Jean-Marc Aubry, Michel Chorho and Eric Siroux for taking care of the goats. Our thanks go to Luc Delaby and Steve Méthot for their assistance with the statistical analyses.