

1. Purpose and background
1.1 The recent tendency toward harsher criminal policy in the world and Japan
The purpose of this study is to show how the Japanese government has made laws with harsher punishment since the 1990s through a quantitative analysis of the legislative process.
Some studies point out that Japan started pursuing a severe criminal justice policy after the late 1990s.Footnote 1 Some notable examples that are familiar to researchers of Japanese criminal justice policy include the act enacted in 2004 for extending the maximum length of imprisonment for atrocious and serious crimes; the three acts enacted in 2000, 2007, and 2014 to revise the Juvenile Law to practically make the deal for juvenile delinquents more severe; and the act enacted in 2001 to revise the Criminal Law to treat the offence of causing injury by drunk driving, which was treated as a crime of negligence earlier, as an intentional crime. Consider an example involving a business. If a retired employee used or disclosed business or trade secrets that she/he had obtained during their former employment with the enterprise, then she/he would have faced only civil liability before the revision of the Law against Unfair Competition in 2005. Under the revision, the offender would face criminal punishment, with the maximum length of imprisonment and the fine amount doubled in 2006. Let us take a case that is close to our daily life. The 2009 act to revise the Copyright Law introduced an article under which downloading a pirated file with the knowledge that it is pirated will be considered copyright infringement, while a 2012 revision introduced criminal punishment for such downloads with a maximum of two years’ imprisonment.
The inclination toward harsher punishment is common in Western countries, especially in the US and the UK. There is also a tendency toward harsher punishment in Japan, along with scholarly discussion in sociology and criminology as to whether it can be understood through the “penal-populism” framework.Footnote 2 In the contexts of criminology and sociology, the global inclination toward harsher punishment can be explained by the framework of “penal populism,” which implies an increase in the influence of public opinion over criminal justice policy and a decline in the influence of criminal justice expertise,Footnote 3 which this paper discusses in detail below.
This study examines Japanese legislation with harsher punishment. According to Feeley, Japan seems to have resistance to “penal populism” compared to Western countries, especially the US and the UK, where the political institutions make it easier for criminal justice policy to be influenced by public opinion.Footnote 4 Nevertheless, it is argued that Japan has been tightening its criminal justice system. What prompted this change in approach? Readers may think that the policy change came in response to a deterioration of public security or strong public opinion or both. However, crime statistics indicate that the Japanese public-security conditions have not deteriorated so much as to warrant a comprehensive reform of the criminal justice system to make it more severe.Footnote 5 Some readers might think that a deterioration of cognitive public security, driven by a series of salient crime cases, sways public opinion in favour of a severe criminal justice policy even if public security has not deteriorated in reality. However, Japanese public opinion supporting stringent criminal policy is not directly influenced by a series of salient crime cases, but is based on people’s long-standing societal viewpoint.Footnote 6 Japan is a marginal case as regards the “penal-populism” theory.
A notable feature of Japan’s recent criminal justice policy is that it contains legislation with harsher punishment even for a low-salience issue, while the “penal-populism” theory assumes that there is public demand for a severe criminal justice policy and that public attention is focused on the policy.Footnote 7 In this paper, Japanese legislation with harsher punishment is quantitatively measured. Some of those laws regulate an industry in which the general public is not very interested. (As mentioned in the conclusion of this paper, it is a future topic of research, which can qualitatively assess the type of punishment in each piece of legislation.) Considering that only around 30% of all cases referred to the public prosecutor actually go to courts in the Japanese criminal justice system,Footnote 8 criminal sentences hardly refer to the stringent penalty provisions in industry-regulating laws. Consequently, such laws rarely influence the imprisonment rate or imprisonment term, which were common benchmarks in previous literature to measure the degree of severity of criminal policy. Such laws have been overlooked by previous studies on Japan’s severe criminal justice policy.
Some sceptical readers may argue that such industry-regulating laws with harsher punishment are not worth studying in the context of research on severe criminal justice policy because they are directly concerned with neither public security nor civil liberty. Although these laws might not be concerned with public security, they are probably concerned with civil liberty despite their low saliency. For example, the above-mentioned law to impose harsher punishment for the usage or disclosure of business or trade secrets might have a chilling effect on career-enhancement activities, such as making use of previous career know-how.Footnote 9 It also might penalize a justifiable whistle-blowing and media report on illegal corporate activities.Footnote 10 Another example is the revision of the Copyright Law to penalize the downloading of pirated files to protect the content industry, which was also discussed previously. Under the legislation, even people who just enjoy their favourite digital content through the Internet on their PC could face arrest or, in the least, have a fear of arrest. Although the legislation did not face as much public protest as the Stop Online Piracy Act (SOPA) and Protect IP Act (PIPA) in the USFootnote 11 or the Anti-Counterfeiting Trade Agreement (ACTA) in the EU,Footnote 12 which contain similar provisions, the Japanese measure drew more public attention on the Internet compared to other laws concerning industry regulation and protection that imposed stringent punishment. The trend of public opinion on the Internet was, indeed, against penalizing the act of downloading pirated files, which is contrary to the prediction in the “penal-populism” theory that harsh criminal justice policy is supported by public opinion.
Thus, a majority of Japanese laws imposing harsh punishment remain to be studied, notwithstanding previous research on severe criminal justice policy. As discussed in a later section, extant literature on Japanese severe criminal justice policy looks into the possibility of applying the “penal-populism” theory to Japanese cases without systematic evidence. The author argues that it is difficult to conclude whether the “penal-populism” theory, which has been deduced from the cases in Western countries, is applicable to Japan without systematic evidence. This study quantitatively shows whether Japan has pursued a severe criminal justice policy and, if yes, since when and how. This study contributes to the development of the understanding of severe criminal justice policy in developed countries by demonstrating the limitations of the scope of the “penal-populism” theory.
1.2 Literature review on harsher punishment and penal populism in the world and Japan
The inclination toward harsher punishment is common in Western countries, especially the US and the UK. Garland argues that this has been caused by “late modernity,” which refers to the two countries’ changing social, economic, and cultural patterns in the late twentieth century, and by the policies of neoliberalism and neoconservatism, which are dominant in both countries.Footnote 13 However, this does not explain the wide variations in the severity of punitive actions between countries. Punishment becomes harsher especially in the US. Whitman argues that this trend originated in the American tradition of equality,Footnote 14 while Tonry argues that it originated from the Constitutions of each state that are from the eighteenth century, in which the judges and prosecutors are elected.Footnote 15 Some studies attempt to understand the differences in criminal policy between countries through frameworks of comparative politics.Footnote 16
Pratt views this inclination toward harsher punishment as the result of “penal populism.”Footnote 17 Pratt explains “penal populism” as follows:
victims’ voices, or the voices of those who claim (often with no authority at all to do so) to speak on their behalf has been given an authenticity and validity in relation to the development of crime control policies, while the authority and influence of the criminal justice expert has been decried and reduced.Footnote 18
Pratt’s definition of “penal populism” can be roughly divided into two components. The first is the increasing influence of public opinion over criminal justice policy. This is driven by growing calls for tougher sentences by victims’ associations and law-and-order lobby groups, which have a significant impact on tabloid media that tend to focus on stories about violent crime and victims’ suffering. The second is the declining influence of criminal justice experts due to a decline of trust in existing criminal justice procedures and political elites.
Recent studies on criminal justice policy in the context of criminology and sociology use “penal populism” as a clue to understand the trend of a tougher approach to crime in every country. Pratt explains that, in New Zealand, the influence of “penal populism” depends on the legitimacy of severe criminal policy.Footnote 19 Sozzo studied penal policy during the process of democratization in Argentina and found that criminal policy based on “penal populism” has been pursued by elites and social movements alternately in that country.Footnote 20 Johnson and Fernquest note the similarity and differences between “penal populism” and President Duterte’s war-on-drugs policy in the Philippines.Footnote 21 Some studies examine whether the positions of legislators and the media on criminal justice policy are explained by the “penal-populism” framework.Footnote 22
While this series of research mainly stems from the contexts of criminology and sociology, there is a shortage of political research into criminal justice policy.Footnote 23 This is because criminologists and sociologists are not very interested in the political dimension, and political scientists have little interest in criminal policy except in the context of comparative political culture.Footnote 24 A problem common to studies on severe criminal justice policy in the context of criminology and sociology is the relative shortage of interest in micro-level political variables that directly influence micro-level policy. Collective micro-level policy leads to macro-level harsher punishment. Therefore, those studies lack the micro-level foundation required to analyze the causal mechanism of severe criminal justice policy. This is because they tend to be more interested in severe criminal justice policy itself, and in the mezzo- or macro-level social structure behind it. While Garland regards “late modernity,” which is a macro-level change in social structure, as a cause of severe criminal justice policy in the US and the UK as mentioned above,Footnote 25 the American tradition of equalityFootnote 26 and states’ Constitutions from the eighteenth centuryFootnote 27 are considered as the origins of the present-day severe criminal justice policy in the US.
Explanations from mezzo- or macro-level viewpoints in the context of criminology and sociology are suitable for understanding macro-level differences between countries and a relatively long-term variation in a single country. However, they are not suitable for identifying a certain pattern behind the adoption of severe criminal justice policy measures or explaining a relatively short-term variation in the implementation of harsher punishment. In order to explain the criminal justice policy-making process, it is not enough to understand whether the positions of legislators and the media are explained by the “penal-populism” framework because there are other potential political variables influencing policy outcomes. In sum, if researchers ask why there are more laws with harsher punishment than before, it will be necessary to define and measure legislation with harsher punishment as a dependent variable and to explain the variance by focusing on micro-level political variables influencing the policy-making process. The proper way to infer causality in social sciences also needs to be considered.Footnote 28
Although there is a shortage of political research into criminal justice policy as mentioned above, it seems that the recent increase in the incarceration rate of the US has drawn political scientists’ interest. There is a growing body of political research in which the dependent variables are the incarceration rates at the federal and state levels, and the independent variables are relatively micro-level political factors.Footnote 29 There is also political research of Boushey, whose dependent variable is the legislation of state governments.Footnote 30 This study is similar to Boushey’s in terms of analyzing not the incarceration rate, which is a judicial aspect of severe criminal policy, but legislation.
To fill the exiting research gap, it is necessary to explain the recent wave of severe criminal justice policy measures by focusing on micro-level political variables. This type of study needs a clear definition and measurement of legislation with harsher punishment as a policy outcome of severe criminal justice policy, which is a dependent variable to be explained by micro-level political variables. In addition to providing the definition and measurement, this paper mainly shows a time-series trend, identifies the ministries that mainly contribute to the growing trend of adopting harsher penalties for offenders, and outlines the partisan conflict in the legislative process. This study lays the foundation for the future examination of micro-level political variables influencing legislation with harsher punishment.
1.3 Three dimensions of harsher criminal policy
Harsher punishment in Japan drew sociologists’ interest in the 2000s. Harsher criminal policy is measured by three dimensions. The first is harsher punishment in sentencing. This is measured by an increase in the average degree of punishment. Some studies show the progression of harsher criminal policy in Japan by using the incarceration rate.Footnote 31 The second is the intolerance of crimes and criminals in public opinion. Hamai and Matsubara examine this through citizen surveys.Footnote 32
The third is legislation with harsher punishment. This means extending the length of imprisonment, increasing the amount of a fine, or defining a new criminal act through legislation. Feeley argues that Japan is expected to resist “penal populism” because Japan is categorized as a strong state with a weak civil society in which the public rarely plays a key role in policy-making.Footnote 33 Moreover, the Ministry of Justice (MoJ) has jurisdiction over much of criminal law and drafts Bills based on reports by the Legislative Council of the MoJ (Hōsei Shingikai), in which criminal justice experts such as judges, prosecutors, lawyers, and criminal-law professors are the majority. It is not easy for politicians to be fully involved in the process of criminal-law-making, which limits the direct influence of a public that demands harsher punishment.
Nevertheless, sociological research explains legislation with harsher punishment in Japan through the “penal-populism” theory. For example, Hamai explains the political mechanism of institutionalization based on “the myth of public security deterioration” by the concept of Best’s “iron triangle.”Footnote 34 In the concept, a moral panic triggered by media coverage arouses a serious social issue by involving the media, activists, politicians, and experts. Hamai argues that the crime victims do not have more influence than the prosecutors, who are much more independent from politics or public opinion than those in the US, because the most recent legislation regarding harsher punishment does not restrict the prosecutor’s power.Footnote 35 Prosecutors are political actors who actively promote harsher punishment in the context of the crime victims’ activities and public support. On the other hand, Miyazawa regards the role of the conservative politicians who supported the activities of crime victims’ groups as important.Footnote 36 Prosecutors, as bureaucrats of the MoJ, resisted some demands of crime victims’ groups, which probably changed the basic structure of the Criminal Law and limited prosecutors’ power in criminal proceedings, but they were forced to accept them because of pressure from core government executives or the ruling Liberal Democratic Party (LDP) executives who specialize in judicial policy (who are referred to as “shihō-zoku”).Footnote 37 Some researchers indicate that the changes in political institutions and the external environment surrounding actors are important variables, including the electoral-system reform in 1994 enlarging the scope of politicians’ interest from local to national issues and policies,Footnote 38 the increase in the issue salience of criminal policy and growing distrust in governmental expertise,Footnote 39 and the emergence of high-profile charismatic crime victims.Footnote 40
A common feature among these studies on harsher punishment in Japan is focusing on several salient legislative processes, such as the revision of the Juvenile Law triggered by the Kobe murder in 1997.Footnote 41 This leads to the conclusion that the “penal-populism” theory has efficacy in explaining Japanese cases of harsher punishment. Although Asada tries to grasp harsher punishment more broadly, the research is only to enumerate 20 legislative cases regarding harsher punishment.Footnote 42 However, because case-studies of salient legislation have the risk of selection bias conforming to the theory, they do not sufficiently confirm the validity of the “penal-populism” theory. Kyo argues that other theoretical explanations of harsher punishment are needed because the cases that Asada enumerates include those which the “penal-populism” theory does not explain.Footnote 43 Therefore, there is little systematic evidence regarding legislation with harsher punishment in Japan relative to the other two dimensions: harsher punishment in sentencing and the intolerance of crimes and criminals in public opinion. We cannot conclude whether the “penal-populism” theory explains legislation with harsher punishment in Japan.
This paper shows quantitative evidence that the Japanese government has created progressively more laws with harsher punishment, and attempts to show how and partly why this has happened through a quantitative analysis of the legislative process.
2. Data measuring legislation with harsher punishment
This study tries to understand recent Japanese legislation with harsher punishment quantitatively, based on the literature review above. Asada classifies legislation with harsher punishment into two categories: one in the narrow sense and one in the broad sense.Footnote 44 Legislation with harsher punishment in the narrow sense (hereafter “narrow HP”) means extending the length of imprisonment or increasing the fine that are outlined by the existing law. Harsher punishment in the broad sense (hereafter “broad HP”) means defining a new criminal act that was previously legal. Based on these definitions, this study operationally defines legislation with harsher punishment in both the narrow and the broad senses. The seven kinds of penalties that this study focuses on are capital punishment (shikei), imprisonment with forced labour (chōeki), imprisonment without forced labour (kinko), fine (bakkin), detention (kōryū), minor fine (karyō), and confiscation (bosshū), all of which are provided by Article 9 of the Criminal Law. The non-penal (administrative) fine (karyō or ayamachi-ryō) is excluded from this study. Because there was no legislation introduced defining a new crime worthy of capital punishment during this study, the de facto penalties that this study focuses on are imprisonment with forced labour, fine, and, in rare cases, imprisonment without forced labour.
The legislations analyzed in this study are all acts that were passed by the Diet from 1990 to 2016 (N = 3,427). These acts were chosen in order to confirm the trend indicated by previous literature that legislation with harsher punishment started to increase in the late 1990s.Footnote 45 Legislation consists of enacting new law and revising existing law. In the case of enacting new law, this study classifies laws with penal provisions as legislation with harsher punishment because they correspond to its broad definition. In the case of revising existing law, this study classifies acts extending the length of imprisonment or increasing the fine as legislation with harsher punishment because they correspond to its narrow definition, and classifies acts defining new criminal acts as legislation with harsher punishment because they correspond to its broad definition.
The concrete means for distinguishing legislation with harsher punishment is as follows. First, all the article provisions of the legislation on the House of Representatives (HR, Shūgiin) website were searched for the seven kinds of penalties by using them as search terms. Second, the author confirmed the penalties included in each article found using the search terms. Third, the author judged whether the act corresponded to the operational definition of legislation with harsher punishment in this study. For example, acts containing the following article provision correspond to the narrow definition of legislation with harsher punishment:
This act revises “1.5 million yen” in the article 206 into “imprisonment no more than three years or 3 million yen.”Footnote 46
Acts containing article provisions such as the following correspond to the broad definition:
This act adds the following header and two articles.
[Penalty]
Article 61: … imprisonment no more than five years or fine no more than 2.5 million yen.Footnote 47
There are cases, such as “This act revises the article XX into the following,” in which the author cannot judge by the article provisions of the acts on the website. Cases like this were judged using a comparative table of the prior and amended article provisions on the Japanese legal information database “D1-Law.” In the case of old legislation with a comparative table that did not appear on the database, the author compared the article provisions of the amendment act with those in the relevant statute books in the library.
This method of judgement has three limitations. First, there is a risk that the author did not capture all pieces of legislation with harsher punishment in the narrow or broad sense. It is likely that an article corresponding to the narrow definition of legislation with harsher punishment is not hit by search terms such as “imprisonment (chōeki or kinko)” or “fine (bakkin),” such as: “This act revises ‘1.5 million yen’ in article XX into ‘3 million yen’.” However, as long as such articles for amending existing laws are not biased in a certain duration, there is no obstacle to observing the trend of legislation with harsher punishment over time.
Second, this method might regard the optimization of penalties as harsher punishment. A representative example of it is “The Amending Act of the Criminal Law to Raise the Amount of Fines” (No. 31 of 1991). This act contains many article provisions designed to raise the fines, such as the provision to increase the lowest fine issued by the Criminal Law by 500 times. For example, an article provision that reads “This act revises ‘20 yen’ in article 15 into ‘10,000 yen’” corresponds to legislation with harsher punishment in this study but should be regarded as optimization to match the current economy (the price of a canned drink from a vending machine was 110 yen in 1991). However, it is difficult to distinguish the optimization of punishment from harsher punishment through empirical analysis because the distinction draws from the evaluator’s personal values. This study uniformly regards them as harsher punishment in order to avoid arbitrary judgement from the author’s values.
Third, this study does not sufficiently confirm whether a piece of legislation with broad HP is substantially harsher. That is, legislation that is regarded as broad HP might contain revising only the expression of the articles but not substantially expand the range of the illegal act. This problem, however, is not sufficiently addressed by a quantitative analysis, so the author plans to complement this study with a qualitative analysis in the future.
3. A quantitative analysis of legislation with harsher punishment
3.1 A time-series variation of legislation with harsher punishment
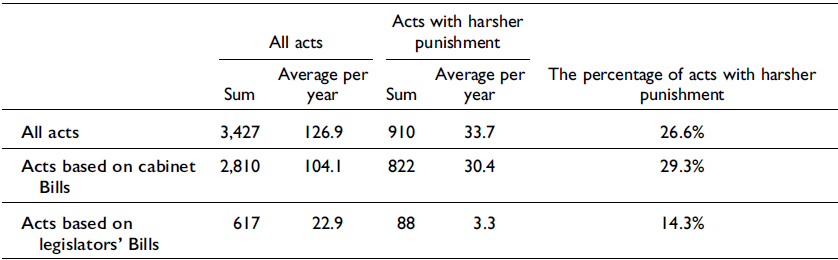
This section confirms the summary of the data gathered through the method above and conducts a partial quantitative analysis. Table 1 is a summary of the number of all pieces of legislation and of legislation with harsher punishment from 1990 to 2016, which is categorized as acts based on Bills introduced by the Cabinet (cabinet Bills) and legislators (legislators’ Bills). Although the number of acts with harsher punishment based on legislators’ Bills might be larger from the standpoint of the “penal-populism” theory, the percentage is smaller than those for all acts or the acts based on cabinet Bills. The percentage of acts based on legislators’ Bills is small in Japan to begin with. Thus, because the influence of the legislators’ laws on legislation with harsher punishment is sufficiently weak, this study mainly focuses on the legislation based on cabinet Bills.
The number of all acts and acts with harsher punishment

Source: The author.
In focusing on the acts based on cabinet Bills, it is necessary to consider the temporal accumulation of new legislation regarding the establishment of government institutions. There were many acts for reorganizing central ministries and agencies and establishing independent administrative agencies in 1999, and acts for reorganizing special public corporations in 2002. Most of the acts regarding the establishment of government institutions contain article provisions punishing employees for confidentiality breaches. As these provisions are obviously different from the harsher punishment that previous literature and this study intend to examine, this study excludes these acts from legislation with harsher punishment. More specifically, this study does not regard new (not revising) acts for establishing government institutions as legislation with harsher punishment.
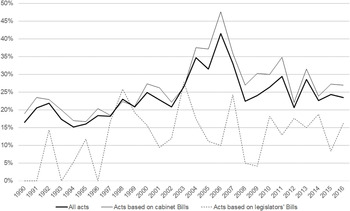
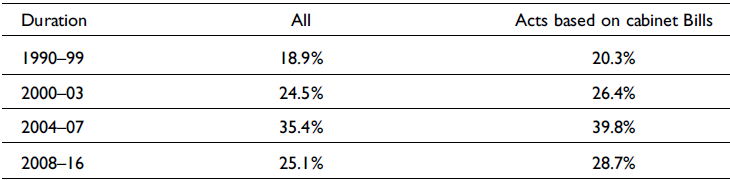
Figure 1 is a line graph representing the time-series variation in the percentage of legislation with harsher punishment that compares all acts, the acts based on cabinet Bills, and the acts based on legislators’ Bills per year. Table 2 represents the average of the percentage of acts with harsher punishment during four terms (1990–99, 2000–03, 2004–07, and 2008–16) that were determined based on the trend in Figure 1. The percentage of acts with harsher punishment was only about 20% in the 1990s, increased to about 25% in the first years of the 2000s, increased to about 35% of all acts and 40% of acts based on the cabinet Bills in 2004–07, and decreased to around 25% after that. Therefore, legislation with harsher punishment quantitatively increased especially during the middle of the 2000s.
Time-series variation in the percentage of legislation with harsher punishment. Source: The author.

The percentage of acts with harsher punishment (average for each duration)

Source: The author.
Readers may anticipate a detailed examination of the factors affecting the trend. Some readers who are familiar with Japanese politics may argue that the severe criminal justice policy approach had progressed under the neoliberal policy direction of the Junichiro Koizumi Cabinet from 2001 to 2006 and the Shinzo Abe Cabinet from 2006 to 2007, and weakened under the Cabinet of the Democratic Party of Japan (DPJ) from 2009 to 2012. If the policy preference of the Cabinet was a major influencing factor, the percentage of acts with harsher punishment should have increased under the Abe Cabinet after 2012. However, the percentage temporarily increased in 2011 under the DPJ government, but no increasing trend was observed after 2012, although only limited data are available until 2016. The question of whether the neoliberalism ideology is related to support for severe criminal justice policy in Japan needs to be empirically tested. In addition, as mentioned in the literature review, we have to infer the causality of the cases based not on mezzo-level factors like the ideology of the Cabinet, but on micro-level variables in the political process. This paper focuses on showing the trend based on the data. Pursuing the causal variables is a topic for future research.
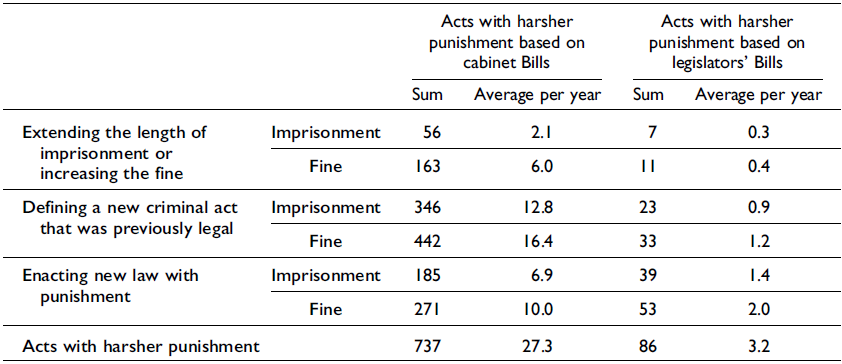
In order to confirm the trend of legislation with harsher punishment, 737 acts with harsher punishment based on cabinet Bills comprising of 463 revising acts and 274 new acts (except for acts establishing new institutions) and 86 acts with harsher punishment based on legislators’ Bills are classified into the following three categories according to the modes of punishment. Because each category has harsher punishment concerning imprisonment and fine, each category was subdivided into two. The first category includes acts with provisions extending the length of imprisonment (chōeki or kinko) or increasing the fine; these acts constitute narrow HP. The second category includes acts with provisions defining a new criminal act that was previously legal; these acts can be considered broad HP. While these two categories are for revising acts, the third category consists of acts enacting new law with punishment corresponding to broad HP.
The total number of acts and average number of acts per year for each category are presented in Table 3. Among all the acts with harsher punishment based on cabinet Bills (737 acts), around 60% define a new criminal act with fine and around 47% define a new criminal act with imprisonment; both are broad HP. Further, acts in “extending the length of imprisonment or increasing the fine,” which constitute narrow HP, are at 22.1% with fine and only 7.6% with imprisonment. On the contrary, among acts with harsher punishment based on legislators’ Bills, most are in the “enacting new law with punishment” category while the proportion of revised acts is relatively small.
Categories of modes of harsher punishment

Source: The author.
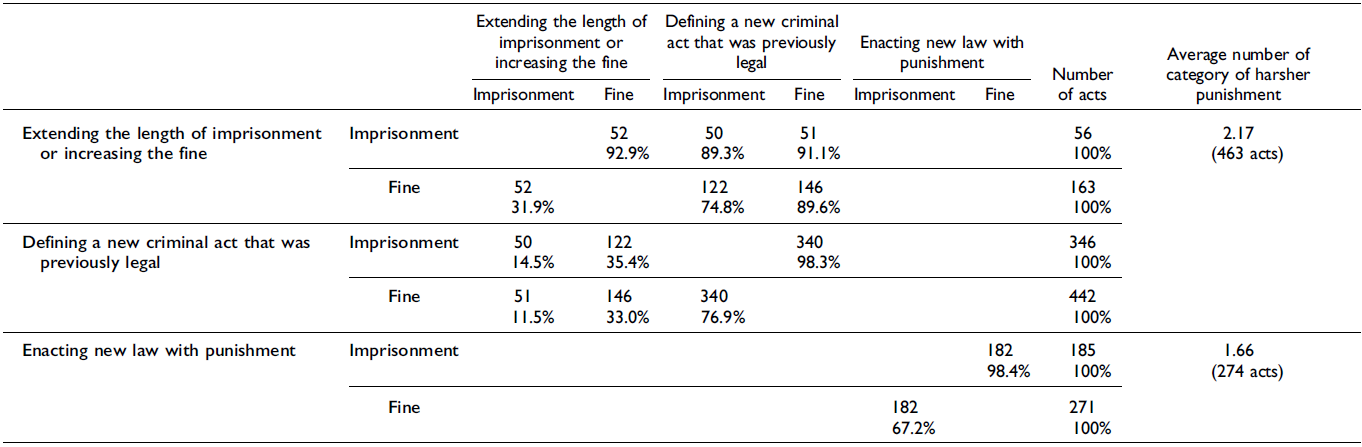
Because one act contains multiple provisions, each act with harsher punishment has a minimum of one and a maximum of four modes of harsher punishment (new acts have a maximum of two modes). Table 4 is a cross tabulation of these modes of harsher punishment. The numbers and percentages in the table represent the overlap of modes of punishment in acts. For example, the first column shows that 14.5% of acts “defining a new criminal act with imprisonment” contain the modes “extending the length of imprisonment” as well. More than around 90% of acts extending the length of imprisonment contain other kinds of harsher punishment. Around 90% of acts increasing the fine also contain “defining a new criminal act with fine.” Most acts that define a new criminal act that was previously legal contain provisions with both imprisonment and fine.
Correlation between categories of modes of harsher punishment

Source: The author.
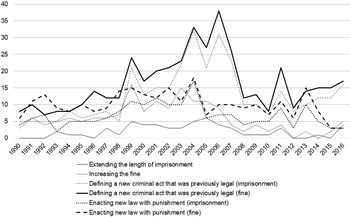
Figure 2 is a line graph representing the time-series variation in the number of acts with harsher punishment based on cabinet Bills in all modes of harsher punishment. The number of acts “defining a new criminal act with both imprisonment and fine” (broad HP) grew in the mid-2000s. The number of acts “extending the length of imprisonment and increasing the fine” (narrow HP) also grew during the same period. The rise in the number of acts with harsher punishment in the mid-2000s is mainly attributable to more acts with broad HP being passed. Considering that most acts with narrow HP also contain one broad HP, the growth in the number of acts with narrow HP is partially responsible for the surge in the mid-2000s.
Time-series variation in the numbers of pieces of legislation with harsher punishment by categories of modes of harsher punishment. Source: The author.

3.2 Who drafts Bills with harsher punishment?
The last section confirmed the time-series variation in legislation with harsher punishment and showed an increase in this type of legislation in the middle of the 2000s. The spike is obvious in the acts based on cabinet Bills. Which ministries affected the trend through drafting Bills? The important previous literature argues that the bureaucrats of the MoJ and public prosecutors who are the legal professions possess the main law-making and law-revising powers in criminal lawsFootnote 48 and promote legislation with harsher punishment.Footnote 49 However, the legislative cases that previous literature upheld as concrete examples of legislation with harsher punishment are not always acts for which the MoJ is responsible, such as harsher punishment for drunk driving through the revision of the Road Traffic Law regulated by the National Public Safety Commission (NPSC); the extension of illegal acts in the Unfair Competition Law regulated by the Ministry of Economy, Trade and Industry (METI); and the establishment of a penalty for downloading pirated files by the revision of the Copyright Law regulated by the Ministry of Education, Culture, Sports, Science and Technology (MEXT).
The author specifies the ministries and agencies that draft and submit the Bills for all acts in this study in order to confirm which ministries contributed to the rising trend of legislation with harsher punishment. Because most of the standing committees of the Diet are parallel to the ministries that introduce the Bills that they deliberate on (e.g. the Committee of Economy, Trade and Industry reviews the Bills drafted by the METI), the author regards a Bill submitted to a standing committee as a Bill drafted by the parallel ministry. In the case of a committee for which the corresponding ministry that drafted the Bill is uncertain, the author determines the minister who explained the Bill in the committee and regards her/his ministry as the one drafting the Bill. This study defines the ministries as 14 government institutions (the Cabinet Office, 11 ministries, NPSC, and Reconstruction Agency), in which the cabinet ministers are the head, and uses the names of the ministries established after the reorganization in 2001.Footnote 50
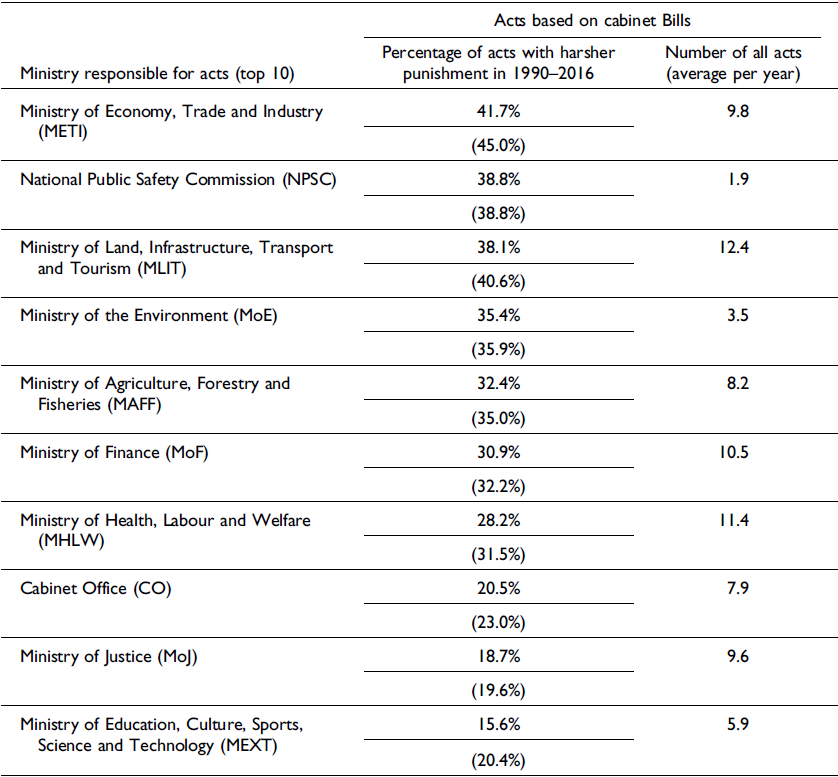
Table 5 represents the top ten ministries with the largest percentage of acts with harsher punishment among the 14 government institutions. The total number of acts (average per year) based on the Bills introduced by each ministry is in the right column. The ministries that have a larger percentage of legislation with harsher punishment are the METI; Ministry of Land, Infrastructure, Transport and Tourism (MLIT); NPSC; and Ministry of Environment (MoE) in descending order. However, because the average number of all the Bills drafted by the NPSC and MoE is only 1.9 and 3.5 each per year, respectively, which is around one-third of the Bills drafted by the other ministries, this study exempts them from the following analysis. Because the ministries that relate to industry rank more highly, it is probable that legislation with harsher punishment is quantitatively linked to acts that regulate a certain industry. The percentage of acts with harsher punishment based on Bills drafted by the MoJ, which is responsible for general criminal laws, is about 20%.
Ministries responsible for acts with harsher punishment based on cabinet Bills (top 10)

The upper value is the percentage whose numerator excludes acts establishing new institutions. The lower value is the percentage whose numerator includes them.
Source: The author.
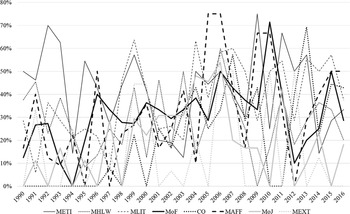
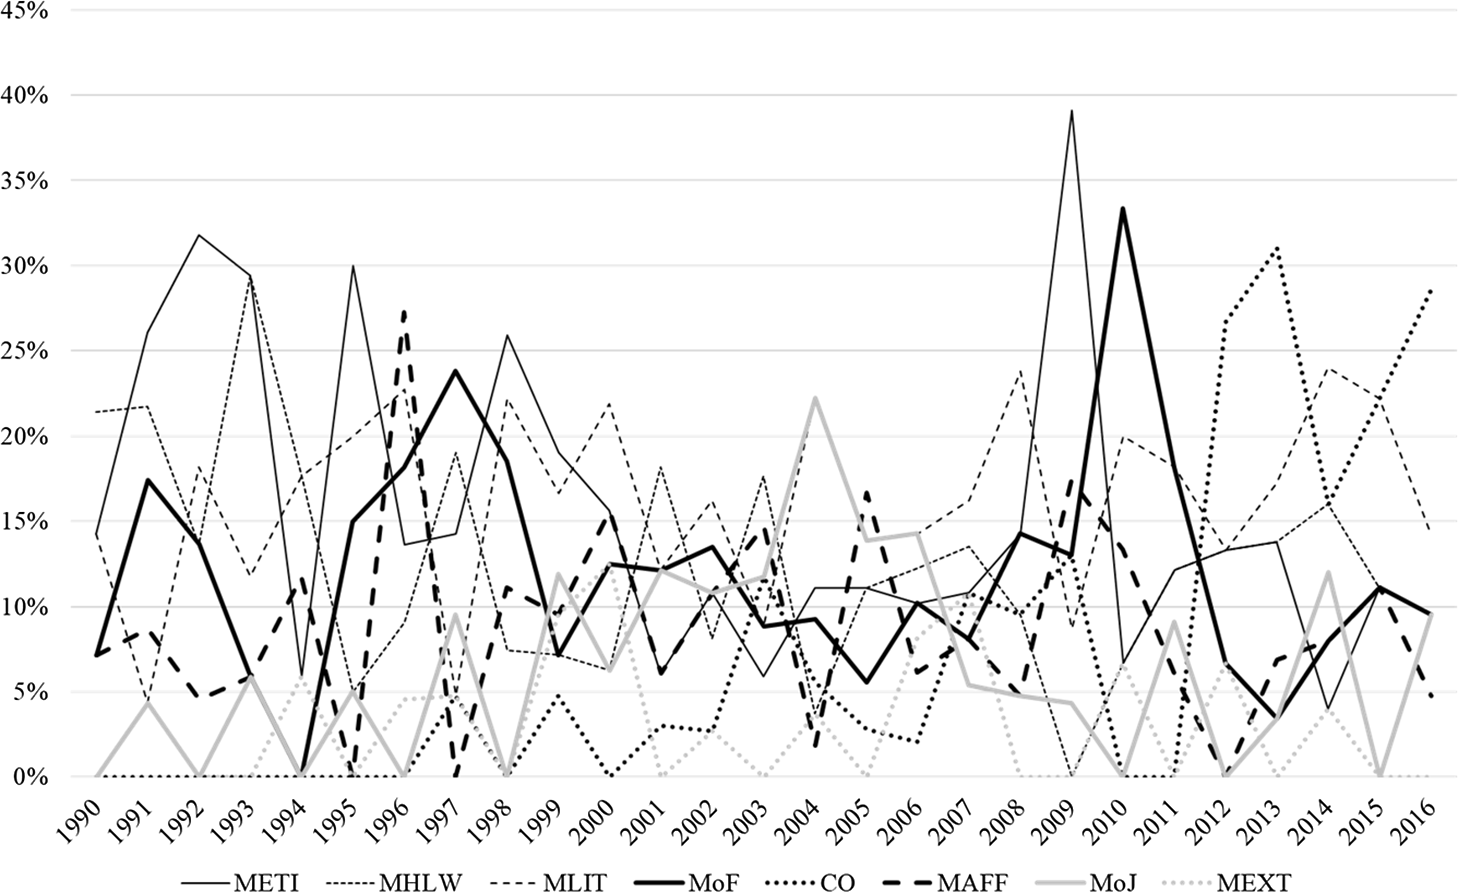
Figure 3 represents a time-series variation in the percentage of acts with harsher punishment out of all acts per ministry listed in Table 5 (except for the NPSC and MoE). The graph indicates that the trend from 2000 to 2007 is different from those of all other periods. In the years other than 2000–07, the variation in the percentage of acts with harsher punishment per ministry is large. While there are ministries that have no acts with harsher punishment, there are also ministries for which 70–80% of all the acts based on their Bills are acts with harsher punishment. In contrast, from 2000 to 2007, six of eight ministries introduced Bills with harsher punishment every year, except for the Cabinet Office in 2000 and the MEXT in 2001, 2003, and 2005. Moreover, while the percentage of acts with harsher punishment per ministries concentrates around 20–40% from 2000 to 2003, the percentage increases to around 40–50% from 2004 to 2007. As the graph might be difficult to read because of its crowded lines, it may be helpful to mention the average percentage and variance figures for each period. The mean percentages and variances are 21.4% and 2.9 percentage points (pp) from 1990 to 1999; 25.7% and 1.7 pp from 2000 to 2003; 42.6% and 2.4 pp from 2004 to 2007; and 30.7% and 4.2 pp from 2008 to 2016.
Time-series variation in the percentage of acts with harsher punishment out of all acts by the responsible ministries. Source: The author.

Figure 4 is a graph representing the percentage of acts based on the Bills drafted by the ministries out of all the acts with harsher punishment based on cabinet Bills. This graph also shows a unique trend in 2000 to 2007. In 2000 to 2007, the percentage of every ministry hovers at about 10%, while, in other years, the percentages of some ministries are quite higher than those of the others (only in 2004 are the MLIT and MoJ outstanding). While the average percentages were stable at around 10% in all periods, the average variances were 0.8 pp from 1990 to 1999, 0.3 pp from 2000 to 2007, and 0.7 pp from 2008 to 2016.
Time-series variation in the percentage of all acts based on cabinet Bills with harsher punishment by drafting ministry. Source: The author.

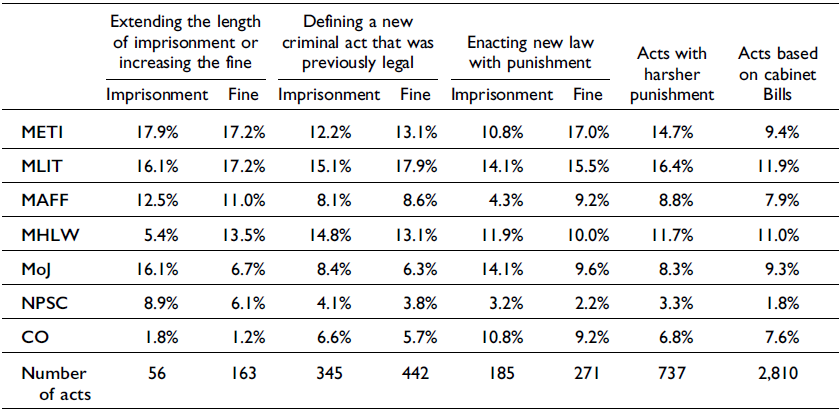
The percentages of ministries responsible for acts in all modes of harsher punishment are presented in Table 6. The rightmost column shows the proportion of total acts based on cabinet Bills that each ministry was responsible for. The column before that shows the proportion of acts with harsher punishment that each ministry was responsible for. The percentages of the METI and MLIT are higher among the acts “extending the length of imprisonment and increasing the fine.” The percentages of these two ministries and the Ministry of Health, Labour and Welfare (MHLW) are higher among the acts “defining a new criminal act that was previously legal.” The growth in acts with harsher punishment was mainly caused by more acts “defining a new criminal act” being passed. Since the METI, MLIT, and MHLW, which are industrial regulatory ministries, initiated the maximum number of acts “defining a new criminal act,” it can be said that the growth in acts with harsher punishment was driven by these three ministries (despite the fact that the MHLW initiated fewer acts “extending the length of imprisonment”). Other ministries to pay attention to in this table are the MoJ and NPSC, which are responsible for acts concerning public security. Although these two ministries are responsible for fewer acts among all acts with harsher punishment based on cabinet Bills, their percentages in acts “extending the length of imprisonment” are twofold. The percentage of the MoJ is also higher in new acts with imprisonment. The MoJ is relatively important as a ministry responsible for acts with imprisonment.
Ministries responsible for acts with harsher punishment and categories of modes of harsher punishment

Source: The author.
Therefore, the reason why the number of acts with harsher punishment increased from the beginning to the middle of the 2000s is not because certain ministries promoted this legislation, but because every ministry increased their percentage of Bills with harsher punishment. Acts with broad HP, which make up a large portion of the total number of acts with harsher punishment, are based on Bills that regulatory ministries are responsible for. In contrast, the percentages for those of the MoJ and NPSC are relatively high in acts with narrow HP.
3.3 Legislation with harsher punishment and partisan conflict
According to the “penal-populism” theory, harsher punishment is caused by civil emotion, which demands severe counter-measures to crime. On the relationship between partisanship and the preference for harsher punishment, the customary understanding is that those with a conservative ideology prefer harsher punishment and those with a liberal ideology prefer more tolerance towards crime. However, a study by Silver and Silver introduces the possibility that this relationship is partially a spurious correlation through an experiment in the US.Footnote 51 If many citizens support harsher punishment regardless of partisanship, legislators who seek re-election may find it difficult to oppose Bills with harsher punishment regardless of the political party they belong to. Dollinger et al. adopts consensus across parties as a standard to determine whether the concept of “penal populism” is applicable to Germany through analyzing the parliamentary debates dealing with youth crime.Footnote 52 This study also confirms whether legislation with harsher punishment avoids partisan conflict. The standards used to measure partisan conflict in this study are twofold.
The first standard is whether a Bill is important to partisan conflict. Opposition parties would start a hard debate over a Bill that is important to partisan conflict. In the case of a Bill that opposition parties consider important, it is frequent that opposition parties require the explanation of the Bill in a plenary session before substantial debate in a committee. This study regards acts that are debated once (only to vote) in a plenary session of each house, some of which might be against the opposition parties’ request, as not important to partisan conflict and classifies them as “unimportant.”Footnote 53 When opposition parties consider a Bill to be important, the number of times it is debated in the committee would increase because it becomes difficult to pass other Bills when the opposition strongly protests if the governing parties close the debate early. Thus, this study classifies acts that meet the “unimportant” classification and that are debated fewer than four times in the committee of both housesFootnote 54 as “especially unimportant.”
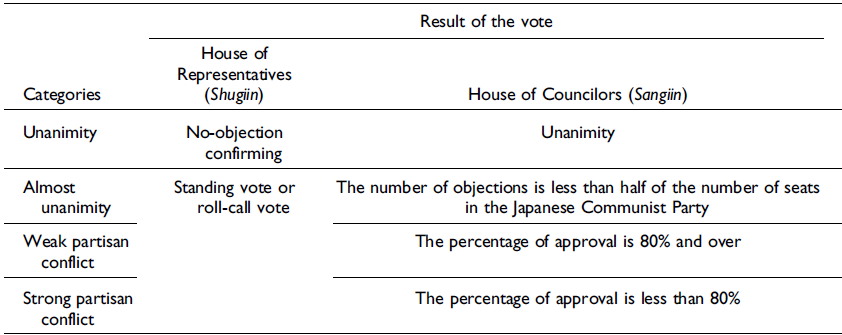
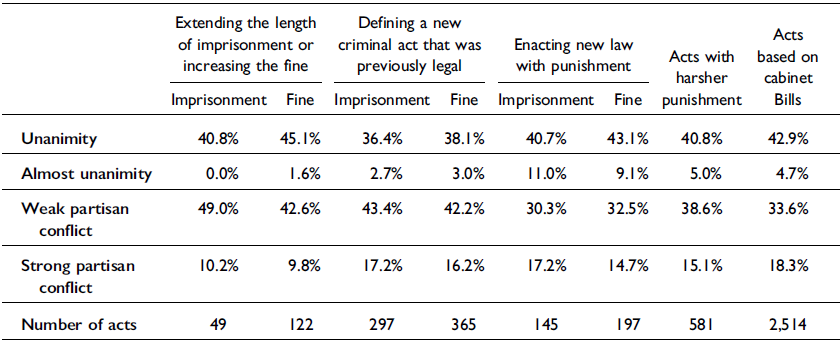
The second standard is the result of the vote on a Bill in a plenary session of both houses. The adoption methods used by the HR are no-objection confirming, a standing vote, and a roll-call vote. The no-objection-confirming method is used when the Bill has been unanimously approved in advance. When the roll-call vote is used, we can see the name of the legislators who both approved and opposed the Bill. However, when the standing vote is used, the number of legislators who opposed the Bill can vary from one to nearly half of the house members. In contrast, because the House of Councilors (HC, Sangiin) has always used a push-button voting system, except for the roll-call vote, since 1998, we can see the number and the names of legislators who approved and opposed the Bill within the record of the proceedings. Therefore, this study classifies the result of the vote on a Bill using the four categories in Table 7, focusing on the result of the vote on a Bill in the HC.Footnote 55 The reason why “almost unanimity” is based on the seats in the Japanese Communist Party (JCP) is because it seems inadequate to classify the acts that are opposed only by the JCP as “partisan conflicts” due to its party voting trend.Footnote 56 In order for the standard to work even if some members of the JCP are absent from the vote, the author has added “less than half of the number” to the definition.
Four categories of the result of the vote on a Bill in the Diet

Source: The author.
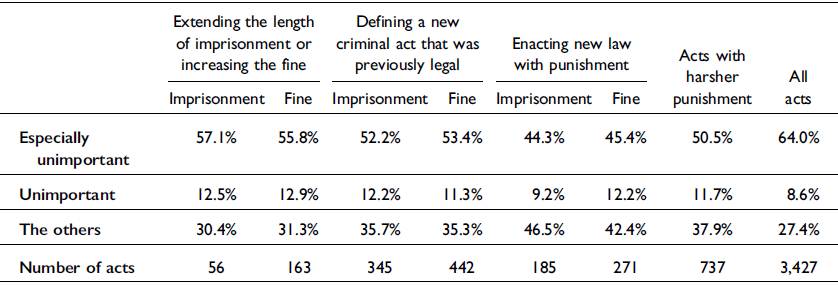
Table 8 presents the relation between the importance of Bills to partisan conflict and the modes of harsher punishment. In contradiction to the “penal-populism” theory, acts with harsher punishment seem important to partisan conflict. Only a small proportion of acts with harsher punishment are in the “especially unimportant” and “unimportant” categories compared to “all acts.” The percentage of “especially unimportant” in new law with punishment is low. However, because the percentage is low in all new law based on cabinet Bills, regardless of provisions with punishment, the modes of harsher punishment are not related to the importance in partisan conflicts in this regard.
Importance to partisan conflict of acts with harsher punishment and categories of modes of harsher punishment

Source: The author.
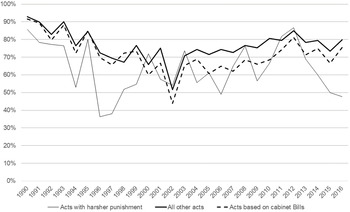
Figure 5 is a graph comparing acts with harsher punishment and other acts (all acts and acts based on cabinet Bills) by the percentage of unimportant acts, which is the first standard measuring partisan conflict. The percentages in the graph sum up “unimportant” and “especially unimportant” acts. The difference between the acts with harsher punishment and the other acts was found to be statistically significant at a 1% level by an unpaired t-test. There are large differences in 1990–99 (during which previous literature argues that legislation with harsher punishment spiked), in the middle of the 2000s (i.e. 2004 and 2006 when legislation with harsher punishment had quantitatively increased, according to this study), and after 2014. During these time periods, the percentage of “unimportant” acts within acts with harsher punishment is relatively low, which is contrary to the prediction based on the “penal-populism” theory. This means that acts with harsher punishment contain relatively important acts. Thus, acts with harsher punishment received careful attention during the time periods in which previous literature and this study argue that legislation with harsher punishment had increased.
Time-series variation in the percentage of unimportant acts. Source: The author.

Table 9 presents the relationship between the result of the vote on a Bill in a plenary session of both houses and the modes of harsher punishment. In contrast to the prediction based on the “penal-populism” theory, there is no quantitative evidence to suggest that there are fewer partisan conflicts when the Diet pass Bills with harsher punishment. In acts “extending the length of imprisonment or increasing the fine” and “defining a new criminal act that was previously legal,” the percentage of “weak partisan conflict” is higher than that in all acts or all acts with punishment. It is probable that the JCP is inclined to oppose cabinet Bills with harsher punishment.
Result of the vote on Bills with harsher punishment and categories of modes of harsher punishment

This table includes the data after 1998 when the HC adopted the push-button voting system. Please note that the percentage may not always appear to add up to 100% because there are several cases without the push-button voting system or the roll-call vote.
Source: The author.
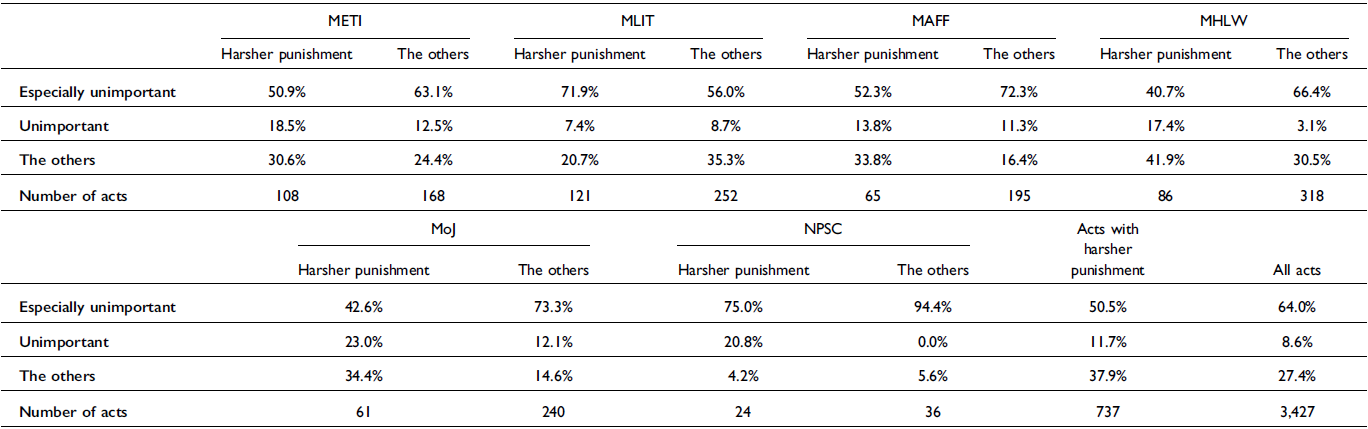
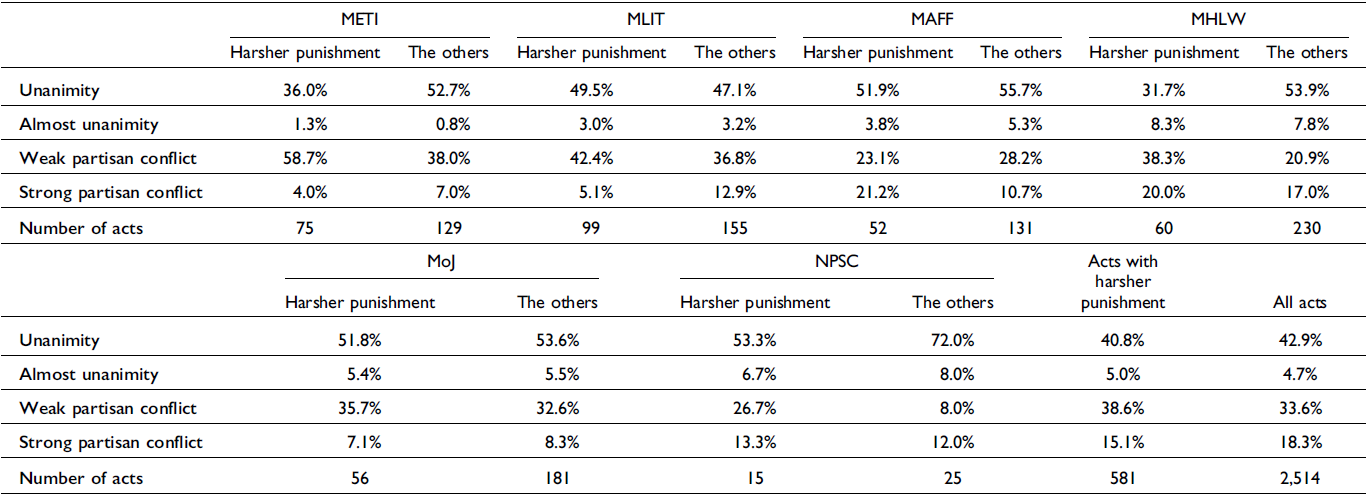
Is there a difference between ministries responsible for acts with harsher punishment in terms of partisan conflict? Table 10 presents the relationship between the importance of Bills to partisan conflict and acts that each ministry is responsible for, which are classified as acts with harsher punishment and other acts. The ministries presented in the table are the METI, MLIT, MAFF, and MHLW whose percentages in acts “extending the length of imprisonment or increasing the fine” and “defining a new criminal act that was previously legal” are high in Table 6; in addition, two ministries (the MoJ and NPSC) in charge of public security are presented in this table. In contrast to the prediction based on the “penal-populism” theory, the percentage of “especially unimportant” among acts with harsher punishment is lower than that in the other acts among most of these ministries except for the acts that the MLIT is responsible for. Table 11 presents the relationship between the result of the vote on a Bill in a plenary session of both houses and acts that each ministry is responsible for, which are classified as acts with harsher punishment and other acts. There is no significant difference between acts with harsher punishment and the other acts that the MLIT, MAFF, and MoJ are responsible for in terms of the result of the vote on a Bill in a plenary session of both houses. However, the percentage of “unanimity” is lower and the percentage of “weak partisan conflict” is higher in acts with harsher punishment than in the other acts among the METI, MHLW, and NPSC.
Importance to partisan conflict of acts with harsher punishment and ministries responsible for acts with harsher punishment

Source: The author.
Result of the vote on Bills with harsher punishment and ministries responsible for acts with harsher punishment

Source: The author.
This analysis shows the following results. As a whole, there is no significant evidence that acts with harsher punishment are less important to partisan conflict than the other acts or that they have fewer partisan conflicts in the vote on a Bill in both houses, in contrast to the prediction based on the “penal-populism” theory. Moreover, taking ministries that are responsible for acts into consideration, the quantitative analysis shows that acts with harsher punishment, that a few ministries are responsible for, are more important to partisan conflict and that acts with harsher punishment evoke more partisan conflicts in the vote on a Bill. Future studies must explore the reason why there is such a difference between ministries.
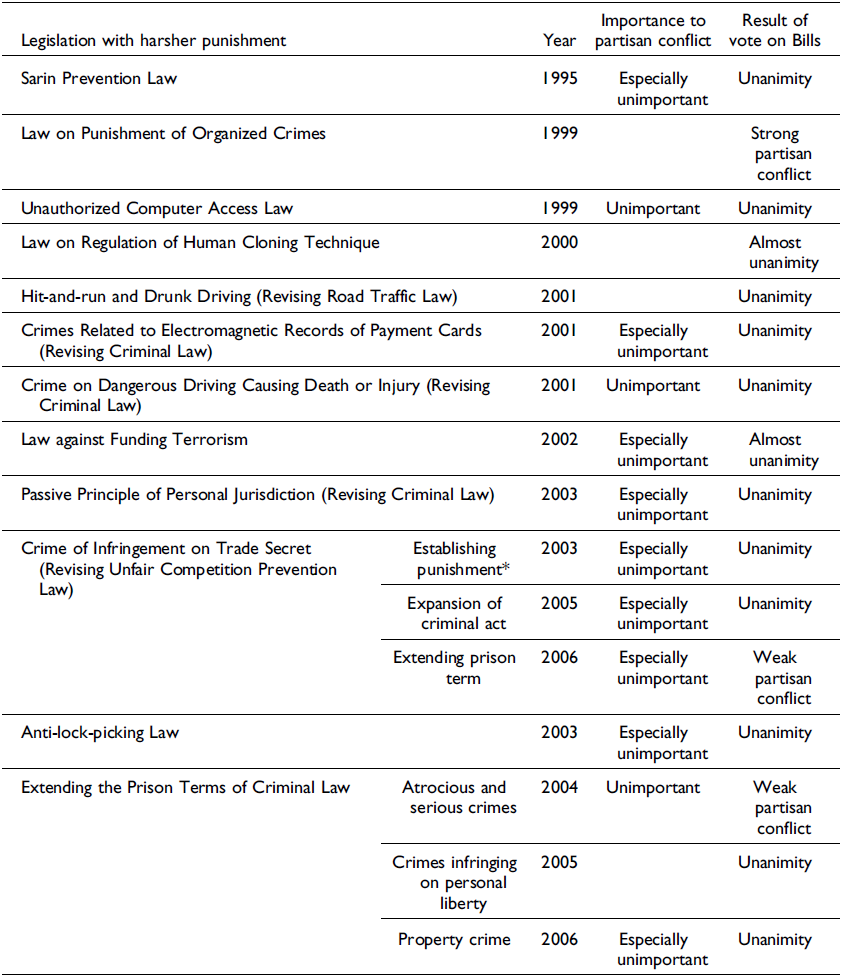
Table 12 is the result of joining Asada’s enumeration of legislation with harsher punishmentFootnote 57 and this study’s classification of legislation in terms of partisan conflict based only on cabinet Bills. While the averages of the percentages of both “unimportant” and “unanimous” acts within acts with harsher punishment are around 50% based on cabinet Bills, both are distinctively more than 50% in the acts enumerated by Asada. Because Asada’s study, which enumerates 20 acts with harsher punishment, is biased toward legislation with harsher punishment without partisan conflict, previous studies focusing on only a small number of acts with harsher punishment have a much stronger bias for the same. Therefore, the argument from previous studies that legislation with harsher punishment in Japan is caused by “penal populism” includes the risk of selection bias.
Partisan conflicts in legislation with harsher punishment enumerated by Asada (Reference Asada2008) (only acts based on cabinet Bills)

The asterisked case does not correspond to the operational definition of legislation with harsher punishment in this study.
Source: The author in referencing Asada (Reference Asada2008).
4. Discussion
This study shows three findings that differ from previous studies on harsher punishment in Japan through the quantitative analysis of legislation with harsher punishment. The first finding is the period of increase in legislation with harsher punishment. While previous literature argues that it was from the latter half of the 1990s, this study shows that legislation with harsher punishment quantitatively increased more in the mid-2000s. The second finding is which ministries promoted this legislation. While important previous literature argues that the bureaucrats of the MoJ and public prosecutors who are the legal professions promote legislation with harsher punishment, this study shows that the reason behind the increase in the number of acts with harsher punishment in the mid-2000s was not that certain ministries made Bills with harsher punishment, but that every ministry increased its percentage of acts with harsher punishment. In terms of quantity, most acts with harsher punishment are those that are harsher in the broad sense and based on Bills initiated by regulatory ministries. The third finding is partisan conflict. While the “penal-populism” theory predicts that legislation with harsher punishment avoids partisan conflicts, this study shows that Bills with harsher punishment do not quantitatively avoid partisan conflict, although there is a difference between ministries in this regard. This study also indicates that previous literature includes the risk of selection bias in relation to partisan conflict.
As mentioned in the literature review, because studies on severe criminal justice policy in the context of criminology and sociology are focused on the mezzo- or macro-level social structure or the positions of legislators and the media, they are not suitable for finding a certain pattern behind the adoption of severe criminal justice policy measures or explaining a relatively short-term variation in the implementation of harsher punishment. However, in the context of political science, there are several studies on American severe criminal justice policy focusing on micro-level political variables. To understand Japanese severe criminal justice policy as a marginal case from the standpoint of the “penal-populism” theory, it is important to make a causal inference by focusing on micro-level political variables that influence legislation with harsher punishment. However, there is no systematic evidence of legislation with harsher punishment being treated as a dependent variable of that causal inference, partly because previous literature on Japanese severe criminal policy has dealt with only a small number of legislative cases. As a result, there is a bias toward the “penal-populism” theory in existing literature on Japanese severe criminal policy.
This study’s main contributions to research on severe criminal justice policy are as follows. First, in contrast to previous literature dealing with only a small number of salient legislative cases, this study quantitatively and systematically measured legislation with harsher punishment. By doing so, this study revealed a new finding regarding the period during which there was an increase in laws with harsher punishment.
Second, this study laid the foundation for causal inference to explain legislation with harsher punishment as an outcome of the influence of micro-level political variables by avoiding the “penal-populism” bias. Although this study only created a data set of legislation with harsher punishment as a dependent variable of the causal inference and partially analyzed the legislative background in terms of responsible ministries and partisan conflict, it has contributed to this research area by making it possible to quantitatively examine political variables that influence legislation with harsher punishment and qualitatively trace legislative processes based on case selection using quantitative measures.
Third, through the Japanese example, this study shows that some categories of severe criminal justice policy that the public is not very interested in are not measured by judicial data such as imprisonment rates. Some of the 737 legislative cases that this study mainly focused on concern industry-regulating legislation. It is a future research issue to reflect the accurate percentage and to show what and whose action faces harsher penalties than before. Some may argue that harsh punishment in industry-regulating legislation is different from severe criminal policy, which has been discussed in the context of criminology and sociology earlier. However, if the Japanese government chooses to toughen criminal punishment in the industry regulative policy area in which the government has other effective options such as setting economic incentives or imposing administrative sanctions, it might indicate that the inclination toward criminal punishment is politically, socially, or culturally embedded in Japan, which cannot be explained by the “penal-populism” theory.
5. Conclusion and future issues
This study quantitatively measured and analyzed recent Japanese laws with harsher punishment. This study shows three findings that differ from the conclusions of previous studies on harsher punishment in Japan and the “penal-populism” theory, which have been summarized in Section 4.
In the context of studies on Japanese severe criminal justice policy, there might be counter-arguments against the arguments made in this study. The counter-argument against the first argument is as follows. Legislation with harsher punishment in the latter half of the 1990s regarding basic laws such as the Criminal Law and the revisions of other laws follows the legislation in the 2000s. Thus, although legislation with harsher punishment quantitatively increased in the mid-2000s, legislation with harsher punishment of qualitative importance increased in the latter half of the 1990s. The author does not deny this counter-argument and needs to evaluate the content of each act and confirm the relationship between legislation in the 1990s and that in the 2000s. The reasons for the number of acts with harsher punishment rising/declining during certain periods need to be investigated.
The second counter-argument is that, although Bills are drafted and introduced by each ministry, the Bills reflect the policy preference toward harsher punishment of the MoJ and public prosecutors that the ministries must negotiate with before the introduction of the Bills to the Diet. To address this, the author will complement this study with a qualitative analysis that traces the policy-making process.
The third counter-argument addresses partisan conflict. Although the legislation quantitatively captured in this study contains article provisions with harsher punishment, it is possible that they were not the main issues and other issues created the partisan conflict. The author plans to answer this counter-argument by expanding the data to measure whether article provisions with harsher punishment were the main issues in the Diet. The reasons for the difference between ministries in terms of partisan conflict need to be investigated.
In sum, there are two future research directions based on the data set of this study. The first is to add more qualitative data to the data set. The present data set from this study comprises the presence or absence of provisions on harsher punishment and the categories of the modes of punishment in terms of dependent variables. As mentioned in Section 4, the author intends to add new data presenting what and whose action faces harsher punishment than before. The updated data set will show what type of harsher punishment is the most prevalent and the time-series trend in each type, which would help to determine the causes of severe criminal policy.
The second is to conduct process-tracing case-studies of a small number of legislative cases. This is not the same as the salient legislative case-studies in previous research. If a case that draws the attention of most readers who are interested in criminal justice is selected because of its saliency, the case-study will have a selection bias, which is similar to the “penal-populism” bias in previous literature that this paper discussed earlier. It is necessary to systematically select cases along typology based on the quantitative data of this study, which will avoid a case-selection bias, to understand the causal mechanism of legislation with harsher punishment.
Acknowledgements
Preliminary versions of this paper were presented at conferences of the Japanese Association of Sociological Criminology, Kobe University Political Science Workshop, Central Japan Workshop of Political Science and Public Administration, Asian Criminological Society, and European Society of Criminology. The author is grateful to all the delegates at these conferences and the reviewers of this Journal who provided much-needed constructive advice. The author also thanks Editage (www.editage.com) for polishing the paper in terms of language editing in English. This work was supported by JSPS KAKENHI Grant Number 19K01356 and the Chukyo University Research Program for the year of 2020.