


Introduction
Water deficit is an important plant abiotic stress. It can be induced by salt stress from irrigation water or saline soil. In order to adapt to salt stress, plants have developed mechanisms to sense and transduce stress signals to activate pathways controlling ionic/osmotic homeostasis and detoxification (Rodriguez-Milla and Salinas, Reference Rodriguez-Milla and Salinas2009). These are reflected as diverse physiological and biochemical approaches such as maintaining turgor by lowering leaf water potential and stomata closure (Martinez et al., Reference Martinez, Kinet, Bajji and Lutts2005), reducing root biomass, e.g. in common fig (Sadder et al., Reference Sadder, Alshomali, Ateyyeh and Musallam2021) and osmotic adjustment by the accumulation of osmolytes (Munns, Reference Munns2002; Läuchli and Grattan, Reference Läuchli, Grattan, Jenks, Hasegawa and Jain2007; Sadder et al., Reference Sadder, Anwar and Al-Doss2013). Such osmolytes can, furthermore, enhance the activity of antioxidant enzymes in scavenging reactive oxygen species following the stress (Miller et al., Reference Miller, Suzuki, Ciftci-Yilmaz and Mittler2010).
Olive (Olea europaea L.) is a major fruit crop in several regions, particularly in the Mediterranean. However, olive cultivation is being increasingly expanded during the last few decades into new growing regions, such as Australia, America (North and South) and China (FAO, 2021). Urbanization and water scarcity are the most limiting factors affecting the expansion of olive cultivation. Therefore, low-quality water such as saline water is a plausible future alternative (Romero-Trigueros et al., Reference Romero-Trigueros, Vivaldi, Nicolás, Paduano, Salcedo and Camposeo2019). Although olive trees are considered to be drought-tolerant (Bacelar et al., Reference Bacelar, Moutinho-Pereira, Goncalves, Lopes and Correia2009), they cannot withstand extreme salinity stress but rather may survive to a certain degree (Chartzoulakis, Reference Chartzoulakis2005; Tattini and Traversi, Reference Tattini and Traversi2009). Saline water was found to have negative impacts on olive tree morphology, physiology and yield (e.g. negatively affecting leaf shape, shoot growth and photosynthesis level) (Loreto et al., Reference Loreto, Centritto and Chartzoulakis2003), causing a reduction in the number and length of roots (Soda et al., Reference Soda, Ephrath, Dag, Beiersdorf, Presnov, Yermiyahu and Ben-Gal2017) and reduced fruit yield (Ben-Gal et al., Reference Ben-Gal, Beiersdorf, Yermiyahu, Soda, Presnov, Zipori, Ramirez Crisostomo and Dag2017). On the other hand, salinity was found to induce thickening of cuticle and outer mesocarp, which would protect fruits against other stresses (Moretti et al., Reference Moretti, Francini, Minnocci and Sebastiani2018).
Salinity tolerance in different olive cultivars is related to ion exclusion and root compartmentation; however, these mechanisms are limited to low salinity levels up to 50 mM NaCl (Chartzoulakis, Reference Chartzoulakis2005; Kchaou et al., Reference Kchaou, Larbi, Gargouri, Chaieb, Morales and Msallem2010). Therefore, olive, as a glycophyte (Chartzoulakis, Reference Chartzoulakis2005; Conde et al., Reference Conde, Silva, Agasse, Conde and Geros2011), is expected to have novel and alternative mechanisms to withstand salinity stress compared to halophytes such as the Mediterranean saltbush (Sadder et al., Reference Sadder, Anwar and Al-Doss2013; Sadder and Al-Doss, Reference Sadder and Al-Doss2014). Recent studies have investigated the molecular bases of abiotic stresses in olive trees – for example, olive aquaporins (Secchi et al., Reference Secchi, Lovisolo, Uehlein, Kaldenhoff and Schubert2007), differential protein expression (García et al., Reference García, Troncoso, Cantos and Troncoso2008), OeMaT1 and OeMTD1 controlling mannitol (Conde et al., Reference Conde, Silva, Agasse, Conde and Geros2011) and differential expression of many olive cDNA using microarray (Bazakos et al., Reference Bazakos, Manioudaki, Therios, Voyiatzis, Kafetzopoulos, Awada and Kalaitzis2012). Therefore, this study was carried out to investigate and characterize further novel genes involved in olive response to salt stress.
Materials and methods
Plant material
In vitro nodal cutting cultures of two olive cultivars (‘Nabali’ and ‘Picual’) were sub-cultured every other month on olive medium (OM) (Rugini, Reference Rugini1984) in a growth chamber as described earlier (Sadder, Reference Sadder2002). Two-month-old shoots were transferred into fresh OM supplemented with a series of NaCl concentrations (0, 30, 60, 90, 120 and 150 mM).
Photosynthesis activity
After 1 week of stress treatment, transient chlorophyll fluorescence was measured using Handy PEA (Hansatech, UK) with an excitation light energy of 3000 μmol/m/s. Means and standard deviation (SD) were calculated for each treatment consisting of 10 replicates.
Cloning salinity-responsive biomarkers
Leaves of stressed plantlets were collected from each stress level and ground with liquid nitrogen. Total RNA was isolated from leaves using a dedicated kit (Qiagen, Germantown, MD, USA) and the first-strand cDNA was generated by reverse transcriptase (Promega, Madison, WI, USA). Eight putative olive salinity-responsive biomarkers (SRBs) were amplified using specific PCR primers. Amplified ESTs were SYBR Gold stained (Life Technologies, Carlsbad, CA, USA) and gel isolated (Promega). Fragments were cloned into pGEM vector (Promega), transformed into E. coli DH5α cells (Stratagene, La Jolla, CA, USA) and Sanger sequenced (ABI, Foster City, CA, USA). The sequences of olive SRBs were deposited in the Genbank (NCBI, 2021) with nucleotide accession numbers (KF953476–KF953483) and protein accession numbers (AHL20262–AHL20269), respectively.
Molecular characterization of salinity-responsive biomarkers
Protein secondary structure and feature predictions were carried out by PSIPRED (Buchan et al., Reference Buchan, Ward, Lobley, Nugent, Bryson and Jones2010). Protein tertiary structure was visualized with PyMOL ver 0.97 (DeLano Scientific LLC, San Carlos, CA, USA). Deduced proteins were assigned to their respected Pfam (Punta et al., Reference Punta, Coggill, Eberhardt, Mistry, Tate, Boursnell, Pang, Forslund, Ceric, Clements, Heger, Holm, Sonnhammer, Eddy, Bateman and Finn2012) and InterPro (Hunter et al., Reference Hunter, Jones, Mitchell, Apweiler, Attwood, Bateman, Bernard, Binns, Bork, Burge, de Castro, Coggill, Corbett, Das, Daugherty, Duquenne, Finn, Fraser, Gough, Haft, Hulo, Kahn, Kelly, Letunic, Lonsdale, Lopez, Madera, Maslen, McAnulla, McDowall, McMenamin, Mi, Mutowo-Muellenet, Mulder, Natale, Orengo, Pesseat, Punta, Quinn, Rivoire, Sangrador-Vegas, Selengut, Sigrist, Scheremetjew, Tate, Thimmajanarthanan, Thomas, Wu, Yeats and Yong2012) protein families. The conserved domain database (CDD) was used to resolve related conserved residues (Marchler-Bauer et al., Reference Marchler-Bauer, Lu, Anderson, Chitsaz, Derbyshire, DeWeese-Scott, Fong, Geer, Geer, Gonzales, Gwadz, Hurwitz, Jackson, Ke, Lanczycki, Lu, Marchler, Mullokandov, Omelchenko, Robertson, Song, Thanki, Yamashita, Zhang, Zhang, Zheng and Bryant2011). Protein sequences of homologues from related plant species were retrieved from the Genbank (NCBI, 2021) and aligned using ClustalW multiple alignment available in BioEdit (Hall, Reference Hall1999). Alignments were bootstrapped hundred times and subjected to the parsimony method with a global rearrangement (Felsenstein, Reference Felsenstein1989). Extended majority rule consensus trees were generated and plotted with TreeView (Page, Reference Page1996).
Expression of salinity-responsive biomarkers
The expression of SRBs was assessed in both olive cultivars using specific primers (online Supplementary Table S1). Gene expression was measured for three biological replicates with quantitative real-time PCR (qRT-PCR) using SYBR Green mix (Qiagen) and Applied Biosystems 7500 thermal cycler (ABI). Primer stringency was verified with melting curves following qRT-PCR. The expression of SRBs was calibrated against the expression of reference olive gene actin 1. The fold change in expression (stressed compared to control) was achieved using the comparative CT method (Livak and Schmittgen, Reference Livak and Schmittgen2001). The means with error bars of 95% confidence interval (95% CI, with z score = 1.96) were calculated as described earlier (Sadder and Al-Doss, Reference Sadder and Al-Doss2014).
Results
Initial screening revealed the presence of a group of novel SRBs in olive. Eight of these SRBs were sequenced and characterized, where six of them have the full-length cDNA, i.e. olive monooxygenase 1 (OeMO1), olive salt tolerance protein (OeSTO), olive proteolipid membrane potential modulator (OePMP3), olive universal stress protein 2 (OeUSP2), olive adaptor protein complex 4 medium mu4 subunit (OeAP-4) and olive potassium transporter 2 (OeKT2). The remaining two genes were partially covered, i.e. olive cation calcium exchanger 1 (OeCCX1) missing a 5′-end portion and olive WRKY1 transcription factor (OeWRKY1) missing a 3′-end portion.
InterPro and Pfam protein families were applied to annotate olive SRBs encoded proteins; OeMO1 (IPR002938, PF01494), OeCCX1 (IPR004837, PF01699), OeSTO (IPR000315, PF00643), OePMP3 (IPR000612, PF01679), OeUSP2 (IPR006015, PF00582), OeAP-4 (IPR001392, PF00928), OeWRKY1 (IPR003657, PF03106) and OeKT2 (IPR003855, PF02705), respectively. Associated gene ontology (GO) terms were matched for investigated olive SRBs (online Supplementary Table S2). Certain SGBs showed clear GO terms associated with biotic (e.g. OeMO1) and abiotic stresses (OeCCX1), while others did not show this type of association is available in the current listing, e.g. OeAP-4.
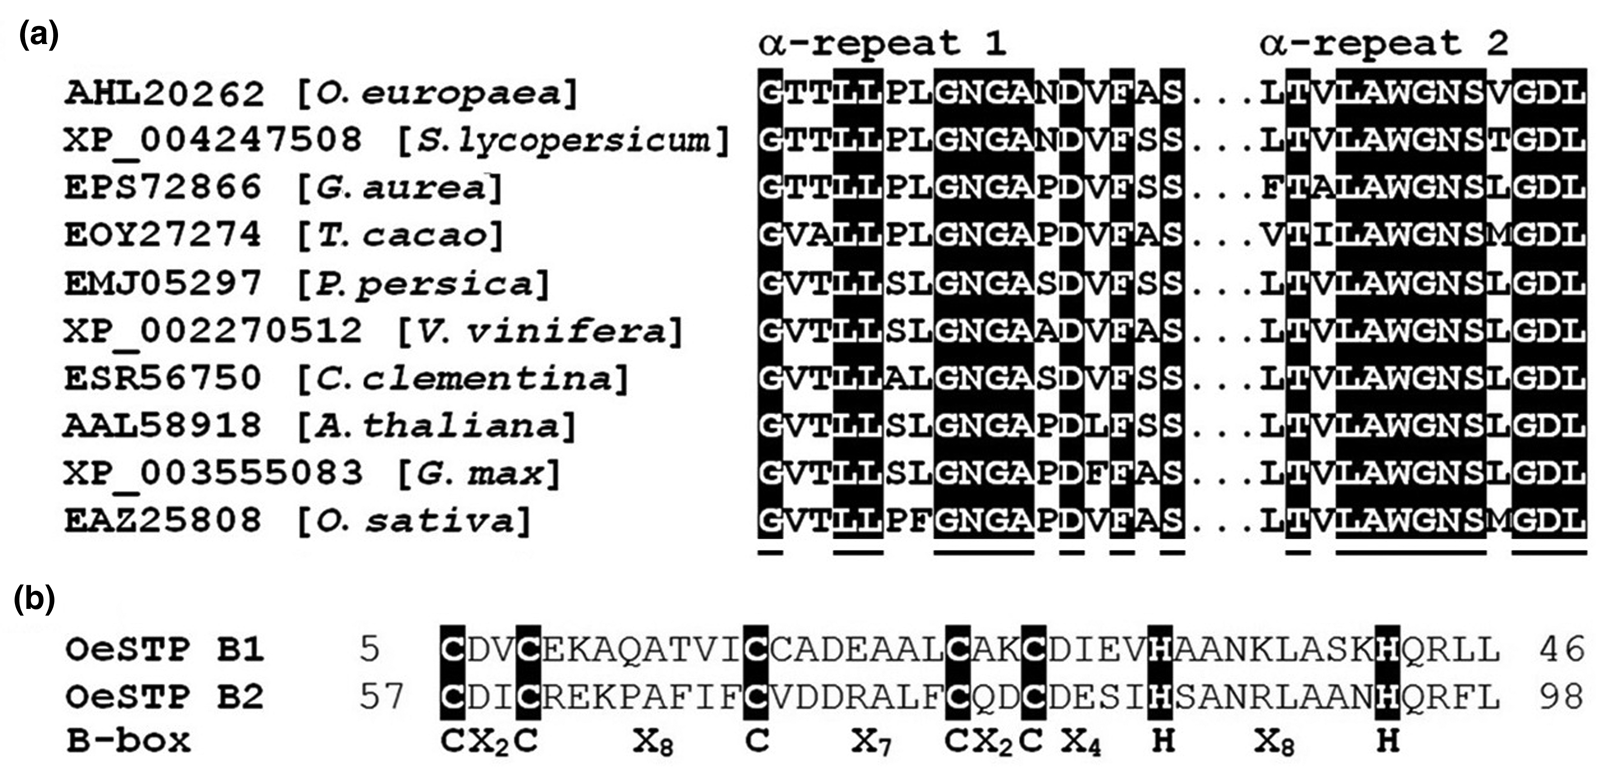
Alignment of OeCCX1 α-repeats with related plant proteins showed the conserved residues GX2L2X2GNGAXDXFXS and XTXLAWGNSXGDL in α-repeat 1 and α-repeat 2, respectively (Fig. 1(a)). Residues along the two α-repeats of OeCCX1 showed similarity to other plant homologues. However, the 10th residue of α-repeat 2 is uniquely a V in OeCCX1. On the other hand, the OeSTO amino acid sequence revealed the distinctive B-box mark (Fig. 1(b)). In fact, OeSTO has two tandem B-boxes, and both share the residues CX2CX8CX7CX2CX4HX8H.
Alignment of protein motifs: (a) Alignment of the two α-repeat regions of OeCCX1 protein and related plant homologues with highlighted conserved residues. (b) Alignment of B-boxes (B1 and B2) of OeSTO protein with highlighted conserved residues and the consensus spacing of C and H residues, where X represents any amino acid.
Moving to the secondary structure, four distinguished helices were predicted for OePMP3 protein (Fig. 2(a)). Moreover, the hydrophilic nature of two stretches (residues 9–27 and 31–55) in OePMP3 were predicted to be embedded in the cell membrane (Fig. 2(b)).
OePMP3 polypeptide structure predictions. (a) Secondary structure. (b) Transmembrane topology showing the pore-lining amino acids 9–27 and 31–55 imbedded in the membrane.

The predicted three-dimensional structure (helices, sheets and turns) of OeUSP2 resembles a basic feature of known universal stress proteins (Fig. 3). All 12 essential residues for ATP binding could be mapped on the sequence using the CCD database, i.e. A10-D12, I40, M122-G123, R125-G126 and G136-T139. An earlier published OeUSP1 (accession number AFP49347), which has a partial sequence of 74 amino acids was compared to the herein described OeUSP2 (accession number AHL20266 with complete 161 amino acids). A pair-wise alignment of OeUSP1 to its counterpart region of OeUPS2 revealed two different proteins (Fig. 4(a)). The aligned portion of the two UPS proteins showed 50% (31/61) identical residues and 64% (40/61) positive residues without any gap (Fig. 4(a)). Moreover, eight of the 12 essential residues for ATP binding could be mapped on the aligned portion using the CCD database.
Predicted structure of OeUSP2 showing sheets in yellow, helices in red and ATP-binding 12 residues in blue (A10-D12, I40, M122-G123, R125-G126 and G136-T139).

Alignment of conserved residues: (a) Alignment of the two olive UPS proteins; OeUPS1 (AFP49347) and OeUPS2 (AHL20266). Conserved residues are highlighted with black background, while eight of 12 ATP-binding residues are highlighted with asterisks. (b) WRKY domains in OeWRKY1 aligned to plant consensus (Rushton et al., Reference Rushton, Somssich, Ringler and Shen2010) WRKY motifs are highlighted in bold fonts and underlines, while C and H residues that form the zinc finger are highlighted in black background and ß-strands are shown as arrows.

The characterized OeWRKY1 has two WRKY domains each with four prominent β-strands (Fig. 4(b)). A pair-wise alignment of both WRKY domains with plant consensus illustrates WRKY motifs and the vital zinc finger residues, i.e. a pair of cysteines and a pair of histidines.
Amino acid sequences encoded by olive SRBs were utilized for phylogenetic analysis. The phylogenetic tree of MO plant homologues revealed large diversity (online Supplementary Fig. S1). Two major clusters were resolved and OeMO1 was grouped in the first one, which was subdivided into two major clades (monocots and dicots). However, the distinctive olive and tomato MO proteins were placed outside these clades. On the other hand, neither olive OeSTO nor potato STO clusters with any plant homologue (online Supplementary Fig. S2). Likewise, the unique OePMP3 protein was located outside the resolved clades of other plant homologues (online Supplementary Fig. S3). While, both OeUSP2 (online Supplementary Fig. S4) and OeAP-4 (online Supplementary Fig. S5) were found to be clustered with the corresponding tomato homologues with relatively good bootstrap values of 74 and 65%, respectively. Finally, OeKT2 along with tomato KT2 protein did not cluster with any plant homologue (online Supplementary Fig. S6)
The measured photosynthesis activity of salinity stressed olive plantlets showed no significant difference at all levels; however, it was slightly increased at 60 mM NaCl level, followed by marginal reduction at higher concentrations (Fig. 5). However, differential gene expression in stressed plants revealed a huge variation among investigated SRBs (Fig. 6). ‘Nabali’ showed up-regulation of gene expression mainly in moderate salinity stress (60 mM). However, ‘Picual’ showed almost consistent expression for a group of SRBs at higher NaCl levels. The expression of OeMO1 was up-regulated at 60 mM with a 22-fold increase (Fig. 6(a)), while the expression of OeCCX1 (Fig. 6(b)) was slightly up-regulated across all stress levels up to a 1.7-fold increase. The expressions of OeSTO (Fig. 6(c)) and OePMP3 (Fig. 6(d)) were significantly up-regulated at 60 mM in ‘Nabali’, while the expressions of OeUSP2 (Fig. 6(e)) and OeAP-4 (Fig. 6(f)) were up-regulated in both cultivars. While the two cultivars showed contrasting expression levels for both OeWRKY1 and OeKT2 across all stress levels, OeWRKY1 was more up-regulated in ‘Nabali’ (Fig. 6(g)), whereas, OeKT2 was more up-regulated in ‘Picual’ (Fig. 6(h)).
Photosynthesis efficiency under different NaCl concentrations for two olive cultivars. Data represent means ± SD.

Fold change in expression under different NaCl concentrations in olive ‘Picual’ and ‘Nabali’ of salinity-responsive biomarkers: (a) OeMO1, (b) OeCCX1, (c) OeSTO, (d) OePMP3, (e) OeUSP2, (f) OeAP-4, (g) OeWRKY1 and (h) OeKT2. Olive actin 1 amplification was used as an internal reference gene. Data represent means ± 95% CI.

Discussion
A group of novel SRBs were found to be differentially expressed in olive. The OeMO1 belongs to the salicylate 1-monooxygenase family, also called salicylate hydroxylase, FAD-binding monooxygenase or flavin-containing MO (FMO). This enzyme converts salicylate to catechol, which is a common intermediate in the degradation of a number of aromatic compounds (phenol, toluene, benzoate, etc.) (Hunter et al., Reference Hunter, Jones, Mitchell, Apweiler, Attwood, Bateman, Bernard, Binns, Bork, Burge, de Castro, Coggill, Corbett, Das, Daugherty, Duquenne, Finn, Fraser, Gough, Haft, Hulo, Kahn, Kelly, Letunic, Lonsdale, Lopez, Madera, Maslen, McAnulla, McDowall, McMenamin, Mi, Mutowo-Muellenet, Mulder, Natale, Orengo, Pesseat, Punta, Quinn, Rivoire, Sangrador-Vegas, Selengut, Sigrist, Scheremetjew, Tate, Thimmajanarthanan, Thomas, Wu, Yeats and Yong2012). In fish, hypersaline conditions cause the induction of FMO through a cis-osmoregulatory and response element 5′-upstream sequence (Obulareddy et al., Reference Obulareddy, Panchal and Melotto2013). The Arabidopsis homologue AtMO1 was found to be preferentially up-regulated in the compatible interaction with Alternaria brassicicola with ecotype DiG (Mukherjee et al., Reference Mukherjee, Lev, Gepstein and Horwitz2009). Moreover, it was found to be expressed in guard cells in response to biotic stresses (Obulareddy et al., Reference Obulareddy, Panchal and Melotto2013). AtMO1 was reported to be down-regulated alongside several salinity-responsive genes when AtMYB23 gene was suppressed (Matsui et al., Reference Matsui, Hiratsu, Koyama, Tanaka and Ohme-Takagi2005). AtMYB23 gene is an MYB domain transcription factor that regulates plant development and stress responses. The reaction catalysed by MO is not known, but one possibility is that this enzyme produces SA-derived aromatic compounds that could have signalling roles. Another possibility is that MO might be involved in the suppression of the SA pathway in Col-0 (Mukherjee et al., Reference Mukherjee, Lev, Gepstein and Horwitz2009).
The OeCCX1 protein has two α-repeat domains, which are unique features in this family (Cheng et al., Reference Cheng, Pittma, Shigaki, Lachmansingh, LeClere, Lahner, Salt and Hirschi2005; Shigaki et al., Reference Shigaki, Rees, Nakhleh and Hirschi2006). The olive OeCCX1 homologue in Arabidopsis, AtCCX1, was found to mediate salinity tolerance in both Arabidopsis and yeast (Chen et al., Reference Chen, Wu, Di, Wang and Shen2012b). CCXs proteins export cations from the cytosol to maintain optimal ionic concentrations in the cell (Shigaki et al., Reference Shigaki, Rees, Nakhleh and Hirschi2006). Plants are able to maintain ion homeostasis to deal with saline conditions by transporting one or more bivalent cations (Cheng et al., Reference Cheng, Pittma, Shigaki, Lachmansingh, LeClere, Lahner, Salt and Hirschi2005) that are energized by the pH gradient established by proton pumps (Shigaki et al., Reference Shigaki, Rees, Nakhleh and Hirschi2006).
OeSTO protein contains two B-boxes as revealed by analysis using the SMART 7 (Letunic et al., Reference Letunic, Doerks and Bork2012), and the two B-boxes (B1 and B2) showed the classical zinc finger type C-X2-H-X7-C-X7-C-X2-C-X5-H-X2-H (Fig. 1). This is similar to the Arabidopsis CO (CONSTANS) protein (Robson et al., Reference Robson, Costa, Hepworth, Vizir, Pineiro, Reeves, Putterill and Coupland2001), which promotes the transition from vegetative growth to flowering (Putterill et al., Reference Putterill, Robson, Lee, Simon and Coupland1995). A CO gene mutant plant was identified by having a late-flowering phenotype (Redei, Reference Redei1962). The OeSTO protein contains two B-box motifs that show 45% identity and 61% similarity with each other (Fig. 1). There are eight conserved residues that could act as metal-binding residues within the B-box motifs in OeSTO. Four of these residues were shown to bind zinc (Robson et al., Reference Robson, Costa, Hepworth, Vizir, Pineiro, Reeves, Putterill and Coupland2001) suggesting that it may interact with DNA. This was further confirmed by nucleus localization similar to the Arabidopsis STO protein (Indorf et al., Reference Indorf, Corder, Neuhaus and Rodriguez-Franco2007). Plant B-box (BBX) proteins are characterized by having one or two B-box domains in the N-terminus, and in some cases, a CCT domain in the C-terminus (Kumagai et al., Reference Kumagai, Ito, Nakamichi, Niwa, Murakami, Yamashino and Mizuno2008). The OeSTO belongs to the structural group VI with topology for both B-boxes. Reported functions of BBX proteins involve transcriptional regulation of plant development including photomorphogenetic processes and abiotic stress responses (Robson et al., Reference Robson, Costa, Hepworth, Vizir, Pineiro, Reeves, Putterill and Coupland2001; Indorf et al., Reference Indorf, Corder, Neuhaus and Rodriguez-Franco2007; Crocco and Botto, Reference Crocco and Botto2013). Although STO expression seems not to be induced by salt treatment in Arabidopsis, it has been shown that its over-expression enhances root growth tolerance under high salinity levels (Nagaoka and Takano, Reference Nagaoka and Takano2003).
The PMP3 protein has multiple names, e.g. plasma membrane protein 3, stress-induced hydrophobic peptide, transmembrane protein and rare cold-inducible protein. It was first characterized in Arabidopsis as a hydrophobic protein (Capel et al., Reference Capel, Jarillo, Salinas and Martínez-Zapater1997) and was experimentally localized in the plasma membrane (Medina et al., Reference Medina, Ballesteros and Salinas2007; Fu et al., Reference Fu, Zhang, Liu, Ying, Shi, Song, Li and Wang2012). In fission yeast (Schizosaccharomyces pombe), the PMP3 stress-induced expression is regulated by mitogen-activated protein kinases, by which they modulate plasma membrane potential, particularly to resist high cellular cation concentrations (Wang and Shiozaki, Reference Wang and Shiozaki2006). The over-expression of maize ZmPMP3 in Arabidopsis was reported to enhance the expression of three ion transporter genes and four antioxidant genes under salinity stress (Fu et al., Reference Fu, Zhang, Liu, Ying, Shi, Song, Li and Wang2012). It is worth mentioning that antioxidant enzyme activities (e.g. glutathione reductase and catalase) were also found to be enhanced under salinity stress in olive (Regni et al., Reference Regni, Del Pino, Mousavi, Palmerini, Baldoni, Mariotti, Mairech, Gardi, D'Amato and Proietti2019).
USP is a small cytoplasmic protein whose expression is enhanced when the cell is exposed to stress agents. Hundreds of USPs were recorded in bacteria, archaea, fungi, protozoa and plants (Siegele, Reference Siegele2005). All 12 conserved residues of USP were revealed in OeUPS2 using CDD (Marchler-Bauer et al., Reference Marchler-Bauer, Lu, Anderson, Chitsaz, Derbyshire, DeWeese-Scott, Fong, Geer, Geer, Gonzales, Gwadz, Hurwitz, Jackson, Ke, Lanczycki, Lu, Marchler, Mullokandov, Omelchenko, Robertson, Song, Thanki, Yamashita, Zhang, Zhang, Zheng and Bryant2011). Moreover, OeUPS2 harbours the common USP motif G-(2X)-G-(9X)-G(S/T), which have been experimentally proven to bind ATP (Tkaczuk et al., Reference Tkaczuk, Shumilin, Chruszcz, Evdokimova, Savchenko and Minor2013). Several USPs were associated with drought stress in a number of plant species (Isokpehi et al., Reference Isokpehi, Simmons, Cohly, Ekunwe, Begonia and Ayensu2011). Novel stress-responsive USPs were identified from both cultivated (Manaa et al., Reference Manaa, Mimouni, Wasti, Gharbi, Aschi-Smiti, Faurobert and Ben Ahmed2013) and wild tomatoes (Loukehaich et al., Reference Loukehaich, Wang, Ouyang, Ziaf, Li, Zhang, Lu and Ye2012). On the contrary, USP was found to be down-regulated by 0.72-fold under salinity stress in Brassica juncea seeds (Srivastava et al., Reference Srivastava, Ramaswamy, Suprasanna and D'Souza2010). Besides the major USP family (PF00582) domain, plant USPs could have kinase domain (PF00069), U-box domain (PF04564), protein tyrosine kinase (PF07714) and transmembrane sodium/hydrogen exchanger family (PF00999) (Isokpehi et al., Reference Isokpehi, Simmons, Cohly, Ekunwe, Begonia and Ayensu2011). The OeUSP2 protein structure has the USP family domain combined with the Na+/H+ antiporter at the C-terminus according to the CDD (Marchler-Bauer et al., Reference Marchler-Bauer, Lu, Anderson, Chitsaz, Derbyshire, DeWeese-Scott, Fong, Geer, Geer, Gonzales, Gwadz, Hurwitz, Jackson, Ke, Lanczycki, Lu, Marchler, Mullokandov, Omelchenko, Robertson, Song, Thanki, Yamashita, Zhang, Zhang, Zheng and Bryant2011). OeUSP1, a paralogue gene identified earlier, showed good homology to the herein described OeUSP2 (Fig. 4(a)). However, the expression of OeUSP1 was found to be enhanced in response to insect infestation rather than salt stress (Corrado et al., Reference Corrado, Alagna, Rocco, Renzone, Varricchio, Coppola, Coppola, Garonna, Baldoni, Scaloni and Rao2012). Other plant species such as Arabidopsis has many paralogues of USP, i.e. at least 44 different proteins (Kerk et al., Reference Kerk, Bulgrien, Smith and Gribskov2003).
Adaptor protein (AP) complexes are recruited to the membrane in post-Golgi traffic by activated ADP ribosylation factor GTPase. AP complexes are engaged in sorting cargo molecules and mediate clathrin assembly for clathrin-coated vesicle formation (Park et al., Reference Park, Song, Reichardt, Kim, Mayer, Stierhof, Hwang and Jurgens2013). Five AP complexes, AP-1, AP-2, AP-3 AP-4 and AP-5, are described in various eukaryotic organisms (Kansup et al., Reference Kansup, Tsugama, Liu and Takano2013; Park et al., Reference Park, Song, Reichardt, Kim, Mayer, Stierhof, Hwang and Jurgens2013). AP complexes are heterotetrameric, comprising two large subunits (α/γ/δ/e and β), one medium subunit (μ) and one small subunit (σ). Large subunits α/γ/δ/e mediate membrane recruitment (Boehm and Onifacino, Reference Boehm and Onifacino2001). APs were recorded to be responsible for distinctive processes in different plant species. AP-2 was found to be slightly affected by heavy metals stress in the hyperaccumulating ecotype of Sedum alfredii (Demidenko et al., Reference Demidenko, Logacheva and Penin2011), while it was found to be crucial for floral organ development in Arabidopsis (Yamaoka et al., Reference Yamaoka, Shimono, Shirakawa, Fukao, Kawase, Hatsugai, Tamura, Shimada and Hara-Nishimura2013). AP-3 was found to interact with G-proteins, which modulate hormonal and stress responses in plants (Kansup et al., Reference Kansup, Tsugama, Liu and Takano2013). On the other hand, nothing was recorded for plant AP-4 protein. Nonetheless, our data revealed for the first time a significant induction of OeAP-4 in response to salinity stress (Fig. 6(f)). In humans, AP-4 mediates TGN to endosome transport of specific cargo proteins, such as amyloid precursor protein, which is involved in basolateral sorting in polarized cells (Hirst et al., Reference Hirst, Irving and Borner2013).
Plant WRKY transcription factors are involved in the regulation of various physiological plant activities such as pathogen defence, senescence, trichome development and the biosynthesis of secondary metabolites (Rushton et al., Reference Rushton, Somssich, Ringler and Shen2010; Zhu et al., Reference Zhu, Liu, Meng, Qin, Kong and Xia2013). WRKY transcription factors along with other several protein partners such as MAP kinases, 14-3-3 proteins, calmodulin, histone deacetylases and resistance proteins are involved in interactions related to the mechanisms of signalling and transcriptional regulation. They are characterized by the WRKY domain, a 60 amino acid region, which has the conserved sequence WRKYGQK at the N-terminus and a zinc-finger-like motif. The WRKY domain can be found in one or two copies, while the zinc-finger can have either Cx4-5Cx22-23HxH or Cx7Cx23HxC structure. WRKY transcription factors were divided into three groups based on the number of WRKY domains (two domains in Group I and one in the others) and the structure of their zinc fingers (C2HC in Group III) (Rushton et al., Reference Rushton, Somssich, Ringler and Shen2010). Transcripts of plant WRKY genes were shown to be enhanced by multiple abiotic stresses, e.g. salt, drought and heat (Chen et al., Reference Chen, Song, Li, Zhang, Zou and Yu2012a). Moreover, over-expression of wheat (Qin et al., Reference Qin, Tian, Han and Yang2013) and maize WRKY transcription factors (Li et al., Reference Li, Gao, Xu, Dai, Deng and Chen2013) were shown to enhance salinity tolerance in transformed Arabidopsis thaliana plants.
In addition to the herein described salinity-responsive OeWRKY1, another family member called OeWRKY5 (Genbank accession JK755716) was found to be induced by Pseudomonas fluorescens in olive roots (Schiliro et al., Reference Schiliro, Ferrara, Nigro and Mercado-Blanco2012). However, they were found to be divergent, showing a limited similarity level (36%). When blasting the two paralogues, OeWRKY1 was found to be similar to WRKY2 (Vitis vinifera), WRKY3 (Morus notabilis) and WRKY4 (Solanum tuberosum), while OeWRKY5 protein was found to be similar to WRKY48 (Glycine max), WRKY50 (Jatropha curcas) and WRKY65 (V. vinifera). Usually, members of one gene family are numbered based on their chromosome order, e.g. 52 cucumber WRKY genes were named CsWRKY1 to CsWRKY52 (Ling et al., Reference Ling, Jiang, Zhang, Yu, Mao, Gu, Huang and Xie2011). However, the olive genome is still being processed and not completely annotated yet, rendering the olive gene numbering issue unsolved for a while.
Intracellular K+/Na+ homeostasis is crucial for cell metabolism and is considered to be a key component of salinity tolerance in plants. To maintain an optimal intracellular K+/Na+ ratio under saline conditions, accumulation of excessive amounts of Na+ in the cytosol should be prevented, while retaining a vital physiological K+ level in the cytosol (Rodriguez-Navarro and Rubio, Reference Rodriguez-Navarro and Rubio2006; Chen et al., Reference Chen, Pottosin, Cuin, Fuglsang, Tester, Jha, Zepeda-Jazo, Zhou, Palmgren, Newman and Shabala2007). In an investigation of salt-tolerant barley genotypes, several mechanisms were illustrated to withstand the stress, which included the control of membrane voltage and intrinsically higher H+ pump activity (Chen et al., Reference Chen, Pottosin, Cuin, Fuglsang, Tester, Jha, Zepeda-Jazo, Zhou, Palmgren, Newman and Shabala2007). In Arabidposis thaliana, AtHAK5 transporter and AtAKT1 channel have been shown to be the main transport proteins involved in response to salinity stress (Nieves-Cordones et al., Reference Nieves-Cordones, Aleman, Martinez and Rubio2010).
Investigating abiotic stresses requires a comprehensive set of field experiments to integrate possible influential environmental factors such as light intensity and soil composition. Nonetheless, controlled in vitro environments can deliver primary insights on plant responses under abiotic stresses (Cardenas-Avila et al., Reference Cardenas-Avila, Verde-Star, Maiti, Foroughbakhch-P, Gamez-Gonzalez, Martinez-Lozano, Nunez-Gonzalez, Diaz, Hernandez-Pinero and Morales-Vallarta2006; Bidabadi et al., Reference Bidabadi, Mahmood, Baninasab and Ghobadi2012). This was achieved for two olive cultivars that diverge in their response to salinity. The olive cultivars ‘Picual’ and ‘Nabali’ were classified based on overall physiological and growth evaluations as tolerant and moderately tolerant, respectively (Chartzoulakis, Reference Chartzoulakis2005). Recent studies revealed a huge divergence between olive cultivars grown around the Mediterranean (Ateyyeh and Sadder, Reference Ateyyeh and Sadder2006; Haddad et al., Reference Haddad, Migdadi, Brake, Ayoub, Obeidat, Abusini, Aburumman, Al-Shagour, Al-Anasweh and Sadder2021). Differential gene expression data reveal a concentration level-dependent behaviour (Fig. 6). However, multiple SRBs were found to be more prominent in ‘Nabali’; nonetheless, ‘Picual’ showed significant up-regulation in SRB expression at higher salinity stress levels. Therefore, olive SRBs correspond to a more dynamic response mechanism. Their expression is highly dependent on stress level and the interacting genotype. Likewise, a recent study investigating another group of SRBs in two other olive cultivars, ‘Koroneiki’ and ‘Royal’, showed, likewise, that expression is dependent on the interaction between stress level and genotype (Mousavi et al., Reference Mousavi, Regni, Bocchini, Mariotti, Cultrera, Mancuso, Googlani, Chakerolhosseini, Guerrero, Albertini, Baldoni and Proietti2019). Additional high hierarchy regulatory factors are also influential in salinity stress. Such factors as JERF and bZIP were identified in another salt-tolerant olive cultivar ‘Kalamon’ (Bazakos et al., Reference Bazakos, Manioudaki, Therios, Voyiatzis, Kafetzopoulos, Awada and Kalaitzis2012). A holistic overview of related networks is needed for each putative novel SRB such as AP-4, for which only limited research is available in plants.
On the other hand, while our photosynthesis data showed no significant difference between different salinity stress levels (Fig. 5), recent reports revealed that there is (Mousavi et al., Reference Mousavi, Regni, Bocchini, Mariotti, Cultrera, Mancuso, Googlani, Chakerolhosseini, Guerrero, Albertini, Baldoni and Proietti2019; Regni et al., Reference Regni, Del Pino, Mousavi, Palmerini, Baldoni, Mariotti, Mairech, Gardi, D'Amato and Proietti2019; Moula et al., Reference Moula, Boussadia, Koubouris, Hassine, Boussetta, Van Labeke and Braham2020). This could be due to the nature of conducted experiments in which 1, 1/2 and 2 years old olive plants were exposed to salinity stress for 56, 43 and 240 days, respectively, as compared to 1 week in our case. In addition, all three experiments utilized a higher NaCl stress level, up to 200 mM, while we used a lower level, up to 150 mM. While the main dissimilarity relies on investigating different olive cultivars. Consequently, it is important to compare all experimental conditions to elucidate valid conclusions when discussing salinity tolerance.
Dynamic sets of SRBs were characterized in several plant species, such as tomato (Sadder et al., Reference Sadder, Alsadon and Wahb-Allah2014) and common fig (Sadder et al., Reference Sadder, Alshomali, Ateyyeh and Musallam2021), where some SRBs were also found to be correlated to important yield traits (Alsadon et al., Reference Alsadon, Ibrahim, Wahb-Allah, Ali and Sadder2015). Likewise, salinity tolerance in olive is coordinated at the molecular level by multiple defence layers of responsive genes, which are differentially expressed in accordance with genotypes and levels of applied stress.
Supplementary material
The supplementary material for this article can be found at https://doi.org/10.1017/S1479262121000174.
Acknowledgements
The authors would like to thank the University of Jordan and King Saud University for their support to conduct this study.



