Introduction
From a control theory point of view, site-specific management of mineral fertilizers and other agricultural inputs follows a two-level control scheme. Understanding the spatial heterogeneity of crop growing conditions within a specific management unit (i.e., agricultural field) allows for application rates of agricultural inputs to be matched with local needs within the acceptable range (Adamchuck et al., Reference Adamchuck, Morgan and Lowenberg-Deboer2004; Anselin et al., Reference Anselin, Bongiovanni and Lowenberg-DeBoer2004; Griffin et al., Reference Griffin, Dobbins, Vyn, Florax and Lowenberg-DeBoer2008; Holland and Schepers, Reference Holland and Schepers2010; Tremblay et al., Reference Tremblay, Bouroubi, Panneton, Guillaume, Vigneault and Bélec2010). This constitutes lower-level control. Higher-level control requires the determination of this range based on past management, weather including prior, current and forecasts, commodity prices, cost and accessibility of input material, risk preference, etc. At both control levels, the uncertainty of spatial and temporal information can be a major impediment to good decision outcomes (McBratney et al., Reference McBratney, Whelan and Shatar1997). This paper presents a framework for the implementation of high-level control, conceptualized as a decision support system (DSS) that takes into account spatial, temporal and managerial factors in assessing the potential impact of crop fertilization (or the use of other amendments) on the bottom line of a given production scenario, in the context of uncertain information (Bachmaier, Reference Bachmaier2012). The concept is illustrated using nitrogen fertilization for corn production in Eastern Canada.
Materials and Methods
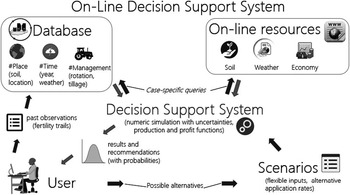
A prototype DSS under development (Figure 1) consists of several key components: 1) a user interface, 2) a database, 3) access to public on-line resources, and 4) a numeric simulation engine. The DSS supports users in determining the most profitable fertilization scenario and/or scenario with the lowest expected risk of mismanagement penalties. Nitrogen application for corn in Eastern Canada is used to illustrate the initial structure of this DSS. This means that the system seeks to maximize the net return of the cost of nitrogen fertilization (NRCNF).
Architecture of the proposed decision support system.

Through a mobile interface, the user specifies possible fertilization alternatives with respect to his/her specific crop growth environment, such as soil properties and management practices. These constitute the basic inputs used to construct alternative management scenarios. Complementary input values, such as weather and prices, as well as any additional data that could compensate for missing or limited information (e.g., public soil data), will eventually be retrieved from on-line sources. At the same time, previous observations pertaining to recorded trials will be entered in the database when available (Griffin et al., Reference Griffin, Dobbins, Vyn, Florax and Lowenberg-DeBoer2008). The database, currently implemented in PostgreSQL V 9.6.0, already includes 320 records of yield data resulting from an extensive meta-analysis study (Tremblay et al., Reference Tremblay, Bouroubi, Bélec, Mullen, Kitchen and Thomason2012). Each record is specific to a site and a year and includes corn yield estimates matched to different nitrogen application rates as well as weather data, soil conditions, and management practices.
The heart of the DSS is composed of a record retrieval mechanism, an expected production function composer and an engine for the numeric computation of profits. The function of the record retrieval is to identify production records that are ‘similar’ in terms of context to the specific one defined by the user. As part of the specifications for development of the DSS, the retrieval of similar records has to be possible even in the absence of certain input information. In the current version of the prototype, records can be retrieved with SQL statements, based on soil texture, rain amount data class (i.e., 0–50 mm, 50–100 mm and 100+ mm) based on the concept of abundant and well distributed rainfall (AWDR) proposed by Tremblay et al. (Reference Tremblay, Bouroubi, Bélec, Mullen, Kitchen and Thomason2012) as well as tillage practices (i.e., till or no-till) and N contribution of preceding cultivar (e.g., weak, medium, strong).
Although the decision support system is able to accommodate different production function models, in the current version, the production function was modeled using a quadratic-plateau (QP) approach, which is known to be a good fit with biological response (Bullock and Bullock, Reference Bullock and Bullock1994; Bongiovanni and Lowenberg-DeBoer, Reference Bongiovanni and Lowenberg-DeBoer2000; Adamchuck, Reference Adamchuck2013). Thus, yield response to nitrogen fertilization was defined as:
 $$Y{\,\equals\,}\left\{ {\matrix{ {a_{0} {\plus}a_{1} N{\plus}a_{2} N^{2} } & {for} & {N\,\lt\,N&_{{Y\max }} } \cr {a_{0} {\plus}a_{1} N_{{Y\max }} {\plus}a_{2} N_{{Y\max }}^{2} } & {for} & {N\geq N& _{{Y\max }} } \cr } } \right.$$
where Y is the crop yield (t ha−1), N is the specified fertilizer application rate (kg ha−1), N Ymax is the minimum fertilizer application rate resulting in the maximum yield, and a0, a1 and a2 are the coefficients of a second-order polynomial representation of yield response to N application rates below N Ymax .
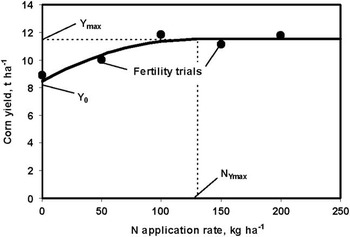
As shown in Figure 2, to define this production function in terms of yield response to fertilization from Y 0 (yield with no fertilization) to Y max (maximum achievable yield), the coefficients of the second-order polynomial can be rewritten as:
 $$a_{0} {\,\equals\,}Y_{0} $$
 $$a_{1} {\,\equals\,}{{2\left( {Y_{{\max }} {\minus}Y_{0} } \right)} \over {N_{{Y\max }} }}$$
 $$a_{2} {\,\equals\,}{{Y_{0} {\minus}Y_{{\max }} } \over {N_{{Y\max }}^{2} }}$$
Example of a quadratic-plateau yield response model.

In its simple form, the objective function NRCNF ($ ha−1) can be defined using linear cost structure according to:
 $$NRCNF{\,\equals\,}Y \!\cdot \!c_{Y} {\minus}N\! \cdot\! c_{N} $$
where c Y is the price of harvested crop ($ t−1) and c N is the cost of fertilization ($ kg−1).
The piecewise model described by equation (1) can be fitted using non-linear procedures like nlin in SAS (Tumusiime et al., Reference Tumusiime, Brorsen, Mosali, Johnson, Locke and Biermacher2011) or nls in R (Rossiter, Reference Rossiter2016). However, with these procedures, convergence is not always guaranteed, and a brute-force numerical approach constitutes an appealing alternative since it always leads to a best-fit model. This is computationally intensive and the approach that follows was used to accelerate the development of the current version of the DSS prototype. Parameters Y 0 , Y max and N Ymax were first calculated in R using a brute-force approach for each fertility trial observation. Then, the probability distribution of each of these parameters for a given subset of observations has been used as the input for the numeric simulation. In this case, the discrepancies between the model parameter estimates have been treated as DSS input uncertainties. Similarly, costs c Y and c N were assumed to be uncertain and based on historical data and/or economic forecasts.
As a result, the NRCNF was calculated for every potential N rate and every potential combination of values Y 0 , Y max , N Ymax , c Y and c N . Assuming partial independence among these five inputs and estimated level of probability for each input value, the following equation has been used to calculate the expected NRCNF:
 $$NRCNF_{{est}} {\,\equals\,}\mathop{\sum}\limits_{i{\,\equals\,}1}^N {\left( {NRCNF_{i} \cdot p\left( {NRCNF_{i} } \right)} \right)} $$
where N is the total number of combinations of discrete values of Y 0 , Y max , N Ymax , c Y and c N . The individual NRCNF i and its probability p(NRCNF i ) have been calculated using:
 $$NRCNF_{i} {\,\equals\,}Y\left( {Y_{{0i}} ,Y_{{\max i}} ,N_{{Y\max i}} ,N} \right) \cdot c_{{Yi}} {\minus}N \cdot c_{{N_{i} }} $$
 $$\eqalignno{p\left( {NRCNF_{i} } \right){\,\equals\,} p\left( {Y_{{0i}} } \right) \cdot p\left( {Y_{{{\rm max}i}} } \right) \cdot p\left( {N_{{Y{\rm max}i}} } \right) \cdot p\left( {c_{{Yi}} } \right) \cr \!\!\cdot p\left( {c_{{Ni}} } \right)$$
where Y(Y 0i , Y maxi , N Ymaxi , N) is the yield function derived by combining equations (1) through (4), and p(Y 0i ), p(Y maxi ), p(N Ymaxi ), p(c Yi ) and p(c Ni ) are the probabilities of each individual value of model parameter. Naturally, it should be noted that:
 $$\mathop{\sum}\limits_{i{\equals}1}^N {p\left( {NRCNF_{i} } \right){\,\equals\,}1} $$
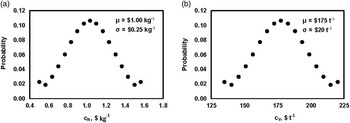
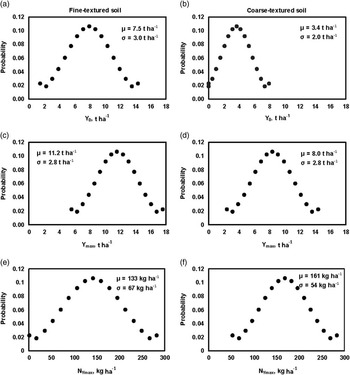
To illustrate DSS performance, a set of input parameter distributions have been arbitrarily selected using the initial database and cost estimates. While assuming a normal distribution of input parameters, Figure 3 illustrates the probabilities associated with 17 different discrete values of c Y and c N . Similarly, yield response parameters (Y 0 , Y max , N Ymax ) were estimated using two distinct groups of fertility trials (fine-textured soil and coarse-textured soil) with relatively high levels of uncertainty. Figure 4 shows the probabilities associated with 17 different discrete values of each parameter for both types of soil conditions. With 17 values (15 intervals plus two distribution tails) for each of the five input variables, the total of N=1 419,857 input combinations were calculated for every possible N application rate (from 0 to 200 kg ha−1 with 10 kg ha−1 increment). The always positive parameter Y 0 was constrained to be less then or equal to Y max and the range for N Ymax was restricted between 0 and 300 kg ha−1.
Distributions of the price of yield (a) and cost of fertilization (b) model inputs.

Distributions of zero fertilization yield (a and b), maximum yield (c and d) and minimum N application rate to achieve maximum yield (e and d) for fine-textured (a, c, and e) and coarse-textured (b, d, and f) soil production scenarios.

The summary of probabilities associated with every possible value of NRCNF at any given application rate constitutes the basis for the model output. Report of NRCNFest for every application rate is a traditional way to determine optimum application rates. However, to assess the risk affiliated with different management scenarios, one can analyze the probability of profit being above a certain threshold and select the rate that is related to the anticipated profit with an acceptable level of probability.
Results and discussion
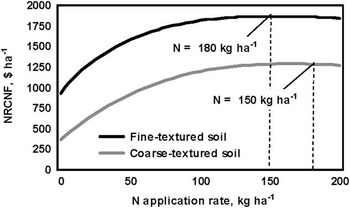
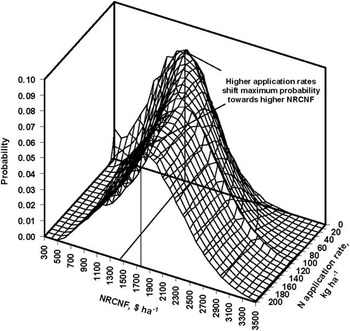
Based on the numeric simulation model parameters shown in Figures 3 and 4, the estimated NRCNF (NRCNF est ) is shown in Figure 5. Apparently, N=150 kg ha−1 and N=180 kg ha−1 were found to be the most profitable for fine- and coarse-textured soil, respectively. However, Figure 6 illustrates the probability for every combination of NRCNF and N application rate.
Expected NRCNF for two different soil conditions.

NRCNF probability for an array of possible application rates and a specific management scenario.

Apparently, according to Figure 6, higher application rates tend to increase NRCNF estimates with more uncertainty as compared to low application rates, when relatively low expected NRCNF is certain. Figure 7 interprets these NRCNF probability distributions in terms of probabilities to achieve a specific level of NRCNF. Thus, a relatively moderate rate of 100 kg ha−1 will result in NRCNF $2000 ha−1 in approximately one out of three cases in the fine-textured soil. However, similar certainty to realize only $1500 ha−1 NRCNF can be achieved with about 150 kg ha−1 application rate when managing coarse-textured soil.
Probabilities of classes of profits for fine and coarse texture soils.

As one would imagine, these examples illustrate results for very uncertain scenarios and more definite answers are expected once the model inputs are more accurately defined. As with many agricultural inputs, nitrogen fertilization has an asymmetrical negative impact on profit for applying higher and lower application rates than the estimated optimum. Under uncertain conditions and the current level of cost parameters, the probability of NRCNF reduction is higher when a lower than optimum nitrogen application rate is accepted and vice versa; the probability of severe economic loss for over-application is rather small.
Conclusion
The proposed decision support system enables the determination of the optimum average application rate that maximizes expected profits (net return over cost of fertilization) or to define the range of such rates for a case of variable rate application. Uncertainty-based treatment of each model input and dynamic data exchange with the underlying production function database constitute the unique features of this algorithm. Its implementation has the potential to provide a balance between expected profit losses from potential under-application and over-application errors when it comes to the economics of modern crop production systems.
Acknowledgements
This research was supported in part through Agriculture and Agri-Food Canada and Fertilizer Canada Agri-Innovation Program ‘A Canadian Research Network to Improve 4R Nutrient Stewardship for Environmental Health and Crop Production.’