Introduction
Forage halophytes such as saltbush (Atriplex spp.) are being widely used to revegetate Australian saline land and can also provide a low- to medium-quality fodder source (Masters et al., Reference Masters, Norman and Dynes2001). There is widespread anecdotal evidence from Australian pastoralists that sheep grazing on saltbush per se are leaner, tastier and juicer. Hopkins and Nicholson (Reference Hopkins and Nicholson1999) investigated the effect of ingesting saltbush and oats, saltbush and lucerne hay or lucerne on the carcass and eating quality of sheepmeat. The only significant finding was an increase in aroma strength from sheep grazed on the saltbush and lucerne treatment and no change to carcass quality. The study was conducted on saltbush grown on non-saline marginal land (D. L. Hopkins, personal communication) and its relevance to a saline land system is not known. Furthermore, a comparison with lucerne may be inconclusive as lucerne alone has been shown to affect the sensory properties of sheepmeat (Park et al., Reference Park, Corbett and Furnival1972). Nawaz et al. (1992) also examined the effect of feeding saltbush collected from non-saline land and/or sorgum (Sorghum bicolor) on eating quality and also found no differences between the treatment groups.
Previous studies indicate that there is potential to utilise saline-land saltbush to produce leaner carcasses. Walker et al. (Reference Walker, Potter and Jones1971) and Kraidees et al. (Reference Kraidees, Abouheif, Al-Saiady, Tag-Eldin and Metwally1998) have shown that the ingestion of a high salt load from the consumption of either halophytes or saline water reduces the fat content of the carcass. It seems likely that a similar effect on carcass composition will be observed in sheep grazing saltbush. Walker et al. (Reference Walker, Potter and Jones1971) also observed that the consumption of water that is high in salt resulted in less saturated fat in the fat depots and speculated that this was the result of less biohydrogenation of fat in the rumen due to the high water intake that occurs in sheep fed the high-salt diets.
A number of studies have demonstrated that ingesting saltbush alone does not result in high growth rates in sheep and without supplementation may only be suitable as a maintenance feed only (Wilson, Reference Wilson1966; Weston et al., Reference Weston, Hogan and Hemsley1970; Arieli et al., Reference Arieli, Naim, Benjamin and Pasternak1989; Correal et al., 1990; Warren et al., Reference Warren, Bunny and Bryant1990; Morecombe et al., 1991; Chriyaa et al., Reference Chriyaa, Moore and Waller1997). Therefore, the use of saltbush with a suitable energy supply such as barley may be a strategy to elicit live-weight gain with the potential to produce acceptable carcass weights. Chriyaa et al. (Reference Chriyaa, Moore and Waller1997) and Franklin-McEvoy (2002) showed that a 60 : 40 saltbush and barley combination enabled over 60 g/day live-weight gain.
The aim of this research was to investigate the effects of ingesting saltbush from saline land in combination with a barley supplement on carcass and eating quality. This experiment was conducted in an animal house environment to allow controlled measurement of the hormonal responses and feed intake.
Material and methods
Animal management
Twenty-six 14-month-old Merino hogget wethers (initial live weight 38.8 ± 0.28 kg) were individually penned in an animal house for 13 weeks. Each sheep was weighed weekly prior to daily feeding to calculate live-weight gain. Live-weight gain was calculated as the slope of the live-weight change over the period of the experiment using the regression function in Excel (Microsoft Office 2003; Redmond, WA, USA). Prior to commencement this study was approved by the CSIRO Livestock Industries, Animal Ethics Committee.
Experimental diets
For the first 19 days (days −19 to −1), all sheep were fed a standard ration (20% lupins, 77% oaten hay, 3% Siromin© mineral mix (White et al., Reference White, Masters, Peter, Purser, Roe and Barnes1992)). For the following 10 weeks (days 0 to 69), the sheep were divided into two groups (n = 13 × 2 = 26) stratified for equal live weight and fed one of two diets: (1) old man saltbush (Atriplex nummularia) (60%) plus barley (40%) (S + B) or (2) lupin (33%), barley (25%) and oaten hay (42%) control diet (C). The saltbush (leaves and stems < 2 mm) was collected manually from a site near Tammin, 200 km east of Perth, Western Australia, and dried for 3 days at 45°C. The ingredients in each of the two diets were mixed together into a loose ration. Mixing was conducted using a commercial feed mixer (PressMatic Feed Mixer; Parkes Industries, USA). The hay was hammer milled using a 1.5-inch-size sieve and the saltbush was mulched using a commercial mulcher (Caravaggi BIO 200 chipper/shredder; Parklands Trading, Riverwood, NSW, Australia) prior to feed mixing. Mulching of the saltbush was done to ensure a homogenous distribution in the feed of stem and leaf matter. This was aimed to reduce the potential for selection in the diet and also attempt to ensure equal energy, protein and sodium intake between the sheep fed the saltbush barley ration. The dry matter (DM) offered was 1.16 and 0.96 kg/day and organic matter (OM) offered was 1.00 and 0.9 kg/day for the S + B and C diets, respectively. From the estimated metabolisable energy (ME) levels of the two diets, the intakes were expected to support growth rates of 60 g/day.
The animals were fed once a day at approximately 0900 h. Feed intake was measured on individual sheep for days 0 to 69. Feed residues were weighed daily and feed samples collected weekly. Both residues and feed samples were dried at 75°C for 3 days to allow calculation of DM and OM intake for each sheep. All residues were bulked weekly. The sheep were allowed free access to fresh tap water from nipple drinkers.
Feed intake and digestibility
From days 21 to 27, seven randomly chosen sheep per treatment group were placed into individual metabolism crates and fitted with faecal collection harnesses. Faeces were collected from days 23 to 27. Faeces were collected daily, weighed and approximately 10% subsampled and dried in the oven at 65°C overnight. The dried faeces were bulked over the 4-day period for each sheep. Any feed residues were weighed and bulked over the 4 days. A subsample of each of the diets was also collected daily and bulked. Water intake was measured for individual sheep from days 24 to 27. Bulked subsamples of feed, feed residues and faeces (approximately 1 kg each) were subsequently ground and DM and OM determined. The grinding procedure involved samples being passed through a 1-mm screen using a Cyclone Mill (Tecator, Inc., Boulder, CO, USA). To determine DM, previously ground feed and faecal samples (approximately 2 g) were weighed into pre-weighed and pre-dried (overnight at 100°C) ceramic crucibles and dried to a constant weight for approximately 48 h in a fan-forced oven at 60°C. Samples were removed, cooled in a desiccator and then reweighed. DM was calculated as follows:

OM and total and soluble ash were determined on samples as described by the Association of Official Analytical Chemists (AOAC) (2005). Dry matter digestibility (DMD), organic matter digestibility (OMD), digestible organic matter intake (DOMI), digestible organic matter in the dry matter (DOMD) and ME were calculated by standard methodology (Standing Committee on Agriculture, 1990). Calculations used were as follows:

Feed nutritive value and mineral content
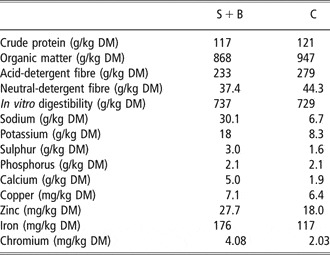
The nutritive value was analysed using methods detailed in Norman et al. (Reference Norman, Freind, Masters, Rintoul and Dynes2004) (Table 1). Nitrogen, sodium and other minerals were determined in a commercial laboratory (CSBP Soil and Plant Laboratory, Bibra Lake, WA, Australia) using the standard operating methods for the Thermo Iris Intrepid Duo ICP (X series ICP-MS, Thermo Electron Cooperation, Waltham, MA, USA). Feed was digested by the method of McQuaker et al. (Reference McQuaker, Brown and Klucker1979) prior to the analysis for nitrogen, sodium, chromium and other minerals. Chromium analysis was done in a separate commercial laboratory (CSIRO Analytical Services) using the atomic absorption spectrometer method of Cary and Allaway (Reference Cary and Allaway1971).
Nutritive value and mineral content of saltbush and barley (S + B) or control (C) diets

DM = dry matter.
Blood sampling
A 40-ml blood sample was collected by jugular venipuncture from each animal on days 15, 38 and 59. Samples for leptin, thyroxin (T4) and tri-iodothyronine (T3) were collected in heparinised tubes whereas samples for insulin-like growth factor (IGF) analysis were collected in EDTA (ethylene diamine tetra-acetic acid) tubes. All tubes were placed on ice immediately and centrifuged at 3000 r.p.m. within 30 min of collection, plasma was decanted and stored at −20°C until analysis.
Additional blood samples (20 ml) were collected on day 59 through a jugular catheter into heparinised tubes. Samples were taken every 20 min for 6 h and 20 min. All tubes were placed on ice and centrifuged at 3000 r.p.m. within 30 min of collection, plasma was decanted and stored at −20 °C until analysis. Samples taken every 20 min were assayed for growth hormone (GH). Samples taken at hourly intervals for the first 6 h were assayed for insulin and cortisol.
The determination of body water content was conducted on day 59. Blood (10 ml) was collected from each sheep prior to an injection with approximately 5 g of deuterium oxide (2H2O, 99.9 atom%; Sigma-Aldrich Corporation, St Louis, MO, USA) at 0800 h. All syringes were weighed before and after injection to determine the exact amount injected. The sheep were bled a second time after equilibration of the deuterium oxide with the body water pool (approximately 6 h). In this experiment, the aim was to determine the additional amount of water retained by sheep fed high-salt diets. For this reason, fasting the sheep overnight would have given an inaccurate indication of the proportion of live weight attributable to water retention in grazing sheep. The sheep were allowed access to feed and water up to the time of deuterium oxide injection but not during the period of equilibration. The sheep were fed following the collection of second blood sample.
Slaughter and dissection procedures
At 1100 h on day 69, all sheep were weighed and then loaded onto a truck and transported to a commercial abattoir 200 km from the experimental site. They were held in the lairage yards for 24 h before being slaughtered at 1100 h on day 71. While in lairage all sheep had access to water in a trough but no access to feed.
Sheep were head stunned prior to exsanguination using a Thornton stunner handset model 1 (Cat no. T05202, Thornton Engineering group, Auckland, New Zealand). Within 20 min of slaughter, all carcasses were electrically stimulated by a high-voltage electrical stimulation tunnel for 60 s, peak voltage 1000 V, 15 Hz. Immediately following slaughter all carcasses were weighed to determine hot carcass weight (HCW). GR fat depth (total tissue depth over the 12th rib 110 mm from the midline) was measured approximately 3 h post-slaughter. All carcasses were held in the same 5°C chiller for 24 h.
Within an hour of slaughter, samples of both m. semimembranosus (SM) and m. semitendinosus (ST) muscles were collected for glycogen analysis. These samples were snap frozen in liquid nitrogen, after having all fat tissue removed, and stored in −40°C. A 100 g sample of the subcutaneous fat from over the top of the SM and ST muscles was taken and also frozen in liquid nitrogen. The samples were analysed for fatty acids. The entire m. longissimus thoracis et lumborum (LL) muscle from the lumbar–sacral joint to as close the cranial end as possible was removed 24 h after slaughter. The LL was cut in half and the sample closest to the head (~250 g sample) was allocated for fatty acid analysis, vacuum sealed and immediately frozen at −20°C. The other half, which was closest to the hind running from the lumbar–sacral joint to roughly the 12th rib of the carcass, was immediately vacuum packed (also ~250 g sample). This sample was then kept in a 2°C chiller for 5 days before being frozen at −20°C prior to sensory analysis. A 2-g sample of the LL was also taken at slaughter for DM determination.
At 24 h after slaughter, ultimate pH, temperature and colour were determined. Colour was determined by first slicing across the fibres at the end of the LL adjacent to the first lumbar vertebrae. The cut area was left exposed for 30 min at room temperature. Meat colour was measured using a Minolta Model CR-200 ChromaMeter set (Minolta Corporation, Ramsey, NJ, USA) on the L*, a*, b* system (where L* measures relative lightness, a* relative redness and b* relative yellowness). Temperature was determined using Cox recorders (Cox Technologies, Belmont, NC, USA) and probes were inserted into the centre of the LL. Measurements of muscle pH were taken using an Orion 250A pH meter (Cat. No. 0250A2; Orion Research Inc., Boston, MA, USA) with a glass body, spear-tipped probe (Cat. No. 8163BN; Orion Research Inc.), coupled with a temperature probe. A fresh incision to remove subcutaneous fat was made over the LL muscle tissue at the lumbar–sacral joint, into which the pH probe was inserted. The pH meter was calibrated with standard solution and kept at the same temperature as the carcasses.
Analyses
Hormones
Analysis for GH was by the method of Adams et al. (Reference Adams, Briegel, Rigby, Saunders and Hoskinson1996). All samples were measured in a single assay. The intra-assay coefficient of variation (CV) for the four pools averaging 3.3, 5.2, 9.3 and 15.6 ng/ml were 0.4, 0.32, 0.5 and 0.9, respectively. The initial percentage of binding sites (Bo) was 34%, the non-specific binding (NSB) was 6.5%, the minimal detectable concentration was 0.7 ng/ml and the 50% maximal displacement on the standard curve (ED50) was 5.3 ng/ml.
Insulin concentrations in the plasma were analysed using the method of Adams et al. (Reference Adams, Briegel, Rigby, Saunders and Hoskinson1996). All samples were measured in a single assay. The intra-assay CV for the four pools averaging 0.1, 0.5, 1.4 and 3.5 ng/ml were 0.03, 0.04, 0.07 and 0.16, respectively. The Bo was 29%, the NSB was 1.9%, the minimal detectable concentration was 0.09 ng/ml and the ED50 was 0.83 ng/ml.
IGF was analysed using the methods of Breier (Reference Breier1999). All samples were measured in a single assay. The intra-assay CV for the three pools averaging 0.63, 0.96 and 3.8 ng/ml were 0.14, 0.01 and 0.42, respectively. The Bo was 47%, the NSB was 3.6%, the minimal detectable concentration was 0.08 ng/ml and the ED50 was 3.84 ng/ml.
Plasma cortisol were analysed using the method of Atkinson and Adams (Reference Atkinson and Adams1988). All samples were measured in a single assay. The intra-assay CV for the three pools averaging 1.65, 2.7 and 4.0 ng/ml were 0.34, 0.52 and 0.8, respectively. The Bo was 33%, the NSB was 1.3%, the minimal detectable concentration was 0.08 ng/ml and ED50 was 0.5 ng/ml.
Plasma leptin concentrations were analysed using the method of Blache et al. (Reference Blache, Tellam, Chagas, Blackberry, Vercoe and Martin2000). Plasma T4 and T3 were analysed using the methods of Zhang et al. (Reference Zhang, Blache, Blackberry and Martin2005).
Plasma sodium, potassium, lactate, albumin, creatinine and urea concentration
The sodium and potassium concentration in the plasma was analysed using the standard operating methods for the atomic absorption spectrophotometer (SpectrAA-30/40, Varian Techtron Pty Ltd, Mulgrave, VIC, Australia). Creatinine, urea, albumin and lactate in the plasma, serum or urine were all analysed on a Cobas Mira (F. Hoffmann-La Roche, Basel, Switzerland) according to the standard operating procedures. All were analysed using Sigma Infinity Cobas Mira kits (Sigma-Aldrich, Sydney, Australia).
Deuterated water for total body water content
Total body water determination using deuterated water was analysed and prepared following the method described by Liu (Reference Liu2002). The analyses were carried out on an HP 6890/5973 GC-MS system. Samples were analysed at 70 eV under chemical ionisation with methane as the reagent gas. The selected ions monitored were m/z 61 and 63. The calibration curve was obtained by a linear regression analysis of theoretical 2H-enrichment in standards (ranged from 50 to 250 p.p.m.) against measured m/z 63 : 61 ratios. Samples were injected in duplicates. The deuterium oxide enrichment was measured in 10 of the pre-injection samples (randomly selected) to provide a mean background and all of the post-injection blood samples to determine deuterated water space. Deuterated water space was converted to total body water using the equations from Searle (Reference Searle1970).
Muscle glycogen
Muscle glycogen concentration was analysed using the method of Chan and Exton (Reference Chan and Exton1976) modified by removing the filter paper step (Gardner et al., Reference Gardner, Pethick and Smith1998).
Fatty acid analysis of subcutaneous and intramuscular fat
The fatty acid composition of the subcutaneous and intramuscular fat was prepared and analysed using the methods of Folch et al. (Reference Folch, Lees and Sloane1957). The results are expressed as the percentage in the total. There were some fatty acids that could not be identified.
Carcass composition
Half of each carcass was cut further into thirds and scanned by a Hologic QDR 4500 Fan Beam X-ray Bone Densitometer (DXA) (Hologic Inc., Waltham, MA, USA) to estimate of the relative fat, lean and bone content of the carcass (Dunshea et al., Reference Dunshea, Suster, Eason, Warner, Hopkins and Ponnampalam2008). Calibration of the unit was performed with the Step Phantom (supplied by Hologic Inc., Bedford, MA, USA) once every week. The data from the Step Phantom calibration scan were automatically stored on the hard drive, and used during the whole-body analysis, to ensure accurate fat/lean composition results. Spine calibration scans, using Spine Phantom (supplied by Hologic Inc.) were performed daily to minimise baseline drift and ensure accurate bone mineral content measurement. Measurements made by DXA included total tissue mass (TTM), lean tissue mass (LTM), fat tissue mass (FTM) and bone mineral mass (BMM) in grams. The whole-body scan mode was used for all animals and scan times were ~2 min depending on the length of the carcass. Regional analysis was not performed in the DXA software, but for whole-carcass analysis, the entire DXA carcass image was placed in the left arm region of the regional grid. This analysis technique using a general human-based algorithm has been demonstrated to be well correlated with chemical lean, fat and bone (Dunshea et al., Reference Dunshea, Suster, Eason, Warner, Hopkins and Ponnampalam2008).
Sensory analysis
The sensory analysis in this experiment was assessed using an untrained consumer taste panel. The taste-panel methods were modified from Thompson et al. (Reference Thompson, Gee, Hopkins, Pethick, Baud and O’Halloran2005) and are further detailed in this paper. The cut of meat used was the LL muscle starting from the lumbar–sacral joint down to roughly the 12th rib. The length of this cut of meat allowed for six samples (4 cm long × 2.5 cm wide) to be cut from the 12th rib (narrowest) end with muscle fibres running longitudinally. Each of the six 4 × 2.5 cm samples was considered on an individual basis for allocation to a panellist.
There were 40 panellists in each sitting and each panellist participated in six runs. Each panellist was given one sample of cooked meat and asked to complete an assessment sheet. This process was repeated six times at each evaluation session. Therefore each panellist received six pieces of meat. The allocation of each individual sample to a panellist and run was a modified Latin-square design. Additional allocation rules included the following: (1) treatments were represented equally, i.e. there was an equal number of samples represented per treatment and an equal number of treatments in each run and (2) panellists sampled each treatment an equal number of times but not consecutively and samples were randomly allocated to panellist and run according to these constraints. This taste panel was conducted over one session.
The samples were thawed for 24 h at 4°C prior to cooking for presentation to panellists. All subcutaneous fat was removed. From each loin the six samples were cut from the 12th rib (narrowest) end with muscle fibres running longitudinally. These six samples from each loin were numbered 1 to 6 with 1 being the sample cut closest to the narrow end working up to 6. Samples were cooked on a well-oiled (olive oil) silex grill (Williams, 2000) for 2 min and 10 s at 180°C. Samples were presented on plastic plates immediately after cooking so that samples were warm when received by panellists. Between each sample apple juice and brown bread was offered to cleanse the palate.
Panellists were asked to assess each sample for a range of attributes on a continuous 150 mm scale. The lines were measured and converted to a score out of 10. In addition, each panellist was invited to comment about each sample. Mean scores for attributes are presented.
Statistical analyses
All statistical analyses were conducted using Systat (SPSS version 9.01; SPSS Inc., Chicago, IL, USA). Analysis of variance (ANOVA) was used to examine the effect of treatment on pre-slaughter live weight, live-weight gain, HCW, GR depth, ultimate pH, colour, fatty acids and muscle DM content, the effect of treatment on OMD and DMD, DOMI, DOMD, daily ME intake and sodium and water intake. The effect of treatment on fat, lean and bone content was assessed also using an ANOVA but HCW was used as a covariate.
To analyse the insulin and GH results, repeated measures analysis over the sampling period was conducted as well as comparison of individual sampling times using ANOVA. For IGF, urea and creatinine, a repeated measures analysis over the three sampling times was conducted as well as a comparison of individual time points.
A general linear model (GLM) procedure was used to analyse the sensory evaluation data. The GLM contained fixed effects for panellist, run, steak position (order from the 12th rib), treatment and animal number (tag) and first order interactions of diet × steak number, diet × run and diet × panelist. Non-significant interactions (P > 0.05) were sequentially removed from the model until the final model for each dependant was obtained. Least significant difference (LSD) values were used to compare treatment means.
Results
Live weight and live-weight gain
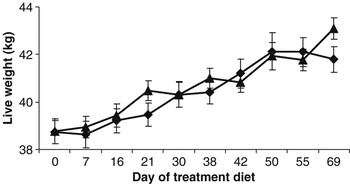
There was no significant difference in live weight between the two treatment groups at the start of the experiment (Figure 1). All groups increased in live weight over the experimental period and no difference in live-weight gain (both 62 ± 0.6 g/day) existed between the treatments (P > 0.01). However, there was a significant difference in live weight on day 69.
Live weight of sheep fed a saltbush and barley (S + B) or control (C) diet (▴ control, ♦ saltbush) (mean ± s.e.).

Digestibility
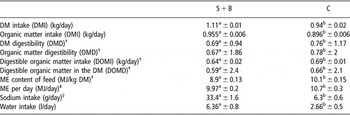
The sheep fed the C diet had a higher DOMI than those fed the S + B diet (Table 2). The ME intake per day was significantly lower in the S + B-fed sheep compared with the C diets. Daily sodium and water intake and sodium excretion were significantly different between treatment groups.
Digestibility of feed sources calculated during a 4-day digestibility study, feed intakes over a 10-week period, daily metabolisable energy content of the saltbush and barley (S + B) or control (C) diets and the sodium and water intake and excretion (mean ± s.e.)

DM = dry matter; ME = metabolisable energy.
a,bValues within rows with a different superscript are significantly different (P < 0.05).
†Calculated using the equation in Standing Committee on Agriculture (1990).
‡Calculated as the ME content of the feed multiplied by DM intake.
§Calculated as DM intake multiplied by sodium percentage in diet (Table 1).
Carcass quality
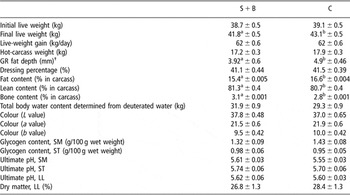
There was no significant difference between the treatments for HCW, GR depth or dressing percentage (P > 0.05) (Table 3). Sheep fed the S + B diet had significantly lower fat content than those fed the C diet and significantly higher lean and bone content. There was a trend for the S + B group to have higher total body water content compared with the sheep fed the C diet (P = 0.06).
Live-weight performance and carcass characteristics of sheep fed the saltbush and barley (S + B) or control (C) diets prior to slaughter (mean ± s.e.)

SM = m. semimembranosus; ST = m. semitendinosus; LL = m. longissimus thoracis et lumborum.
a,bValues within rows with a different superscript are significantly different (P < 0.05).
†GR fat depth=total tissue depth over the 12th rib, 110 mm from the midline.
There was no significant effect of diet on colour, glycogen content at slaughter LL, DM and ultimate pH (Table 3) (P > 0.05).
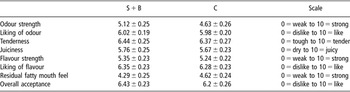
Sensory evaluation
Treatment had no significant effect on any of the eating-quality attributes (Table 4) (P > 0.1 for all attributes).
Sensory evaluation of meat from sheep fed a saltbush and barley (S + B) or control (C) diet prior to slaughter(mean ± s.e.)

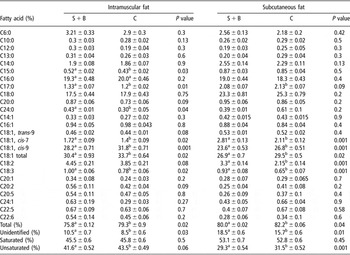
Fatty acids
The individual fatty acid composition of the intramuscular and subcutaneous fat deposits is described in Table 5. Differences existed between the treatments for individual fatty acids. There was a significant difference in the sum of unsaturated fatty acids (P < 0.004) between the treatments in both fat depots. The S + B sheep had a significantly lower overall unsaturated fatty acid content compared with the sheep fed the C treatment. No differences in the saturated fat content were observed between treatments. The percentage of unidentified fatty acids was significantly higher in the S + B fat compared with the C fat (P < 0.001) in both fat depots.
Individual fatty acid composition of the intramuscular and subcutaneous fat deposits in sheep fed a saltbush and barley (S + B) or control (C) diet prior to slaughter (mean ± s.e.)

a,bValues within rows with a different superscript are significantly different (P < 0.05).
Hormones and metabolites
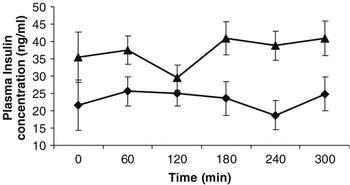
There was a significant effect of diet on plasma insulin concentration (P < 0.05) (Figure 2). The sheep fed the S + B diet had significantly lower plasma insulin concentration than sheep fed the C diet (P < 0.02). The average insulin concentration for the sheep fed the S + B diet was 23.2 ± 1.4 and 37.1 ± 2.0 ng/ml for the C group. Time of sampling had no effect on insulin concentration (P > 0.5). At the individual time points, the S + B sheep had significantly lower insulin in the plasma than the C treatment at 60 (P < 0.05), 80 (P < 0.02), 180 (P < 0.002) and 320 (P < 0.03) min.
The effect of diet on plasma insulin concentration for sheep fed either a saltbush and barley (S + B) or control (C) diet (▴ control, ♦ saltbush) (mean ± s.e.).

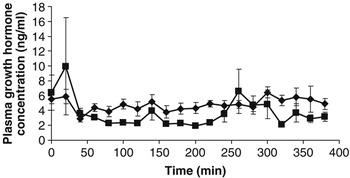
There was a significant difference in plasma GH concentration between treatments using a repeated measures analysis (P < 0.001) (Figure 3). There was also an effect of time (P < 0.05). The average concentration for sheep fed the S + B diet was 4.82 ± 0.18 and for those fed the C diet was 3.71 ± 0.3 ng/ml. There were significant differences between the S + B treatment and the C treatment at 60, 80, 120, 180, 220 and 320 min after the start of sampling.
The effect of diet on plasma growth hormone concentration saltbush and barley (S + B) or control (C) diet (▴ control, ♦ saltbush) (mean ± s.e.).

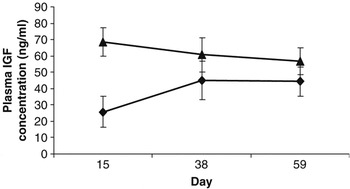
There was a significant effect of diet on IGF concentration (P = 0.04) using repeated measures analysis (Figure 4). The S + B sheep had lower overall concentration of IGF compared with the C treatment at all time points. There was no effect of sampling time on IGF secretion (P > 0.05).
The effect of diet on plasma insulin-like growth factor concentration saltbush and barley (S + B) or control (C) diet (▴ control, ♦ saltbush) (mean ± s.e.).

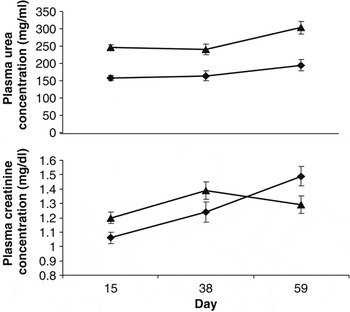
Treatment had a significant effect on plasma urea concentrations (P < 0.001) (Figure 5). The sheep fed the C treatment had significantly higher plasma urea concentrations than the S + B treatment at each time point. There was a significant effect of time on plasma urea (P < 0.001).
The effect of diet on plasma urea and creatinine concentration saltbush and barley (S + B) or control (C) diet (▴ control, ♦ saltbush) (mean ± s.e.).

Treatment had no overall significant effect on plasma creatinine concentration (P = 0.6) (Figure 5). There was a significant effect of time (P < 0.05) and a significant interaction between time and diet (P < 0.05).
There was no significant difference between treatments for cortisol, leptin, T3 and T4 and plasma sodium, potassium and lactate concentration (P > 0.01, not shown).
Discussion
Carcass quality
Carcass composition and growth
The ingestion of the S + B diet resulted in beneficial changes to carcass composition. The S + B-fed sheep had a significantly lower proportion of fat and lower GR depth and a higher proportion of lean compared with the sheep fed the C diet. This is a commercially desirable result for processors because of the high costs of fat denudation and, for farmers because of the low efficiency of conversion of feed to fat.
The lower proportion of fat and higher proportion of lean on the carcasses of the S + B-fed sheep are reflective of a higher protein-to-energy ratio available for production for the sheep in this group. It has been shown that a higher protein : energy ratio absorbed will result in less deposition of fat in a range of animal species (Andrews and Ørskov, Reference Andrews and Ørskov1970; Searle et al., Reference Searle, Graham and Donnelly1982; Campbell et al., Reference Campbell, Tavener and Curic1984; Campbell, Reference Campbell1988). The saltbush-fed sheep probably have a higher protein-to-energy ratio, firstly, possibly due to an increase in the availability and possibly due to the quality of protein absorbed in the small intestine compared with the control-fed sheep. This has been shown to be a consequence of the increased consumption of water associated with a high salt intake increasing the rate of passage of feed through the digestive tract (Hemsley et al., Reference Hemsley, Hogan and Weston1975). The suggestion that a higher amount of protein is reaching the small intestine in the S + B-fed sheep is supported by a lower plasma urea concentration in the S + B group. An increase in rumen undegradable protein will result in a decrease in the concentration of urea in the plasma (Fontenot et al., Reference Fontenot, Gallup and Nelson1955). Secondly, the sheep fed the S + B diet may also have a decreased energy availability due to the reduced fermentation of OM in the rumen and lower absorption of volatile fatty acids (VFA) associated with the consumption of a high-salt diet (Hemsley et al., Reference Hemsley, Hogan and Weston1975). This may also be associated with a higher water consumption (Hemsley et al., Reference Hemsley, Hogan and Weston1975), but Weston et al. (Reference Weston, Hogan and Hemsley1970) also suggested that saltbush intake was specifically associated with decreased VFA absorption. The S + B group also had a significantly lower ME intake compared with the C group. In addition, the higher energy requirements to process the salt (Arieli et al., Reference Arieli, Naim, Benjamin and Pasternak1989) would decrease the availability of energy for lipogenesis. The increase in protein availability, decreased VFA absorption and increased energy use associated with saltbush-fed sheep provides an explanation for the lower deposition of fat in this group.
These observations in fatness are supported by the changes in metabolic hormones. The S + B group had consistently lower concentrations of insulin and IGF and higher GH during the experiment. These results are reflective of the higher plane of nutrition of the C group as indicated by the significantly higher DOMI and ME intake of this group. Insulin is the primary hormone involved in the regulation of fat storage with higher levels resulting in greater fat deposition (Breier, Reference Breier1999; Guyton and Hall, Reference Guyton and Hall2000). Sheep fed the C diet consuming higher levels of ME will have an increased production of propionate, which stimulates insulin production. In contrast, GH stimulates triglyceride breakdown and then enhances the conversion of fatty acids to acetyl CoA and subsequent utilisation of these substrates for energy (Breier, Reference Breier1999). GH also increases the accretion of protein by increasing the transfer rate of amino acids into cells to be used for protein synthesis and by decreasing the catabolism of proteins (Oddy, Reference Oddy1993; Lobley, Reference Lobley1998).
The lower proportion of fat on the carcass corresponds to a higher proportion of total body water in the carcass. Panaretto (Reference Panaretto1963) and Searle (Reference Searle1970) observed that sheep displaying lower rates of fat synthesis had higher amounts of body water compared with those depositing greater levels of fat at the same live weight. In this experiment, the S + B-fed sheep showed a trend towards higher total body water than the control-fed sheep as shown by the deuterated water sample.
The 62 g/day live-weight gain observed in the S + B-fed group is a positive result, indicating that the combination of barley and saltbush can be used to elicit live-weight gains. However, opportunities to increase live-weight gains while on saltbush need to be investigated if saltbush is to be considered a viable option to finish sheep. The equal live-weight gain between the groups has occurred despite a significantly lower ME and DOMI and resultant lower circulating IGF concentrations by the S + B group. Further field experiments may clarify the growth performance of ingesting saltbush.
The potential to utilise saltbush to produce leaner carcasses should be further investigated in the field. The aim would be to achieve beneficial changes to carcass composition without any detriment to animal production in terms of live-weight gain and subsequent HCWs.
Fatty acid composition
Ingesting S + B resulted in a significantly lower percentage of unsaturated fat and equal levels of saturated fat than the C treatment. These results conflict with those found by Walker et al. (Reference Walker, Potter and Jones1971) who observed that the consumption of water that is high in salt resulted in less saturated fat in the fat depots. This result indicates that the saltbush and barley diet may interact differently with rumen microflora compared with the high-salt water as used by Walker et al. (Reference Walker, Potter and Jones1971) and increase biohydrogenation in the rumen. Other studies have shown that sheep fed a low-energy diet and who have a lower body-fat content had a decreased percentage of unsaturated fat in the fat deposits (Eichhorn et al., Reference Eichhorn, Bailey and Blomquist1985; De Smet et al., Reference De Smet, Webb, Claeys, Uytterhaegen and Demeyer2000).
The S + B-fed sheep had significantly higher levels of linolenic acid (C18:3) in the intramuscular fat deposits. Increased levels of linolenic acid in the fat have been associated with the development of off-flavours and -aromas (Cramer, Reference Cramer1983). Higher levels of linolenic acid and the products of its oxidation (docosahexaenoic acid (C22:6) and eicosapentaenoic acid (C20:5)) are associated with species flavours of meat as a result of the formulation of volatile compounds during cooking (Mottram, Reference Mottram1998). However, in this study there was no significant difference between treatments for the products of the oxidation of linolenic acid, suggesting that linolenic acid may be protected from oxidation. The high concentration of vitamin E in the muscles of saltbush-fed sheep (Pearce et al., Reference Pearce, Masters, Jacob, Smith and Pethick2005) has been shown to protect linolenic acid from oxidation (McDowell et al., Reference McDowell, Williams, Hidiroglou, Njeru, Hill, Ochoa and Wilkinson1996; Mercier et al., Reference Mercier, Gatellier and Renerre2004; Salvatori et al., Reference Salvatori, Pantaleo, Di Cesare, Maiorano, Filetti and Oriani2004). The consumption of a pasture-based diet rather than grain concentrate has been shown in other studies to increase linolenic acid (Bas and Morand-Fehr, Reference Bas and Morand-Fehr2000).
Meat biochemistry
The differences in ME intake and resultant changes in fatness and levels of metabolic hormones may also have implications for glycogen storage and subsequent meat quality. Lower insulin levels and a reduced availability of glycogen substrates due to a lower energy intake in the S + B-fed sheep can result in less glycogen storage (McVeigh and Tarrent, Reference McVeigh and Tarrent1982; Pethick and Rowe, Reference Pethick and Rowe1996). Lower levels of glycogen storage will result in elevated ultimate pH due to lower levels of lactic acid production during rigor mortis development (Lawrie, Reference Lawrie1998). A low ultimate pH (below 5.8) is commercially desirable, as it is associated with lighter meat colour and increased palatability. In this experiment, there were no differences between treatments for muscle glycogen concentrations during the feeding period or at slaughter and no differences in ultimate pH. The ultimate pH of both treatments in this study was below 5.8, ensuring optimal meat quality. No difference in glycogen storage or ultimate pH is a positive result and possibly indicates that factors other than energy intake may be affecting glycogen storage. There is some evidence that saltbush is high in chromium (Mertz et al., Reference Mertz, Roginski, Gordon, Harrison, Shani and Sulman1973; Mirsky et al., Reference Mirsky, Aharoni, Rabinowitz and Izhaki1999) and this experiment demonstrated a two-fold difference in chromium content between the saltbush and control diet. A number of studies have shown that elevated chromium in the diet can potentiate the action of insulin and may facilitate increased muscle glycogen storage (Mertz et al., Reference Mertz, Roginski, Gordon, Harrison, Shani and Sulman1973; Anderson, Reference Anderson1997; Gardner et al., Reference Gardner, Pethick and Smith1998; Mirsky et al., Reference Mirsky, Aharoni, Rabinowitz and Izhaki1999).
There was also no effect of treatment on meat colour. Interestingly both the a and b colour values were higher in this study than observed by Hopkins and Nicholson (Reference Hopkins and Nicholson1999). Higher a* values indicate that the meat is redder, a positive finding as consumers prefer redder meat. However, higher b* values indicate an increase in meat yellowness, a trait not commercially desirable by consumers. It is possible that the saltbush used in this experiment contained compounds that may influence meat redness and yellowness that were not contained in the saltbush on non-saline land used in Hopkins and Nicholson (Reference Hopkins and Nicholson1999).
Eating quality
The ingestion of a saltbush and barley ration prior to slaughter did not result in improved eating quality. Although there was no improvement in the liking of flavour and aroma, tenderness, juiciness and overall acceptance, there was also no negative effects on these attributes. The results for the remaining attributes are consistent with the overall results obtained by Nawaz et al. (1992) and Hopkins and Nicholson (Reference Hopkins and Nicholson1999) who observed the effect of ingesting un-dried non-saline-land saltbush on eating quality. However, Hopkins and Nicholson (Reference Hopkins and Nicholson1999) did show that the sheep fed non-saline-land saltbush produced meat with a higher odour strength only. If the lack of effect on eating quality is also applicable to sheep grazed on saltbush in the field, this may be considered a positive result as sheep can be finished on saltbush without any detriment to eating quality.
The possible effect of drying the saltbush on flavour and aroma compounds available for deposition in the meat and fat requires further investigation. Drying was necessary in the current experiment to allow for mixing and storage of the diets. It was not logistically possible to provide fresh, undried feed; hence the saltbush had to be harvested and brought from its country location (200 km from animal house) prior to the start of the experiment and dried to prevent spoilage. The saltbush was dried at a temperature to reduce potential volatilisation of any compounds. It is therefore essential that this experiment be replicated using fresh saltbush in situ to confidently ensure that the lack of effect on eating quality was not simply due to the drying of the saltbush.
The sheep in this experiment were fed for only 10 weeks and this may not have been a long enough time period for sufficient deposition of the flavour- and aroma-influencing compounds into the fat and lean tissue. Rousset-Akrim et al. (Reference Rousset-Akrim, Young and Berdague1997) observed that 90 days of pastoral feeding v. grain feeding only slightly increased sheepmeat flavour and aroma as assessed by a consumer sensory panel. After 215 days, the flavour and aroma were significantly exacerbated. Therefore, future field experiments should involve longer grazing periods to increase the potential for deposition of flavour and aroma compounds.
Hopkins and Nicholson (Reference Hopkins and Nicholson1999) grazed for a similar time period as this experiment and did observe an effect on odour strength, a result that may have been exacerbated with a longer grazing period. A speculative theory as to why this was the case could be due to the consumption of non-saline-land saltbush, which may be lower in salt compared with saline-land saltbush which contains higher levels of salt. Higher sodium content in the feed is associated with lower feed intakes (Masters et al., Reference Masters, Rintoul, Dynes, Pearce and Norman2005); thus the sheep in the Hopkins and Nicholson (Reference Hopkins and Nicholson1999) study may have had a higher saltbush intake. The consumption of higher levels of saltbush may facilitate greater deposition of flavour and aroma compounds and therefore a difference in eating quality. Alternatively, the sheep ingesting the saline-land saltbush may have a higher water intake compared with sheep consuming non-saline-land saltbush and therefore the resultant increased rate of passage of feed (Hemsley et al., Reference Hemsley, Hogan and Weston1975) could result in compounds for flavour and odour development being flushed out or not adequately digested to allow for accumulation in the fat. While there is no published evidence to support this theory, it is highly likely that a change in rate of passage will influence digestion of a range of compounds.
The lower level of fat on the carcasses of sheep ingesting the S + B diet may also be a reason as to why there was no change to eating quality. Higher intramuscular fat is positively correlated with increased tenderness and juiciness and is associated with flavour development (Hopkins et al., Reference Hopkins, Congram and Shorthose1985; Melton, Reference Melton1990; Rousset-Akrim et al., Reference Rousset-Akrim, Young and Berdague1997; Warriss, Reference Warriss2000). Meat fat is also the principal source of sheepmeat flavour and odour compounds, but the lower levels of fat observed on the carcasses in this experiment did not reflect less-flavoursome meat. Had the saltbush-fed sheep had a higher carcass fat content, it is possible that the eating-quality attributes may have been improved. Importantly, the low carcass fat content was not detrimental to eating quality.
Conclusions
This study has shown that the ingestion of a saltbush can reduce the carcass fat content and increase carcass lean content. This was primarily attributed to a high protein : energy available for production for the S + B group. This is a positive finding as fat denudation is a significant cost to processors and farmers can produce sheep, which are depositing less fat and more lean per unit of live-weight gain. The downside of producing a leaner carcass was a correlated decrease in the unsaturated fat content of the S + B-fed group carcasses. Both groups grew at the same rate and had similar HCWs; however, higher live weights need to be achieved for saltbush to be considered a viable option for finishing sheep. Ingesting dried saltbush did not result in any detriment or improvement to eating quality. This finding may be influenced by drying of the saltbush and the short time the experimental diets were fed. Further work is needed in the field to ensure that the benefits to carcass composition are achieved without compromising animal production and eating quality.
Acknowledgements
The authors thank staff from CSIRO Livestock Industries, in particular Jan Briegel, Hayley Norman, Allan Rintoul, Mike Carthew, Soressa Kitessa, Shimin Liu and Matt Wilmot, for help with laboratory and animal house work. We thank also Danny Suster from DPI Victoria for assistance in scanning the carcasses through the DXA and Vicki Solah from Curtin University for helping to develop the eating-quality protocols. We also thank staff from Murdoch University, Department of Agriculture and Food Western Australia and Hillside abattoir, Narrogin, for the technical support and CSIRO Livestock Industries for providing the PhD scholarship to complete this study.