Fontan operation was first described in 1971 for children with functionally single-ventricle anatomy.Reference Fontan and Baudet1 Over the last 49 years, multiple surgical modifications and advancements in post-operative care have occurred.Reference Jonas2 Yet, children with Fontan operation are still at significant risk of long-term complications including exercise intolerance, arrhythmia, heart failure and development of protein-losing enteropathy.Reference Harahsheh, Sade, Mavroudis, Cook and Mavroudis3–Reference Ooi, Sinha, Gierdalski and Harahsheh5 Protein-losing enteropathy is characterised by a severe loss of serum albumin into the gastrointestinal tract and has been reported in 4–13% of post-Fontan patients.Reference Silvilairat, Cabalka, Cetta, Grogan, Hagler and O’Leary6–Reference Mertens, Hagler, Sauer, Somerville and Gewillig8
Previous reports have identified some clinical, haemodynamic and echocardiographic risk factors associated with the development of protein-losing enteropathy.Reference Silvilairat, Cabalka, Cetta, Grogan, Hagler and O’Leary6,Reference Yu, Yun and Yun9 What is lacking from the literature is an analysis of the economic and medical impacts of post-operative protein-losing enteropathy in children who underwent Fontan operation in the current era. We conducted a study to describe the impact of post-Fontan protein-losing enteropathy on resource utilisation, associated charges and transplant-free-survival at a single large centre in the current era and described utilisation variation among those diagnosed with post-Fontan protein-losing enteropathy.
Methods
This was a retrospective study conducted at Children’s National Hospital. Data were collected via an administrative billing database, and charts were reviewed targeting specific ICD10 (ICD9) codes related to the study population. All patients older than 16 months of age cared for at Children’s National Hospital (inpatients, observation and emergency department) between 1 January, 2009 and 31 December, 2017 with the following ICD10 (ICD-9) codes: hypoplastic left heart syndrome Q23.4 (746.7), congenital tricuspid valve stenosis/congenital tricuspid valve atresia Q22.4 (746.1), functionally single ventricle anatomy Q20.4 (745.3), hypoplastic right heart syndrome Q22.6 (746.1), and congenital malformation of tricuspid valve, unspecified Q22.9 (746.1) were eligible. Patients who had not undergone stage III operation (Fontan type operation) were excluded. Utilisation and charges related to the Fontan procedure admission were excluded.
The Children’s National Hospital administrative billing database was queried to identify demographics (age at Fontan, ethnicity, and gender), dates of hospital admissions and discharges; hospital length of stay, ICU length of stay, mortality occurrence, cardiac transplantation occurrence, utilisation records, charges per admission, total charges per patient, medications, and all cardiac or non-cardiac procedures. The eligibility of the diagnosis of individual patients was verified by accessing the echocardiography, cardiac catheterisation, and the electronic medical record and the following information were extracted: type of functionally single-ventricle anatomy, type of Fontan, presence or absence of heterotaxy and fenestration (Appendix A).
Cost was estimated by multiplying the total hospital charge by the hospital-specific ratio of cost to charge. All reported figures were adjusted for inflation to the 2018 US dollars (2018US$) by using the consumer price index for medical care, as compiled by the US Bureau of Labor Statistics (http://data.bls.gov/cgi-bin/dsrv).Reference Ruth, McCracken, Fortenberry and Hebbar10,Reference Harahsheh, O’Byrne, Pastor, Graham and Fulton11
Patients were divided into two groups based on the presence of post-Fontan protein-losing enteropathy using ICD10 (ICD9) codes K904 or K9089 (579.8) which was confirmed by reviewing the individual electronic medical record. The groups were then compared with regard to the clinical elements identified above. Survival analysis evaluated transplant-free survival.
Statistical analysis
All data were summarised using descriptive statistics of mean and standard deviation, median and interquartile range, and frequency depending on data type. Normality assumptions were tested then Fisher’s exact, chi-square, two sample t-tests, or Wilcoxon rank sum test were used, depending on the distribution of the data, to compare the two groups. We assessed the impact of medication therapies on hospital length of stay and ICU hospital length of stay with the generalised linear model using generalised estimating equations approach to deal with correlations within subjects. For the 28 patients with protein-losing enteropathy, we assessed the impact of medication therapies on overall mortality and/or transplant with the generalised linear model using generalised estimating equations approach; odds ratios were calculated. Kaplan–Meier analysis was used to assess transplant-free survival over time in both groups and to assess the rate of protein-losing enteropathy development. To assess the impact of protein-losing enteropathy on the 10-year transplant-free survival, we conducted a univariate analysis using Cox proportional-hazard regression, calculated hazard ratio, and generalised R-squared (R 2) statistics. Since only one item reached statistical significance, multivariate analysis was not performed. A p value ≤0.05 was considered statistically significant. All analyses were performed using SAS 9.4 (SAS Institute, Cary, North California, United States of America).
Children’s National Hospital Institutional Review Board approved this study with a waiver of consent granted. Author A.S.H. had full access to all the data in the study and takes responsibility for its integrity and the data analysis.
Results
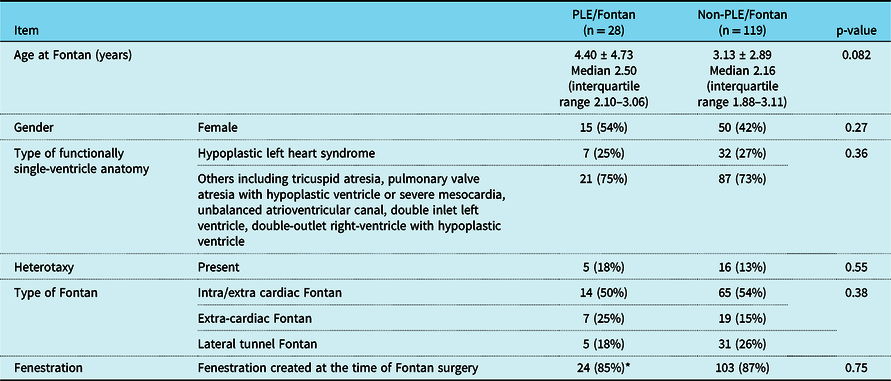
Of the 343 patients identified, 147 met the inclusion criteria (Fig 1). The median age at Fontan operation was 2.2 years (interquartile range 1.9–3.1); 64 patients (43%) were Caucasian, 49 (33%) were black and 65 (47%) were female. Hypoplastic left heart syndrome was seen in 39 (27%), and 21 (14%) patients had heterotaxy. Intra/extra cardiac Fontan was performed in 79 (54%) patients, extra-cardiac Fontan in 26 (18%) patients and lateral tunnel Fontan in 36 (25%) patients. There were 127 patients (86%) who underwent fenestration creation at the time of Fontan surgery (Table 1). The duration of follow-up from time of Fontan had a mean of 5.67 years (range 0.13–32).
Patient distribution. PLE=protein-losing enteropathy.

Demographic comparison

PLE=protein-losing enteropathy.
* At the onset of protein-losing enteropathy; seven patients had a patent Fontan fenestration, seven had a small Fontan fenestration, two patients had a history of device closure due to persistent cyanosis, two other patients had a history of device closure in an effort to reduce risk of stroke (a practice that was later abolished from our centre), five patients had a history of thrombosis of fenestration in the immediate post-operative period and one patient had a history of spontaneous fenestration closure beyond the immediate Fontan surgery.
Of the 147 eligible patients, 28 (19%) developed protein-losing enteropathy. The 1-, 5-, and 10-year protein-losing enteropathy development rates were 7.53, 19.27, and 26.11%, respectively (Fig 2). Table 1 displays demographic data, and there were no marked differences in demographics between the protein-losing enteropathy/non-protein-losing enteropathy groups.
Kaplan–Meier curve for protein-losing enteropathy development. PLE=protein-losing enteropathy. The number of subjects at risk in each group is depicted on the bottom of the graph.

Resource utilisation results
Patients with protein-losing enteropathy had a longer mean (standard deviation) duration of follow-up after the Fontan procedure compared to the non-protein-losing enteropathy group; 7.57 ± 7.81 years versus 5.22 ± 5.69, respectively (p 0.046). After correcting for duration of follow-up, the protein-losing enteropathy group had a higher number of encounters with 2.15 ± 2.16 versus 1.47 ± 2.56 (p 0.002), total charges (all in 2018US$) of 388,489 ± 759,859 versus 202,725 ± 1,076,625 (p < 0.0001), operating costs of 83,070 ± 156,594 versus 41,013 ± 215,129 (p < 0.0001), mean estimated total costs were 144,089 ± 311,217 versus 74,547 ± 407,617 (p < 0.0001). In the length-of-stay analyses, there was greater overall length of stay in days for the protein-losing enteropathy versus non-protein-losing enteropathy 25 ± 51.3 versus 11.4 ± 41.7 (p < 0.0001) and ICU length of stay 10.0 ± 23.7 versus 4.68±35.1, (p < 0.0001); differences between groups were statistically significant in both variables.
Medication utilisation
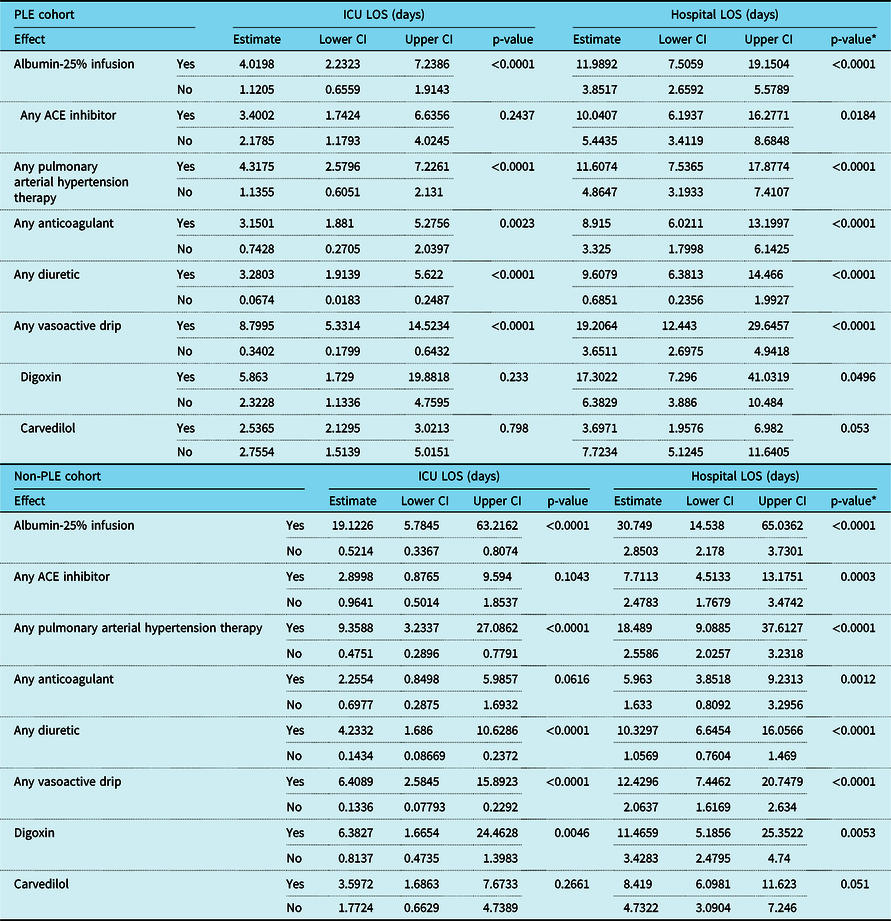
For the entire cohort, there were 596 encounters, 313 were for patients with protein-losing enteropathy and 283 for those without protein-losing enteropathy. There were statistically significant differences between the two groups requiring the following medications (protein-losing-enteropathy versus non-protein-losing enteropathy, respectively): any pulmonary hypertension therapy in 174 versus 44 (56 versus 16%, p < 0.0001), any anticoagulant in 264 versus 216 (84 versus 76%, p 0.0135), carvedilol in 62 versus 17 (20 versus 6%, p < 0.0001), diuretics 266 versus 121 (85 versus 43%, p < 0.0001), any vasoactive drips in 125 versus 79 (40 versus 28%, p = 0.002), albumin 25% infusion in 188 versus 20 (60 versus 7%, p < 0.0001), and calcium in 103 versus 52 (33 versus 18%, p < 0.0001); however, lower proportions of encounters for patients with protein-losing enteropathy utilised angiotensin-converting enzyme inhibitors versus non-protein-losing enteropathy in 123 versus 136 (39 versus 48%, p 0.0312). There was no significant difference in utilisation of digoxin between the two groups 51 versus 56 (16 versus 20%, p 0.27). No medication was associated with a significant reduction in hospital or ICU length of stay (Table 2).
Analysis of impact of medications on length of stay

ACE=angiotensin-converting enzyme; CI, confidence interval; LOS=length of stay; PLE=protein-losing enteropathy.
* p values were calculated with generalised linear model using generalised estimating equations approach.
Utilisation variation among patients with post-Fontan protein-losing enteropathy
As shown above, we noticed a variation in therapy among the patients with post-Fontan protein-losing enteropathy. For patients with post-Fontan protein-losing enteropathy, impact of medication therapies on mortality and/or transplant was assessed with the generalised estimating equations model. Digoxin therapy was associated with a slightly decreased odds for mortality and/or transplant (0.95, confidence interval 0.90–0.99, p 0.021), whereas calcium therapy (oral and/or intravenous forms) was associated with a slightly increased odds for mortality and/or transplant (1.05, confidence interval 1.01–1.09, p 0.021) (Table 3).
Overall impact of medication and procedural interventions on risk of transplant and/or mortality in children with post-Fontan PLE

PLE=protein-losing enteropathy.
* p values were calculated with generalised linear model using generalised estimating equations approach.
Transplant-free survival
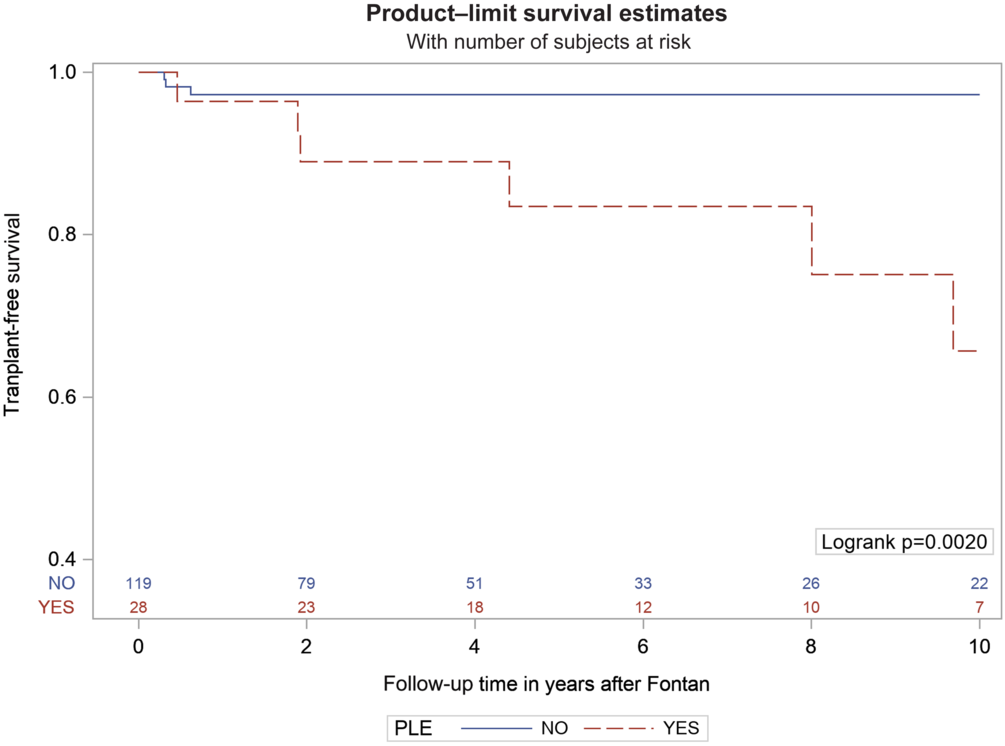
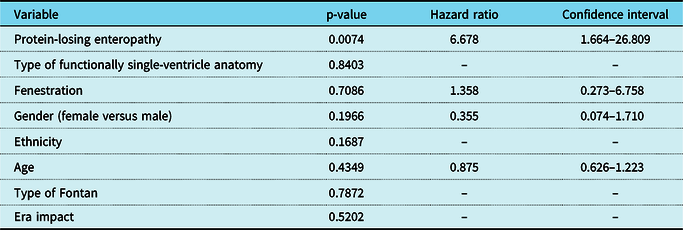
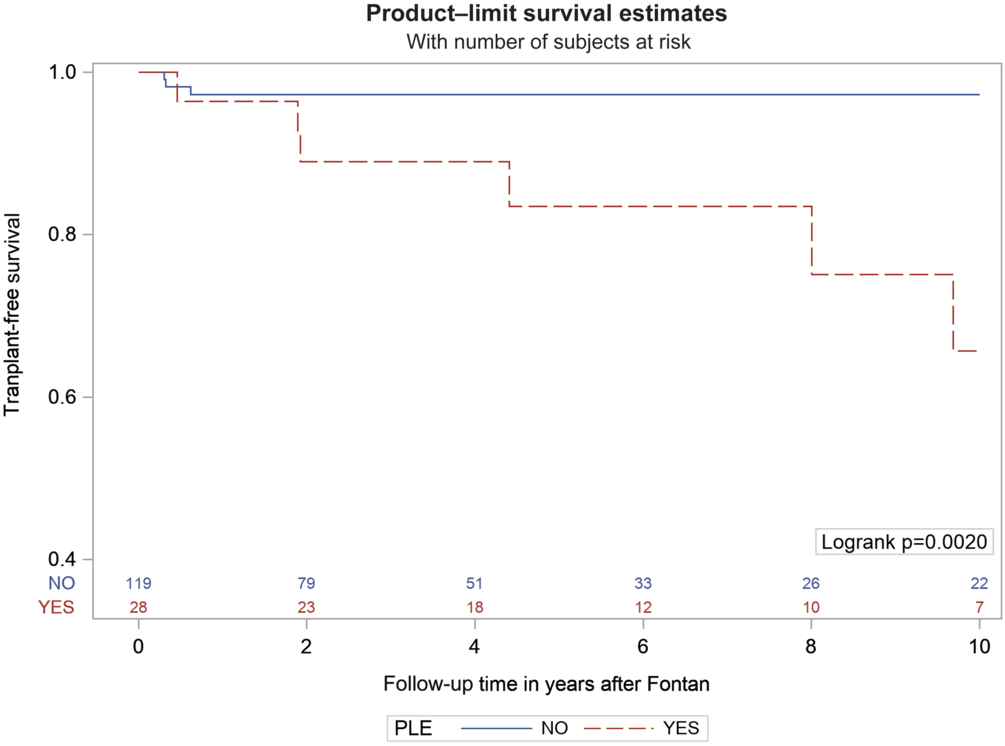
The 1-, 5-, and 10-year transplant-free survival for patients with/without protein-losing enteropathy were 96.4 versus 97.3% (p = 0.82), 83.5 versus 97.3% (p = 0.025), and 65.7 versus 97.3% (p = 0.002), respectively, using a Kaplan–Meier analysis (Fig 3) (Table 4). In the protein-losing enteropathy group, three patients were discharged to hospice care and were alive at the time of last follow-up. In a univariate analysis of Cox proportional hazard regression only, protein-losing-enteropathy was associated with a worse 10-year transplant-free survival. Gender, ethnicity, type of functionally single-ventricle anatomy, age at Fontan, type of Fontan, presence of fenestration and/or era in which Fontan operation occurred were not. Based on the results of the 10-year model analysis, the estimated hazard ration (HR) for protein-losing-enteropathy was 6.678, with a generalised R2 statistic of 0.574. This indicates that patients with protein-losing-enteropathy have 5.68 times higher risk of transplant or mortality than patients without protein-losing-enteropathy (Table 5).
Kaplan–Meier curve for 10-year transplant-free survival. The number of subjects at risk in each group is depicted on the bottom of the graph.
Survival comparisons by group

PLE=protein-losing enteropathy.
* The patients were listed for cardiac transplantation due to progressive protein-losing enteropathy. In addition, two out of the four patients were receiving intravenous inotropic support prior to cardiac transplantation.
** Reason for cardiac transplantation listing was progressive deterioration in ventricular function requiring support with extracorporeal membrane oxygenation.
Univariate analysis of Cox proportional hazard regression at 10-year post-Fontan

PLE=protein-losing enteropathy.
The authors confirm that the data supporting the findings of this study are available in Supplementary Appendix A.
Discussion
In the current era, protein-losing enteropathy remains a significant complication for children who undergo functionally single-ventricle anatomy palliation with the Fontan procedure. In our study, the development of protein-losing enteropathy was associated with reduced 5- and 10-year transplant-free survival, higher resource utilisation, and increased charges. Despite the increased risk, we noticed practice variation among patients diagnosed with post-Fontan protein-losing enteropathy in our centre. An incidental finding in this study patients with post-Fontan protein-losing enteropathy indicated that digoxin therapy was associated with a slightly decreased odds for mortality and/or transplant, whereas calcium therapy (oral and/or intravenous forms) was associated with slightly increased odds for mortality.
Our data show that 19% of children who sought health care at our centre after the Fontan developed protein-losing enteropathy. The frequency of post-Fontan protein-losing enteropathy in this report is higher than what has been previously reported.Reference Mertens, Hagler, Sauer, Somerville and Gewillig8 This difference could be explained by the methodology of this report. We purposefully excluded data related to the Fontan procedure admission, which resulted in reducing the denominator of post-Fontan patients by 85 (Fig 1). Our findings of protein-losing enteropathy development after the Fontan procedure is of importance in that previous reports have reported as many as 40% of those diagnosed with protein-losing enteropathy will develop Fontan failure within 5 years of protein-losing enteropathy diagnosis.Reference Allen, Downing and Glatz12
In this report, we provide separate analyses for those with/without protein-losing enteropathy. Overall, those with protein-losing enteropathy fared poorly as their 10-year transplant-free survival was 65.7%, whereas those without protein-losing enteropathy performed better at 97.3%. The 5-year transplant-free survival rate for our patients who survived their Fontan admission and had protein-losing enteropathy was 83.5%. This is similar to recent findings by John et al. who found that the 5-year survival in their post-Fontan protein-losing enteropathy cohort was 88%.Reference John, Johnson, Khan, Driscoll, Warnes and Cetta13 This represents a great improvement based on prior era data published by Merten et al. that reported worse outcomes with the 5-year mortality nearing 50%.Reference Mertens, Hagler, Sauer, Somerville and Gewillig8
In addition to the observed decrease in transplant-free survival, our patients with post-Fontan protein-losing enteropathy experienced increased health care utilisation, hospital encounters, costs, and charges as would be expected. We also noticed differences in resource and medication utilisation among the protein-losing enteropathy group. The frequency of therapy varied from 16% for digoxin to 85% for diuretics. This suggests a potential for standardisation and improvement for therapy in this post-Fontan patient group. Standardisation of care has previously been shown to improve care.Reference Harahsheh, Hom and Clauss14 Ideally, our institutional systems would work not only on preventing post-Fontan protein-losing enteropathy from developing, but also on building protocols and algorithms to standardise the post-Fontan care for those patients. Some centres have developed long term Fontan clinics, combined multidisciplinary Fontan clinics, and/or functionally single-ventricle anatomy survivorship programmes.Reference Rychik and Kim15,Reference Davis, Miller-Tate and Texter16 Future research is needed to assess the impact of these protocols and initiatives on the clinical outcome of children with post-Fontan protein-losing enteropathy.
Digoxin therapy was associated with slightly decreased odds for mortality and/or transplant. Digoxin therapy has been noted previously to have a protective effect in children with functionally single-ventricle anatomy specifically interstage mortality. Utilising data from the Pediatric Heart Network Single Ventricle Reconstruction Trial, Oster et al reported a reduced risk of interstage mortality among those receiving digoxin therapy with a reduction from 12.3%, compared to 2.9% among those on digoxin.Reference Oster, Kelleman, McCracken, Ohye and Mahle17 This protective impact of digoxin was also seen even among those with no history of arrhythmia.Reference Brown, Mangeot and Anderson18 Longer term follow-up questioned the net protective effect of digoxin.Reference Truong, Menon and Lambert19 A further large study is needed to assess the impact of digoxin on the well-being of children with post-Fontan protein-losing enteropathy to more clearly understand the age or stage at which it should be started.
Our finding of slightly increased odds for mortality and/or transplant in patients receiving calcium therapy warrants further clarification. Is it the calcium therapy itself or the need for calcium therapy that increases the risk? What dose, route, initiation age/stage is optimal to decrease risk of mortality and/or transplant? Abnormal bone mineral density has been previously reported in children with post-Fontan protein-losing enteropathy.Reference Goldberg, Dodds and Avitabile20 Hypocalcaemia in patients admitted to the ICU was associated with longer length of stay and increased mortality.Reference Chernow, Zaloga and McFadden21 While a previous report noted that continuous calcium chloride infusion was associated with better cardiac output in paediatric patients admitted to the cardiac ICU,Reference Averin, Villa and Krawczeski22 higher ionised calcium concentration was associated with increased ICU length of stay.Reference Kimura, Iwasaki and Oe23 Additional larger studies are needed to assess impact and mechanism of calcium therapy in children with post-Fontan protein-losing enteropathy.
Previous reports have assessed resource utilisation related to the Fontan procedure. Dean et al., utilising the University Health System Consortium, noted an increase in hospital length of stay and charges of the Fontan procedure as the survival rate improved between 1998 and 2007.Reference Dean, Hillman, McHugh and Gutgesell24 Hinkle et al, utilising the Pediatric Health Information Systems Database between 01/2004 and 01/2013, found that variables such as frequency of admissions between bidirectional Glenn to Fontan and Fontan surgical volume were associated with increased hospital length of stay and Fontan charges.Reference Hinkle, Wilkes, McFadden, Williams, Minich and Menon25 These reports focused only on the Fontan procedure admission and did not include long-term data. Huang et al, utilising the Australia and New Zealand Fontan registry, reported the inpatient hospital costs for Fontan patients from birth to adulthood.Reference Huang, Schilling and Dalziel26 They noticed considerable resource utilisation beyond the Fontan surgery admission as noted in our study. Our report is unique in that it is focused on resource utilisation beyond the Fontan procedure admission as well as looking at differences with and without protein-losing enteropathy.
Limitations
This is a single-centre retrospective study. Our charge implications might be underestimated as we did not include data related to ambulatory clinic utilisation, primary care, community-based urgent and emergent care. Costs to families were also not included in this report. With regard to pharmaceutical therapy, this report does not include details of dose, indication of therapy or change in therapy. In this report, we did not assess pre-operative factors, Fontan surgical strategies, or immediate post-operative management strategies that might be associated with a reduced risk of protein-losing enteropathy in these patients.
Future directions and next steps
Locally, we plan to better understand why 28 of our patients developed protein-losing enteropathy. We plan to analyse the pre-Fontan haemodynamics to assess if there is a need for better patient selection criteria and/or earlier referral and assessment by the advanced cardiac care team prior to Fontan surgery. Second, we plan to assess a multicenter database, Pediatric Health Information System, to see how generalisable our results are and whether any single medication or combination of medications are associated with better/worse survival in children with post-Fontan protein-losing enteropathy.
Conclusions
In the current era, development of post-Fontan protein-losing enteropathy is associated with higher resource utilisation, increased charges, and reduced 5- and 10-year transplant-free survival. Practice variation among patients diagnosed with post-Fontan protein-losing enteropathy exists. Further larger studies are needed to assess the impact of standardisation on the well-being of children with post-Fontan protein-losing enteropathy.
Supplementary material
To view supplementary material for this article, please visit https://doi.org/10.1017/S1047951120001985
Acknowledgements
The authors are grateful for Angela J. Doty, MD; Cathleen E. Shannon, MSN, RN, CPNP for their editorial assistance, Bill Pastor, MA, MPH and Jaeho Chang, MBA for data gathering, James E. Bost, MS, PhD for statistical support and the Medical Research Fellowship Program at the George Washington University School of Medicine and Health Sciences’ Office of International Medicine Programs.
Author contributions
Baneen Alkofair was involved in study design, data gathering, analysis of data, and drafting the manuscript. Abdulmajeed Alruwaili was involved in study design, data gathering, and revising the manuscript. Jiaxiang Gai was involved in the analysis of data and revising the manuscript. Ashraf S. Harahsheh was involved in study design, data gathering, analysis of data, and revising the manuscript. This submission is with the full knowledge and approval of the listed co-authors.
Financial support
This research received no specific grant from any funding agency, commercial or not-for-profit sectors. All authors have reported that they have no relationships relevant to the contents of this paper to disclose.
Conflicts of interest
None.
Ethical standards
Children’s National Hospital Institutional Review Board approved this study with a waiver of consent granted.