Introduction
Mammalian follicular oocytes are surrounded by cumulus cells and adhere to cumulus cells physically by gap junctions (Anderson et al., Reference Anderson, Wilkinson, Lee and Meller1978). Molecular exchanges and signal transportation between oocytes and cumulus cells are achieved via gap junction channels (Wang et al., Reference Wang, Chi, Schedl and Moley2012; Appeltant et al., Reference Appeltant, Somfai, Nakai, Bodo, Maes, Kikuchi and Van Soom2014). Gap junction channels are assembled from a ubiquitously expressed class of four-pass trans-membrane proteins termed connexins (Grosely & Sorgen, Reference Grosely and Sorgen2013; Oshima, Reference Oshima2014). So far, many types of connexins have been reported such as Cx26 (26 kDa, molecular weight), Cx37, Cx40, Cx43, Cx45, Cx57, Cx60 (60 kDa, molecular weight), and so on (Nielsen et al., Reference Nielsen, Axelsen, Sorgen, Verma, Delmar and Holstein-Rathlou2012; Verheule & Kaese, Reference Verheule and Kaese2013). Among them, Cx43 is known as the most abundantly expressed connexin (Solan & Lampe, Reference Solan and Lampe2009; Chen et al., Reference Chen, Zhao, Chu, Kito, Yamauchi, Shigeyoshi, Hashimoto and Hattori2013). Recent porcine reproduction research has focused on revealing the relationship between Cx43 and oocyte maturation. It was reported that the Cx43 protein level changes over time and is affected by PKC and PI3K during in vitro maturation of porcine cumulus–oocyte complexes (COCs) (Shimada & Terada, Reference Shimada and Terada2001; Shimada et al., Reference Shimada, Maeda and Terada2001). Another study found that Cx43 mRNA is expressed in porcine COCs during meiotic resumption and its expression level is affected by gonadotropins (Granot & Dekel, Reference Granot and Dekel2002; Santiquet et al., Reference Santiquet, Robert and Richard2013). Many studies have demonstrated that Cx43 may participate in oocyte maturation and is regulated by gonadotropin stimulation or another factor down-stream of gonadotropin.
However, the Cx43 protein has never been detected in porcine oocytes. Most Cx43 studies of porcine oocyte maturation have only considered COCs. Although the Cx43 mRNA expression level has been examined in porcine oocytes, its expression was weaker in oocytes than in cumulus cells, and the Cx43 protein has not been localized in oocytes, only in cumulus cells (Santiquet et al., Reference Santiquet, Robert and Richard2013). In the case of mouse oocytes, the Cx43 protein has been detected in cumulus cells and oocytes including transzonal projections (Simon et al., Reference Simon, Chen and Jackson2006; Kidder & Mhawi, Reference Kidder and Mhawi2002). In mouse oocytes, Cx43 is known to be synthesized in cumulus cells and transported into oolemmas via transzonal projections (Kidder & Mhawi, Reference Kidder and Mhawi2002).
We hypothesized that Cx43 in porcine oocytes may be transported via transzonal projections similar to that in mice. To confirm this hypothesis, we performed immunocytochemistry and western blotting in denuded porcine oocytes during in vitro maturation, to observe the localization and protein level of Cx43. In this study, we show the precise location of Cx43 and provide a quantitative analysis of the Cx43 protein in porcine oocytes during in vitro maturation.
Materials and methods
Oocyte maturation
Porcine ovaries were collected from gilts at a local slaughterhouse and transported to the laboratory in a container within 2 h of extraction. The follicular fluid and porcine oocytes were aspirated from antral follicles (diameter: 3–6 mm) with a 10-ml syringe attached to an 18-gauge needle. Compact COCs with uniform ooplasm were selected in phosphate-buffered saline (PBS; Nissui Pharmaceutical, Ueno, Tokyo, Japan) supplemented with 0.1% polyvinyl alcohol (PVA; Sigma Chemical, St Louis, MO, USA). After washing three times in 0.1% PBS–PVA, the COCs were cultured in NCSU-23 medium (Petters & Wells, Reference Petters and Wells1993) supplemented with 50 μM β-mercaptoethanol (Sigma), 0.6 mM cysteine (Sigma), 0.5% insulin (Sigma), 10% (v/v) porcine follicular fluid, 10 IU pregnant mare serum gonadotropin (PMSG; Serotropin; Teikokuzouki, Tokyo, Japan), 10 IU human chorionic gonadotropin (hCG; Puberogen; Sankyo, Tokyo, Japan), and 1 mM dibutyryl cyclic AMP (dbcAMP; Sigma) for the first 22 h of maturation at 38.5°C in 5% CO2 in air. The COCs were cultured for a further 20 h in the same medium without hormonal and dbcAMP supplementation. After cell culturing, expanded COC cumulus cells were removed by gentle vortexing in PB1 medium (Quinn et al., Reference Quinn, Barros and Whittingham1982) containing 0.1% hyaluronidase (Sigma). The denuded oocytes (DOs) were subsequently processed according to protocols for western blotting and immunocytochemistry.
Intenerate zona pellucidae of porcine oocytes
Twenty COCs were harvested after 28 h in culture. Expanded COC cumulus cells were removed by gentle vortexing in PB1 medium (Quinn et al., Reference Quinn, Barros and Whittingham1982) containing 0.1% hyaluronidase (Sigma). The oocytes were treated in Acidic Tyrode's solution (Sigma) for 3 s. After washing three times in PBS–PVA, the zona-intenerated DOs were subsequently processed according to protocols for immunocytochemistry using Cx43 monoclonal antibody.
Time course immunocytochemistry of Cx43 in porcine oocytes
Twenty COCs of each group were harvested after 0, 14, 28 or 42 h in culture. Expanded COC cumulus cells were removed by gentle vortexing in PB1 medium (Quinn et al., Reference Quinn, Barros and Whittingham1982) containing 0.1% hyaluronidase (Sigma). After washing three times in PBS–PVA, DOs were fixed with 4% paraformaldehyde (Sigma) in Dulbecco's PBS(–) containing 0.1% PVA at 4°C for 90 min. Then, DOs were placed in 0.5% Triton X-100 in PBS(–) containing 3% BSA (Sigma) at room temperature for 20 min, washed three times in PBS–PVA for 15 min each, and stored in PBS–PVA containing 1% BSA (Sigma) (PBS–PVA–BSA) at 4°C overnight or longer. Next, the DOs were blocked with 10% fetal bovine serum (FBS; Gemini Bio-products, Calabras, CA, USA) in PBS–PVA–BSA at room temperature for 45 min. The oocytes were incubated overnight at 4°C with rabbit anti-Cx43 monoclonal antibody (Cell Signaling, Beverly, MA, USA), which was the same antibody used in this study for western blotting, at a dilution of 1:200 in 10% FBS in PBS–PVA–BSA. In the control group, the oocytes were incubated overnight at 4°C without antibodies. After three washes with PBS–PVA–BSA, the oocytes were incubated with Alexa Fluor 488-labelled goat anti-rabbit antibody (Molecular Probes, Eugene, OR, USA) at a dilution of 1:50 in PBS–PVA–BSA for 40 min at room temperature. After three washes with 0.1% Triton X-100 in PBS–PVA–BSA for 15 min each, the nuclei were labelled with 20 μg/ml PI (Sigma) for 60 min at room temperature. After washing with PBS–PVA–BSA, the oocytes were mounted on glass slides. Alexa Fluor 488 and PI generated green and red fluorescent signals, respectively. The samples were viewed using an LSM700 confocal scanning laser microscope (Zeiss, Oberkochen, Germany). Oocytes, with a nucleus on their equatorial planes and expressing a representative signalling intensity for each time point were selected and their pictures were obtained.
Time course western blot analysis of Cx43
Protein extraction from oocytes was performed at 0, 14, 28, and 42 h. At each time point, 44 oocytes of each group that had been denuded by 0.1% hyaluronidase (Sigma) in PB1 medium were placed in 1× sodium dodecyl sulfate (SDS) sample buffer, 0.5 M Tris–HCl (pH 6.8), 10% 2-mercaptoethanol, and 20% glycerol. Lysates were cryo-preserved at –80°C. Above procedure were repeated one more time. The above procedure was repeated one more time. After heat denaturation, a total of 88 oocyte lysates (44 oocyte lysates combined with another 44 oocyte lysates) were loaded in each lane of a 4–15% gradient for SDS polyacrylamide gel electrophoresis (PAGE) (Bio-Rad, Hercules, CA, USA). After protein separation by electrophoresis, the gel was transferred to Immobilon membranes (Millipore, Billerica, MA, USA). After the transfer, the membranes were blocked with Blocking One (Nacalai Tesque, Kyoto, Japan) for 1 h at room temperature and washed several times with Tris-buffered saline containing 0.1% Tween 20 (TBS-T). The membranes were incubated with rabbit anti-Cx43 monoclonal antibody (Cell Signaling) overnight at 4°C and then incubated with horseradish peroxidase-labelled anti-rabbit IgG (dilution 1:10,000; Invitrogen, Carlsbad, CA, USA). After several washes with TBS-T, the peroxidase activity was visualized using an ECL Plus Western Blotting Detection System (GE Healthcare, Piscataway, NJ, USA). Cx43 signals were detected with an Image Reader LAS-3000 (Fujifilm, Tokyo, Japan). Subsequently, Cx43 antibodies and second anti-rabbit IgG antibodies were stripped by stripping buffer. Then, the membrane was processed for α-tubulin detection using an α-tubulin first antibody according to above dictated protocol of western blotting. The entire procedure was repeated three times.
Statistical analysis
The western blotting experiment was repeated three times. Three time points from the data set were analysed using STATVIEW (Version 5.0, SAS Institute Inc., Cary, NC, USA). Comparisons between the adjacent two groups were made using Student's t-test. For all statistical analyses, a P-value of less than 0.05 was considered significant.
Results
Cx43 localization by immunocytochemistry in porcine oocytes
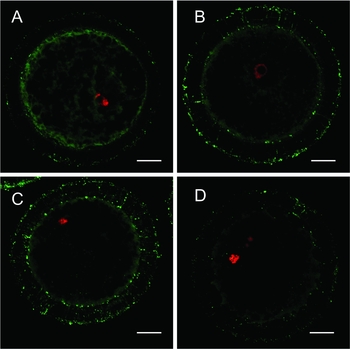
Immunocytochemistry was applied to examine porcine oocytes by using Cx43 monoclonal antibody at 0, 14, 28, and 42 h after starting cultures. Cx43 signals were detected on transzonal projections and surfaces of zona pellucidae at 0, 14, 28 or 42 h, although the signals in the 42 h sample showed relatively weak intensity (Fig. 1A–D ). Except for the 42 h group, the signalling intensity of each group (at 0, 14 or 28 h) did not show significant differences when observed with the naked eye.
Connexin43 is localized in porcine oocytes during maturation. The immunocytochemistry of connexin 43 (Cx43) in oocytes cultured for 0 h (A), 14 h (B), 28 h (C) or 42 h (D) was examined. Oocytes with a nucleus on their equatorial planes and expressing a representative signalling intensity for each time point were selected and their pictures were obtained. Green and red indicate Cx43 and the nucleus, respectively. Scale bar = 20 μm.

Confirmation of Cx43 signal on oolemma
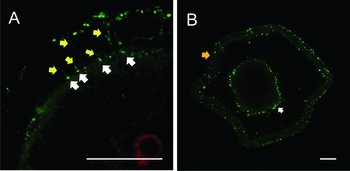
Immunocytochemistry was used to examine porcine oocytes by using Cx43 monoclonal antibody. Immunocytochemistry was applied to examine porcine oocytes using a Cx43 monoclonal antibody. In the magnified picture of the 14 h sample, Cx43 signals located near the oolemma were detected and represented by a dot-shape at the tip of the transzonal projection. Some of the Cx43 dot-shaped signals located near the inner zona pellucida, were detected in an independent site from the transzonal projection. White arrows indicate Cx43 signals at the tip of transzonal projection and yellow arrows indicate Cx43 signals on transzonal projection (Fig. 2A ). The green and red signals represent Cx43 and nuclei, respectively. In the immunocytochemistry picture of the intenerated oocytes at 28 h which were briefly treated by Acidic Tyrode's solution, Cx43 signals were separately detected each in the zona pellucida and oolemma. The orange arrow indicates an intenerated zona pellucida, and white arrows indicate Cx43 signals on the oolemma (Fig. 2B ).
Quantitative analysis of Cx43 during maturation
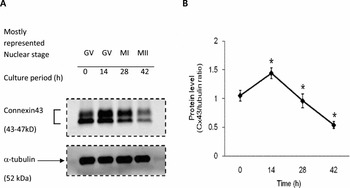
Cx43 protein levels were examined by western blotting in porcine oocytes in a time course of 0, 14, 28, and 42 h for cultures in NCSU-23 medium. During the time course, Cx43 levels increased to a maximum at 14 h and dropped to a minimum at 42 h (Fig. 3A ). When the band density of Cx43 and α-tubulin was converted to numerical values for each time point using the LAS system (Fujifilm) and a numerical value set of three times repeated experiments were analysed statistically, the graph also showed that the Cx43/α-tubulin ratio was increased to a maximum at 14 h and dropped to a minimum at 42 h. Cx43/α-tubulin ratios between adjacent two groups were significantly different between samples at 0 and 14 h, 14 and 28 h, and 28 and 42 h (P < 0.05 for each comparison) (Fig. 3B ).
Connexin 43 embedded on the oolemma located at the tip of the transzonal projection. The picture at 14 h (Fig. 1A ) was obtained under magnification. White arrows indicate Cx43 signals at the tip of the transzonal projection and yellow arrows indicate Cx43 signals in the transzonal projection (A). The immunocytochemistry of connexin 43 (Cx43) in zona-intenerated oocytes was examined. The orange arrow indicates the intenerated zona pellucida and the white arrows indicate Cx43 signals on the oolemma. An oocyte expressing a representative signalling intensity was selected and its picture was obtained (B). Green indicates Cx43. Scale bar = 20 μm.

Connexin 43 levels change over time during culture. Connexin 43 (Cx43) levels were determined by performing western blotting during maturation (A). The Cx43/α-tubulin ratio was calculated and the data were expressed relative to the value at 0 h (B). The lysate from each group of 88 oocytes was processed and cryo-preserved after 0 h, 14 h, 28 h, or 42 h in culture, and 88 oocytes were loaded into each lane. The data were analysed by using Student's t-test (*P < 0.05; n = 3). The data are shown as the mean ± standard deviation (SD). *P < 0.05 as compared with each previous time point.

Discussion
Recent studies of cells such as cancer and stem cells emphasize the role of gap junctions in cell-to-cell communication for cell growth and development (Berthoud et al., Reference Berthoud, Minogue, Osmolak, Snabb and Beyer2014; Guy et al., Reference Guy, Geletu, Arulanandam and Raptis2014; Herzog et al., Reference Herzog, Dohle, Bischoff and Kirkpatrick2014). An oocyte is the specific cell that is bigger than adjacent cells and is surrounded by zona pellucidae (Louros et al., Reference Louros, Iconomidou, Giannelou and Hamodrakas2013). For this reason, an oocyte has more gap junction channels than other cells and may be influenced more by adjacent cells. Recent studies regarding oocyte maturation have focused on the role of gap junctions and their main component protein Cx43 (Pant et al., Reference Pant, Reynolds, Luther, Borowicz, Stenbak, Bilski, Weigl, Lopes, Petry, Johnson, Redmer and Grazul-Bilska2005; Pandey et al., Reference Pandey, Gupta and Gupta2009; Kempisty et al., Reference Kempisty, Ziolkowska, Piotrowska, Antosik, Bukowska, Zawierucha, Jaskowski, Brussow, Nowicki and Zabel2014). Compared with normal cells, which have no zona pellucidae, oocytes have transzonal projections through zona pellucidae (Palma et al., Reference Palma, Arganaraz, Barrera, Rodler, Mutto and Sinowatz2012). It has been known that transzonal projections originate from cumulus cells and penetrate the oocyte (Anderson & Albertini, Reference Anderson and Albertini1976; Li & Albertini, Reference Li and Albertini2013). In mouse and bovine oocytes, Cx43 has been found in transzonal projections (Simon et al., Reference Simon, Chen and Jackson2006; Makita & Miyano, Reference Makita and Miyano2014). Our immunocytochemistry results are the first demonstration that Cx43 in porcine oocytes also exist on the transzonal projection during in vitro maturation (Fig. 1E). Moreover, we confirmed that dot-shaped Cx43 signals at tips of zona pellucidae locate on oolemmas (Fig. 1F), which are regarded as gap junctions. In previous studies of Cx43 expression during porcine oocyte maturation, Cx43 mRNA expression of denuded oocyte was weaker than in cumulus cells, while the Cx45 mRNA expression level of DOs was approximately equal to that of cumulus cells and the Cx60 mRNA expression level was stronger in DOs than cumulus cells (Santiquet et al., Reference Santiquet, Robert and Richard2013). We inferred that Cx43 may be synthesized mainly in cumulus cells and subsequently transported to oocytes followed by gap junction formation in the oolemma. However, previous immunostaining data did not show a signal in the zona pellucidae or oolemmas (Santiquet et al., Reference Santiquet, Robert and Richard2013). Our Cx43 localization results provide powerful evidence that it is transported via transzonal projections during porcine oocyte maturation because the Cx43 signal was detected in transzonal projections (Fig. 1). In addition, a dot-shaped Cx43 signal (Fig. 2A ) at the tip of transzonal projection and Cx43 signal on oolemma in zona softened oocytes (Fig. 2B ) support the idea that Cx43 exists on the oolemma of porcine oocytes during maturation and that Cx43 in the oolemma is related to transzonal projections. Combining our results with those of recent studies, we can infer that the main gap junction protein Cx43 is mainly synthesized in cumulus cells and is subsequently transported to the oolemma through transzonal projections in porcine oocyte.
In our time course analysis of Cx43 protein levels, we verified, for the first time, Cx43 variation in porcine oocytes during maturation. The strongest level of Cx43 was observed at 14 h and then it decreased until 42 h (Fig. 3). In the NCSU-23 culture system, most oocytes were in the germinal vesicle (GV) stage until 22 h, and GV breakdown (GVBD) was started mostly until 28 h. Subsequently, oocytes reached metaphase (M)II stage up to 42 h (Abeydeera et al., Reference Abeydeera, Wang, Cantley, Rieke, Prather and Day1998). Therefore, it is inferred that Cx43 in porcine oocytes increases until GVBD and then is gradually degraded until the MII stage. However, our quantitative analysis of Cx43 in porcine oocytes does not correspond with some previous results. Another group reported that the Cx43 level in porcine COCs is the weakest at 14 h, rather than at 0 h or 28 h (Shimada et al., Reference Shimada, Maeda and Terada2001). This may reflect the different expression patterns between oocytes including cumulus cells that directly attach to oocytes and other cumulus cells. One clear result of our quantitative analysis is that Cx43 levels in oocytes and cumulus cells attached to oocytes are strongest within 0 to 28 h. Therefore, we concluded that expression of Cx43 in oocytes and adjacent cumulus cells peaks within the GVBD stage then gradually decreases until the MII stage.
To summarize, our current study elucidated two important findings. First, the main gap junction protein Cx43 in porcine oocytes moves through the transzonal projection, and gap junctions containing Cx43 exist in the oolemma near the tip of the transzonal projection. Second, the Cx43 protein level in porcine oocytes changed dynamically during in vitro maturation and mainly accumulated during the GV stage, which is the period of oocyte growth. In this study, although we did not examine the transporting direction of Cx43, we proved that the Cx43 pass through transzonal projections and the amount of Cx43 in oocytes changes during in vitro maturation of porcine oocytes. In future studies, transporting direction of Cx43 and the locations of the origin and termination of Cx43 during porcine oocyte maturation should be determined, for a more comprehensive view of cytoplasmic maturation.
With respect to the protein recycling system, our results suggest new insights for cytoplasmic maturation if combined with consideration of the origin and termination of Cx43 of oocytes. For example, if embedded Cx43 in oolemmas mostly comes from cumulus cells, Cx43 protein itself could be not only a component of gap junctions, but also an external source for embryo development after fertilization via its degradation and recycling, because an oocyte is a selfish cell that does not share gap junctions with any adjacent cell due to zona pellucidae. Generally, amino acids are transported via the gap junction channel. However, it is uncertain precisely which amino acids are imported. Our results provide the idea that the amino acids derived from Cx43 may be imported to the oolemma. If then, the amino acid derived from Cx43 might be reused during in vitro maturation or stocked in ooplasm for embryo development of the post-fertilization period. Many studies in general cell research have explored the mechanism for Cx43 degradation and recycling so far (Fernandes et al., Reference Fernandes, Girao and Pereira2004; Leithe & Rivedal, Reference Leithe and Rivedal2004; Bejarano et al., Reference Bejarano, Girao, Yuste, Patel, Marques, Spray, Pereira and Cuervo2012; Fong et al., Reference Fong, Kells, Gumpert, Marzillier, Davidson and Falk2012). We hope that research into Cx43 degradation and recycling in porcine oocytes will give more insight into cytoplasmic maturation, triggered by our contribution which provides the fundamental data for Cx43 localization and its dynamics during porcine oocyte maturation.
Acknowledgements
This work was supported by a grant from the Japan Society for the Promotion of Science to E. Sato (no. 21248032) and a fund of Project No. PJ009321 from Rural Development Administration, Republic of Korea.