On July 26, 2016, Hillary Clinton succeeded in officially clinching the Democratic presidential nomination—a feat no woman from either of the two major political parties had ever accomplished. With a woman occupying the top of the Democratic ticket, observers of the election predicted a significant gender divide in voting behavior, with the majority of women lending their support to Clinton and the majority of men supporting the Republican Party presidential nominee, Donald Trump (Cadei Reference Cadei2016; Chaturved Reference Chaturved2016). In fact, the gender gap in 2016 was projected to be the largest in history (Kurtzleben Reference Kurtzleben2016; Waldman Reference Waldman2016).
Since 1996, the majority of women have been consistently voting for the Democratic candidate in presidential elections. Furthermore, female Democratic presidential-candidate support has been substantially higher than that of men—ranging from 5.9 (2008) to 11.3 (2000) percentage points. Ultimately, however, the 13-percentage-point difference between women’s and men’s support for Hillary Clinton in 2016 proved to be the largest ever. As predicted, a majority of women (54%) voted for Clinton, whereas only 41% of men voted for her. A disaggregation of the voting results by race, however, demonstrated that a more nuanced understanding of the gender gap in 2016 was needed. To be sure, only 43% of white women voted for Hillary Clinton, compared to 94% of black women. Among male voters, 82% of black men and 31% of white men voted for Hillary Clinton. These Election Day results suggest that the gender gap in 2016 actually was driven by an interracial divide between black women and white men.
What is the source of this interracial gender gap? I argue that the increased salience of race in the Age of Obama exacerbated the already deep divisions between blacks and whites on political evaluations. Coupled with an increase in black women’s political engagement, this has driven black women and white men farther from one another politically. Using data from the 2016 American National Election Study (ANES) Time Series Study merged with the ANES Cumulative Data File (1948–2012), I examined the predictors of the gender gap and the circumstances under which an interracial gender gap can be narrowed. The results suggest that this racialized gender divide is not easily bridged, even when black women and white men hold the same policy positions.
A RACIALIZED GENDER GAP
Although currently a widely examined phenomenon, the gender gap is a relatively new addition to the study of American politics. Early seminal works on public opinion and voting behavior (e.g., Berelson, Lazarsfeld, and McPhee Reference Berelson, Lazarsfeld and McPhee1954; Campbell et al. Reference Campbell, Converse, Miller and Stokes1960) found little or no evidence of differences between men and women in their candidate preferences. It was not until the 1980 presidential election that pundits and scholars observed the emergence of small but persistent gender differences in candidate preferences (Frankovic Reference Frankovic1982; see also Kaufmann and Petrocik Reference Kaufmann and Petrocik1999). Political scientists’ fascination with the gender gap began with the initial observation that Ronald Reagan was able to secure a larger proportion of the male vote than the female vote. Since then, survey data demonstrated that as far back as 1964, women have maintained a general proclivity to be more aligned with the Democratic Party whereas men have moved steadily toward the Republican Party (Kaufmann Reference Kaufmann2006).
Little is known, however, about the extent to which minority voters contribute to an overall gender gap in candidate preference. Most of the empirical knowledge in this area has focused on either general differences between men and women or exclusively on white populations. There are a few exceptions. For instance, using exit-poll data from the 1980s, Welch and Sigelman (Reference Welch and Sigelman1992) identified a gender gap in partisanship and vote choice among blacks and Latinos equivalent to that of whites. In an examination of 1984 and 1988 presidential-primary support for Jesse Jackson, Norrander (2003) also found evidence of a gender gap in which black women lent greater support to Jackson than black men—but only in states where black women turned out at higher rates than white women. Conversely, Lien (1998)—using a 1995 Washington Post poll that featured sizable oversamples of minority populations—found limited evidence of a gender gap among blacks, Latinos, and Asian Americans in their support for Bill Clinton or the Democratic Party. More recently, Black’s (2004) examination of Southern partisanship illustrated an 8-percentage-point gap between black women and black men. Bejarano (Reference Bejarano2014) also noted a growing gender gap in partisanship and vote choice among Latinos since 2008. Nevertheless, none of these studies can account for the more recent changes in racial politics that contribute to an interracial gender gap between blacks and whites.
Thus, I argue that the Age of Obama racialization of politics exacerbated a gender gap between black women and white men by making race more salient and by exploiting preexisting differences about racial issues.
THE GENDER GAP IN THE AGE OF OBAMA
So how did this racialized gender gap originate? I argue that the interracial gender gap observed in 2016 is part of a larger trend. The election of the nation’s first black president in 2008 ushered in a new phase in American race relations. Politics in the Age of Obama has become heavily racialized, and racial considerations are now more salient in the minds of voters (Block Reference Block2011; Tesler and Sears Reference Tesler and Sears2010). Obama’s presidency—as well as highly publicized accounts of racialized police brutality, the Black Lives Matter Movement, and the racial undertones of the 2016 presidential election—has kept race in the forefront of American politics in recent years (Edwards and Harris Reference Edwards and Harris2016; Hawley Reference Hawley2017). Thus, I argue that the Age of Obama racialization of politics exacerbated a gender gap between black women and white men by making race more salient and by exploiting preexisting differences about racial issues.
The basis of this argument rests partially on the historic positioning of black women, who find themselves politically marginalized by both their gender and their race (hooks 1981; King Reference King1975). Consequently, black women have developed a distinct orientation toward politics separate from that of black men and white women (Gay and Tate Reference Gay and Tate1998; Simien and Clawson Reference Simien and Clawson2004), including a heightened level of political awareness (Baxter and Lansing Reference Baxter and Lansing1983), a greater willingness to seek public office (Darcy and Hadley Reference Darcy and Hadley1988), and a higher propensity to support black female candidates (Philpot and Walton Reference Philpot and Walton2007). Furthermore, black women view themselves as “fighting to overcome the twin barriers of racial and gender discrimination,” which has led to their higher levels of political participation (Baxter and Lansing Reference Baxter and Lansing1983, 108). Given their unique location in American politics and their greater sensitivity to racial politics, I contend that the changing political landscape initiated by the election of Barack Obama will make race more salient to black women than in the past.
I also argue that race will be more salient to white men in the Age of Obama, compared to in the past. Support for this argument is found in experimental research in political science, which repeatedly demonstrates that white men more readily respond to racial cues. For instance, Reeves (Reference Reeves1997) demonstrated that when whites are presented with an account of a fictitious election, there is no difference in their willingness to vote for a candidate described as white over one described as black. When Reeves disaggregated the respondents, however, he discovered that white men are significantly more likely to dislike the black candidate. In their examination of the gender gap, Hutchings et al. (Reference Hutchings, Valentino, Philpot and White2004) also found that white men and women responded differently to racial cues. Whereas support among white men for the Republican Party increased when its presidential candidate adopted a racially conservative position, support for the GOP decreased among white women (Hutchings et al. Reference Hutchings, Valentino, Philpot and White2004; see also Hutchings, Walton, and Benjamin Reference Hutchings, Walton and Benjamin2010).
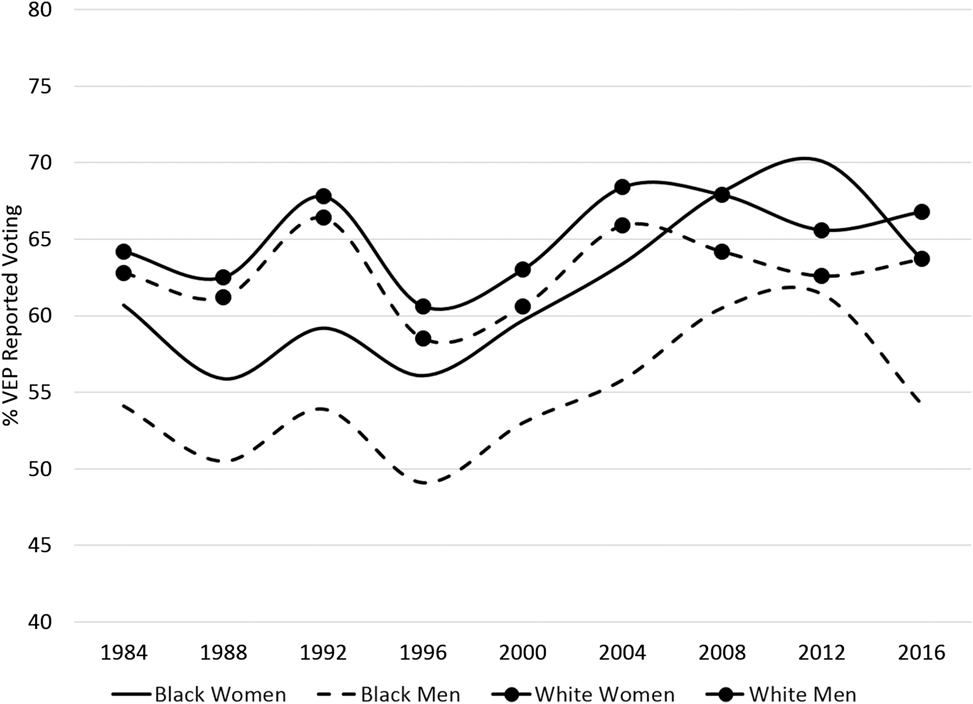
Reviewing voter turnout over time, we see evidence corroborating the proposition that increased racial salience generated a racialized gender gap. The rate at which blacks vote in presidential elections generally lags behind white-voter turnout (for a historical overview of the research on black political participation, see Philpot and Walton Reference Philpot, Walton, Leal, Lee and Sawyer2014). Furthermore, as illustrated in figure 1, black-male-voter turnout is between 5 and 9 percentage points lower than black-female-voter turnout in any given election (compared to a 1-to-4–percentage-point difference between white men and white women).Footnote 1 During the 2008 and 2012 elections, however, black-voter turnout either matched or exceeded white-voter turnout (Bositis Reference Bositis2012). Although turnout for both black men and black women increased during these two elections, it was black-women’s turnout that rose to unprecedented levels: black women constituted 61.5% of the black-vote share (Bositis Reference Bositis2012). Without an African-American candidate occupying the top of the Democratic Party ticket, however, black-voter turnout declined in 2016. Nevertheless, black-women’s turnout during the last presidential election was 9.5 percentage points higher than black men’s. Thus, because white-voter turnout has remained largely stable since 2004, black women have minimized the racial gap in voting.
Voter Turnout, by Gender and Race
Source: US Census Bureau Current Population Survey Voting and Registration Supplements: 1984–2016.
Note: Figure represents self-reported voting rates for voting-age US citizens.
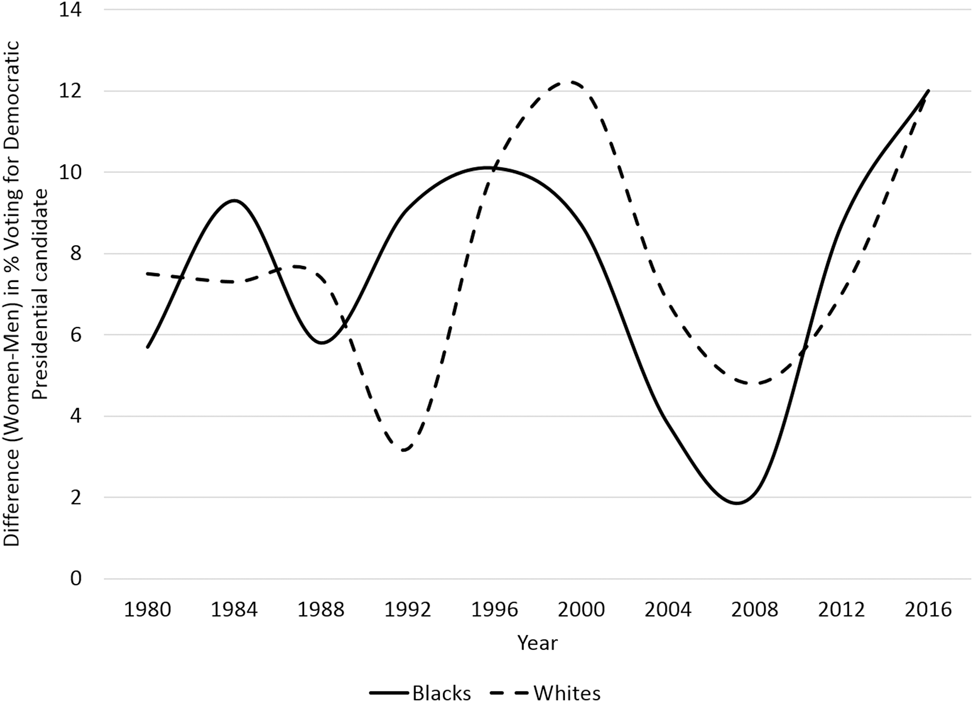
A longitudinal look at intra-racial gender differences in support for Democratic presidential candidates also provides credibility for the central argument of this article. The reversal in the once-diminishing gender gap in recent elections (Kaufmann Reference Kaufmann2006) is significantly more pronounced among blacks than whites (figure 2). Before Obama’s presidency, black-male support for the Democratic Party fluctuated between 78% and 86% (compared to between 88% and 94% among black women). In 2008, both black men (95%) and black women (97%) gave their near-unanimous support to Obama’s election. During the 2012 and 2016 presidential elections, however, black-male Democratic Party support receded to its previous levels, whereas black-women’s support remained at 94% or higher, thereby widening the black gender gap. At the same time, white-women’s support for the Democratic Party in recent elections has been half that of black women (Smooth Reference Smooth2006) but has remained stable in the past two decades. As scholars previously noted, however, a disproportionate number of white men are moving toward the Republican Party (Kaufmann and Petrocik Reference Kaufmann and Petrocik1999; Norrander Reference Norrander1999; Wirls Reference Wirls1986).Footnote 2 White-male support for the Democratic Party’s presidential candidate reached 41.3% in 2008, a modern-day high for this demographic group. However, their support fell to 35% in 2012 and then dwindled to 31% in 2016, constituting the lowest level in more than 30 years. Therefore, the observed gender gap in support for the Democratic Party in recent presidential elections indeed was a result of the overwhelming support from black women and the underwhelming support from white men.
Therefore, the observed gender gap in support for the Democratic Party in recent presidential elections indeed was a result of the overwhelming support from black women and the underwhelming support from white men.
Gender Gap in Voting for Democratic Presidential Candidates, by Race
Source: Exit Polls: CBS News/New York Times (1980–1988); Voter News Service (1992–2000); National Election Pool (2004–2016). Exit-poll data are exclusively obtained from Edison Research, which reports an average margin of error of +/-3% for a national exit poll.
Note: Figure represents the weighted mean difference between women’s minus men’s self-reported support for the Democratic presidential candidate in each election.

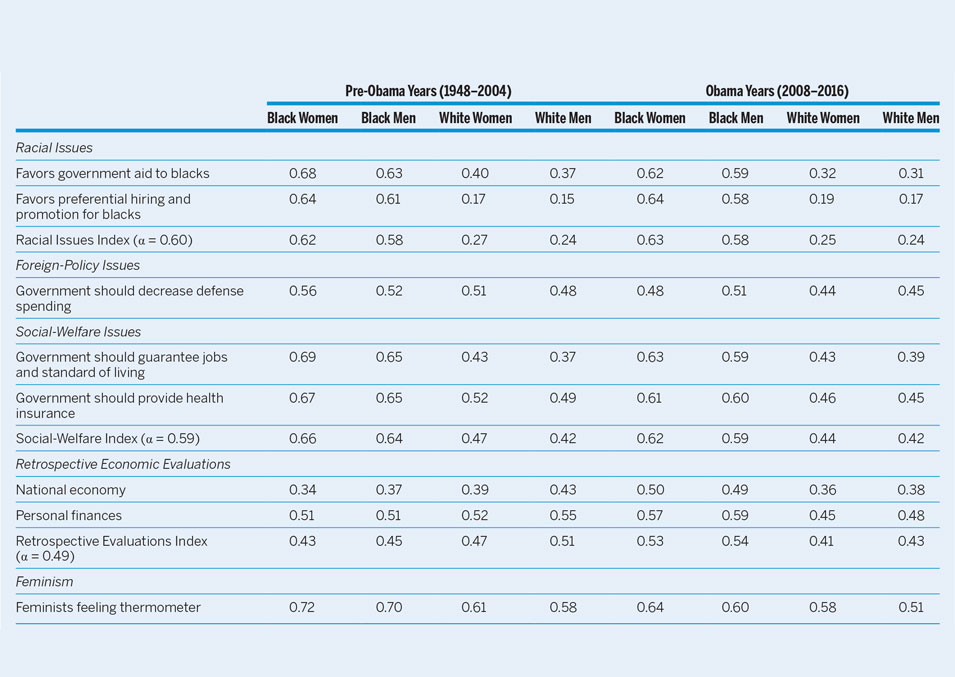
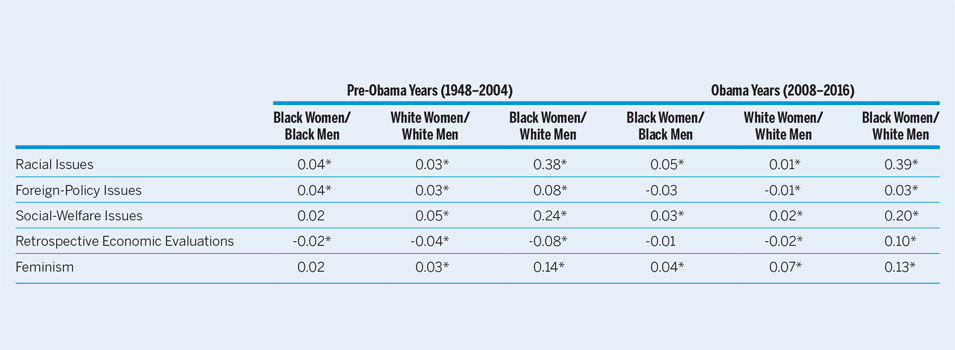
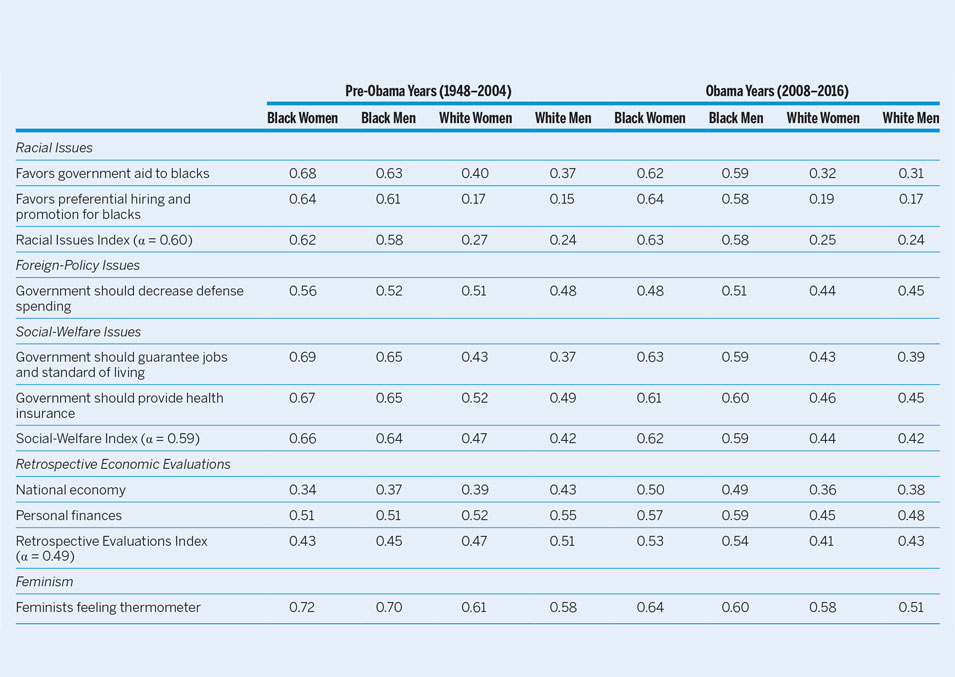
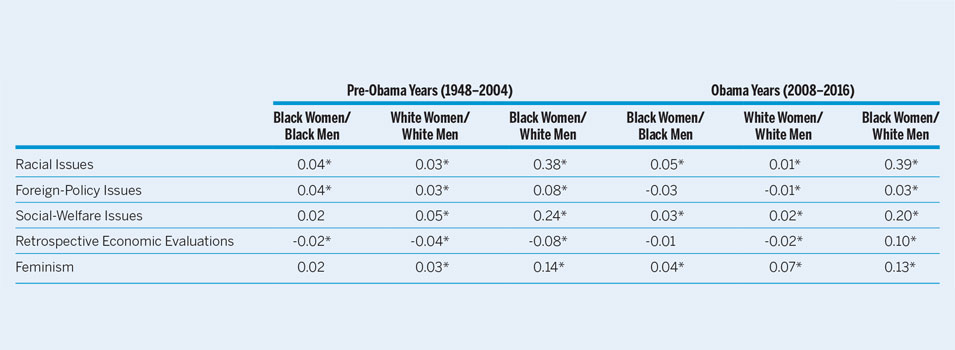
Using survey data from the ANES Time Series Cumulative Data File and the ANES 2016 Time Series Study (ANES 2010; 2016), the role of race in the Age of Obama gender gap can be determined. The argument is that the heightened salience of race in the past decade intensified the already deep-rooted divisions between blacks and whites (Kinder and Sanders Reference Kinder and Sanders1996; Kinder and Winter Reference Kinder and Winter2001; Schuman et al. Reference Schuman, Steeh, Bobo and Krysan1997), causing a racialized gender gap. For these analyses, comparisons were made between the pre-Obama years (1948–2004) and the Obama years (2008–2016).Footnote 3 In addition to exploring attitudinal differences on racial issues, table 1 presents gender and racial differences in sources of the gender gap previously identified by the extant literature. This includes foreign-policy attitudes (Frankovic Reference Frankovic1982; Gilens Reference Gilens1988; Wilcox, Ferrara, and Allsop Reference Wilcox, Ferrara and Allsop1993); social-welfare policy preferences (Kaufmann and Petrocik Reference Kaufmann and Petrocik1999; Shapiro and Mahajan Reference Shapiro and Mahajan1986); retrospective economic evaluations (Chaney, Alvarez, and Nagler Reference Chaney, Michael Alvarez and Nagler1998; Welch and Hibbing Reference Welch and Hibbing1992); and feminist ideals (Conover Reference Conover1988; Cook and Wilcox Reference Cook and Wilcox1991; Howell and Day Reference Howell and Day2000).Footnote 4 The racial-issues measure combines respondents’ support for government aid to blacks with their support for preferential hiring and promotion for blacks. The foreign-policy measure represents respondents’ support for decreased defense spending. The social-welfare measure is an additive index that combines respondents’ support for the government guaranteeing jobs and a minimum standard of living and support for the government providing health insurance. The retrospective-economic-evaluations measure combines respondents’ self-assessment of their personal finances during the past year with their sociotropic evaluations of the national economy also in the past year. Finally, the “feminists” feeling thermometer measured the respondents’ level of feminism. The evidence presented in table 1 suggests that intra-racial differences were minimal. Among blacks during the pre-Obama years, women were slightly more liberal on racial and foreign-policy issues and more pessimistic about the economy. There were no statistically significant gender differences on the other two issues. During the Obama years, black women were still more liberal on racial issues but are now slightly more liberal on social-welfare issues (3 percentage points) and more feminist (4 percentage points). During the pre-Obama years, white women were more liberal than white men on every issue, more pessimistic about the economy, and more feminist. In the Age of Obama, white women were slightly more conservative (1 percentage point) than white men on foreign-policy issues but remain more liberal on all other issues. With the exception of feminism during the Obama years, the difference between white men and white women on any given issue was 5 or fewer percentage points.
Mean Differences in Political Evaluations between Women and Men, by Race
Sources: American National Election Studies Cumulative Data File, 1948–2012, and American National Election Studies 2016 Time Series Study.
Note: Cell entries represent mean differences (women minus men) on a scale of 0 (most conservative position) to 1 (most liberal position) calculated using subsample means (with appropriate sample weights applied) presented in table A1 in the appendix. Starred differences are statistically significant at the p<0.10 level (two-tailed test).
In contrast, interracial differences between black women and white men were relatively significant. As expected, the largest gaps between black women and white men were the 38- and 39-percentage-point differences on racial issues during the pre-Obama years and Obama years, respectively—with black women being more liberal on these issues. Black women also were significantly more liberal on social-welfare issues (i.e., 24 percentage points during the pre-Obama years and 22 percentage points during the Obama years). Black women were 8 percentage points more pessimistic about the economy than white men during the pre-Obama years but 10 percentage points more optimistic during the Obama years. Finally, black women were more feminist and more liberal on foreign-policy issues during both periods. In all areas examined, the observed differences between black women and white men were statistically significant.
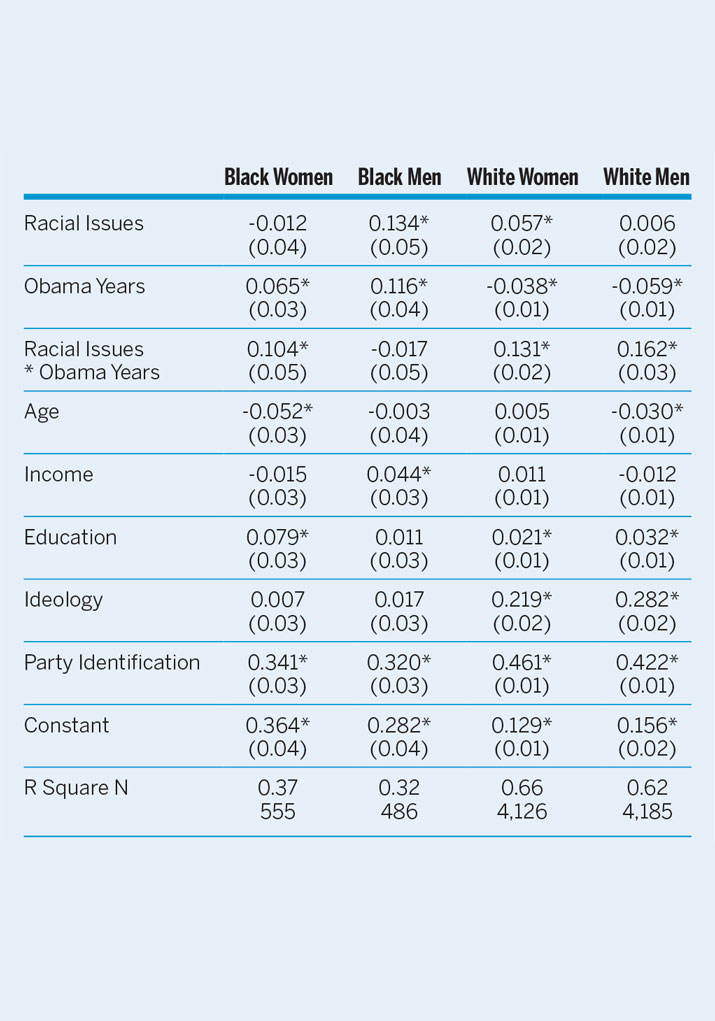
Given that the differences between black women and white men on racial issues were vastly larger than any other factor, the next set of analyses examined how the differential salience of race before and during the Age of Obama heightened the effect of these attitudinal differences on candidate preference. Candidate evaluations were modeled by race and gender, controlling for attitudes on racial issues, as well as pre-Obama versus Obama years, ideology, party identification, age, income, and education. The interaction between racial issues and pre-Obama versus Obama years also was included to discern whether racial issues became more salient in candidate evaluations post–Obama’s election. Because there was not sufficient variance in vote choice among blacks, it could not be used as the dependent variable. Instead, an alternative in which the Republican Party’s presidential candidates’ feeling thermometer were subtracted from the Democratic Party’s presidential candidates’ feeling thermometer was used (table 2). The coefficient on the racial-issues variable indicates that in the pre-Obama years, this factor was salient only among black men and white women. For both groups, being more liberal on racial issues translated into greater support for Democratic presidential candidates.
The Salience of Racial Issues to Candidate Evaluations, Race and Sex in 2016

Sources: American National Election Studies Cumulative Data File, 1948–2012, and American National Election Studies 2016 Time Series Study.
Note: Cell entries represent OLS regression coefficients with sample weights applied. Standard errors are in parentheses. Starred values are statistically significant at the p<0.10 level (two-tailed test). Candidate evaluations are scaled from 0 (prefers Republican candidate) to 1 (prefers Democratic candidate). Racial issues are coded on a scale of 0 (most conservative position) to 1 (most liberal position).
Considering the interaction between racial issues and the Obama years, race remained salient for black men but no more so than during the pre-Obama period. The salience of race for white women, conversely, was compounded during the Obama years. Finally, the interaction terms in the black-female and white-male models were statistically significant, indicating that whereas racial issues were not salient to candidate evaluations during the pre-Obama years, they were salient after his election.
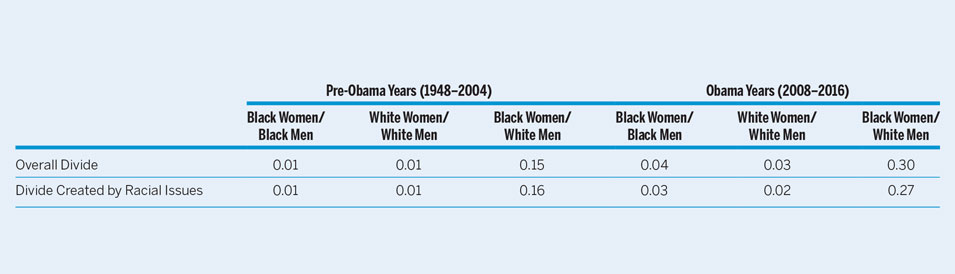
To substantively illustrate the relative weight of racial-issue salience on the gender gap, differences between men and women were calculated by substituting a subsample’s mean racial-issue position (see table A1 in the appendix) in its respective model. This further demonstrated that the intra-racial divide between men and women was relatively small during both periods. This was not true of the interracial divide between black women and white men. During the pre-Obama years, the divide was 15 percentage points; it increased to 30 percentage points during the Obama years. Similar to Kinder and Winter’s study (2001), table 3 presents a set a simulations that examined the extent to which the gender gap disappears when differences in racial-policy positions dissipate. To this end, the regression coefficients in table 2 were used to predict the gender gap when women have the same mean racial-issue positions as men. Generally speaking, when men and women have the same positions, their differential weighting of the issues has little influence on the intra-racial gender gap—which already was small. The gap between black women and white men in candidate evaluations, however, remains the same, even when they are assumed to have the same positions on race.
From 2000 to 2008, there was a significant downward trend in the gender gap. In the post–Age of Obama, however, there is a trend reversal because differences between men and women are beginning to increase again. Furthermore, an examination of the gender gap by race illustrates that its widening is as significant among whites as among blacks in recent elections.
The Gender Gap in Candidate Evaluations under Hypothetical Conditions

Source: American National Election Studies Cumulative Data File, 1948–2012, and American National Election Studies 2016 Time Series Study.
Note: Overall divide calculated by using subsample average values for independent variables and coefficients from table 2. Racial-issues gender divide calculated by substituting male averages in the female models.
CONCLUSION
From 2000 to 2008, there was a significant downward trend in the gender gap. In the post–Age of Obama, however, there is a trend reversal because differences between men and women are beginning to increase again. Furthermore, an examination of the gender gap by race illustrates that its widening is as significant among whites as among blacks in recent elections.
Another important feature of the gender gap in the Age of Obama is how intertwined it is with the racial divide. Racial divisions in public opinion on national policy are well documented (e.g., Kinder and Winter Reference Kinder and Winter2001). However, how black women—a highly and increasingly politicized group within the American electorate—contribute to the racial divide is understudied.
In anticipating the next presidential election and beyond, these findings suggest that political parties must develop a more nuanced approach to appealing to voters. Indeed, one lesson learned from the 2016 election is that there is no such thing as “the women’s vote.” Instead, parties and candidates must think about how women of different races and ethnicities have mobilized behind various policies, causes, and issues. Campaigns then must micro-target women based on these issues instead of developing a “one-size-fits-all-females” strategy.
Appendix
Mean Differences in Political Evaluations between Women and Men, by Race