A critical question for the study of politics is whether particular variables of interest, such as parties, electoral coalitions, institutions, ideologies, public opinion, government policies and expenditures, are locked into a long-run equilibrium or instead are subject to periodic instabilities and disturbances that overturn and realign the existing order. This tension between stability and change, or between order and disorder, is integral to how political systems attend to and prioritize specific issues or problems. Recently, there has been growing interest within political science in systematic measurement and analysis of change and stability in political systems, such as in the punctuated equilibrium model of agenda setting or in the population ecology model of interest mobilization.Footnote 1 Yet the concept of equilibrium is implicit to many accounts of the functioning of political systems through frequent use of terms such as gridlock, stasis and incrementalism, on the one hand, whereas notions of change or instability often underlie studies of electoral realignments, institutional reform, democratic responsiveness and international conflict on the other. Often, such accounts tend to overstate the degree of either stability or change when the reality lies somewhere between the two, with periods of stability interspersed by occasional dramatic changes.
These systematic approaches to the study of political dynamics provide a new perspective on the classic conundrum: how stable is the policy agenda in Britain? The existing literature presents a divergence of views. One group of studies concludes that the decision-making agenda is relatively stable and incremental.Footnote 2 The executive assigns regular attention to particular topics in line with the departmental and budgetary priorities of government. This pattern of policy making reflects the closed nature of the interest-group system, long-entrenched institutional rules and power of the state to insulate itself from external pressures. For others, the British political system can be unstable, generating policy reversals, discontinuities and disasters,Footnote 3 which arise from ministerial entrepreneurialism, adversarial politics,Footnote 4 and the absence of constitutional checks and balances. The result is leaps in attention to particular issues, new initiatives and subsequent reversals of policy. This divergence of perspectives appears in accounts of the Conservative governments elected in the period since 1979. Some studies regard these periods of office as a dramatic shift in policy making, while others highlight the more incremental and pragmatic character of policy changes enacted during the same period.Footnote 5
How might it be possible to resolve this stability/instability question? One solution lies in the collection and analysis of reliable time-series data about the attention and priorities of British government, which may be inspected to measure the extent of change or stability. To this end, this article presents findings from a dataset of the content of the King’s or Queen’s Speech – the Speech from the Throne – as a measure of the executive and legislative priorities of British government from 1940 to 2005, coded for the number of references to particular topics.Footnote 6 Using this data, it is possible to consider propositions about the nature of post-war British politics and policy making, such as whether the distribution of change in political attention is punctuated in Britain, as is found in other countries, whether there is fragmentation in the content of the political agenda over time and whether there is a detectable break-point after election of the Thatcher government in 1979.Footnote 7
The study of policy agendas
The political agenda refers to the limited space within which issues receive attention from policy makers and opinion formers, such as the media, organized interests and the public: ‘the list of subjects or problems to which governmental officials, and people outside of government closely associated with those officials, are paying some serious attention at any given time’.Footnote 8 While the literature on agenda setting is diverse,Footnote 9 the policy-agendas approach has generated an extensive programme of research based upon its systematic categorization and coding of measures of political attention and the policy outputs of government.Footnote 10 This literature also sets out theoretical propositions about the nature of modern policy-making systems, in particular the nature of change over time.
The foundation of this approach is the seminal Agendas and Instability in American Politics,Footnote 11 which challenges the classic view that institutional gridlock (i.e. the divided partisan control of the legislative and executive branches) in the United States generates a pattern of decision making that is biased towards incremental adjustments of the status quo.Footnote 12 Because the attention of policy makers is finite and there are numerous issues or problems on the political agenda, decision making is bounded and incremental strategies provide a means of making policy. However, Baumgartner and Jones also observe that long periods of incrementalism and relative inertia in politics and decision making are sometimes punctuated by rapid and dramatic realignments.Footnote 13 The punctuated equilibrium model attempts to explain why policy making can move from periods of stability to acute change and then back to stability once again.Footnote 14 These punctuations in the political agenda result from tension between sub-system politics, with its institutionalization of policy making within particular sectors, and the more responsive macro-politics, where shifts in attention from legislators or executives at the national level can help mobilize support for an issue and bring about policy change.Footnote 15
Periods of incrementalism or near stasis occur when policy making is contained within a policy sub-system, consisting of a monopolizing set of institutions and actors that tend to share a common definition of the core issue or policy problem. The sub-system exerts a form of negative feedback that dampens pressure for change.Footnote 16 However, issues can be forced onto the macro-political agenda when there is a breakdown of an established policy monopoly or a change in the definition of an issue. Through a process of positive feedback, expansion of the political agenda propels public policies to new equilibria.Footnote 17 This process of amplification, as issues are shifted from sub-system politics onto the macro-political level, overcomes the cognitive and institutional friction that is inherent to government.Footnote 18 Through this set of arguments, the punctuated equilibrium model seeks to explain the coexistence of incrementalism with disproportionate changes or punctuations in the political agenda.
Following Agendas and Instability, Baumgartner and Jones tested their model through systematic and extensive coding of the policy-making agenda in the United States, including congressional budgets and hearings, Congressional Quarterly Almanac stories, presidential executive orders, New York Times, public opinion and congressional bills and laws.Footnote 19 The Policy Agendas Project compiled a definitive topic codebook for its policy content coding framework, which created codes for the major aspects of public policy, such as macroeconomic issues, education and health, and distinct sub-topics within these categories, which now number 225 topics (see Table 1 for the major topic codes).Footnote 20
Major Topic Codes from the Policy Agendas Project

Comparative scholars use the theory and methods of the Policy Agendas Project to generate and test hypotheses about the nature of policy making in different institutional and cultural contexts.Footnote 21 Most of this research directly applies the coding framework to national politics and policy making. More often than not, researchers find that the framework works well, although there are certain aspects of the institutional system in the United States that have no direct parallel in other countries. The constitutional prominence of its legislature means that some procedures that are classed as legislative are part of executive policy making elsewhere. Another important difference is that the less developed welfare state in the United States requires reclassification of a few sub-topics.
Punctuated equilibrium and policy making in Britain
Many accounts of post-war British policy making emphasize the relative stability of its policy-making communities.Footnote 22 These communities or sub-governments tend to be isolated from the media and public opinion, often constraining rapid or far-reaching changes to the policy agenda as implied by the punctuated equilibrium model. Other studies of the outputs of British government reach similar conclusions, such as for budgeting.Footnote 23 Policy outputs tend to shift in small increments and the termination of programmes is rare. The traditional Westminster–Whitehall system was sustained by a set of informal restraints and conventions – what has been called ‘club government’.Footnote 24 Over several centuries, the integrated London elite survived through its enactment of pragmatic and effective responses to policy problems.Footnote 25 The collegiate traditions and club-like instincts of the British policy-making elite promoted a closed and secretive style of government. This culture contrasts with the pluralist character of US politics in Washington, which Heclo termed the government of strangers.Footnote 26 The practice of accommodating interest groups and the Downsian pressure on political parties to gravitate towards the median voter reinforces this pattern of stable adaptation. Beyond the institutions of government, British politics was supposed to be rooted in a consensual political culture and a moderate public opinion that resisted radical political movements and ideologies.Footnote 27
Such accounts of British policy making have themselves been subject to criticism. Scholars adopting the policy-network approach argue that some policy communities have opened up as a result of increased media coverage and challenges to the political consensus, leaving British policy making more volatile and diverse than before.Footnote 28 Conventions of governing according to Britain’s flexible but embedded constitution have weakened, partly as a result of a series of institutional experiments that eroded local government autonomy and integrated decision making with European institutions.Footnote 29 The reform and decentralization of the institutions of the modern British state, with the devolution of power to governments in Scotland, Wales and Northern Ireland, has also created new venues for policy making and increased diversity in national policy outputs.Footnote 30
Some argue that the agenda of British politics is unstable. The first-past-the-post electoral system is claimed to generate periods of ‘elected dictatorship’.Footnote 31 The two-party system produces long-term instabilities in public policy because one centralized party can govern in office free of constitutional checks and balances on the basis of holding a majority of seats in the House of Commons.Footnote 32 A newly elected government can reverse the actions of its predecessors and impose its own policies on the section of society that did not vote for it. The comparative literature tends to regard the Westminster–Whitehall system as non-inclusive in contrast to the consensual characteristics of democracies with proportional representation electoral systems.Footnote 33 There are few veto points in British politics,Footnote 34 meaning that executives are freer to decide and enact their policies than elsewhere. Some suggest that Britain is the home of policy disasters, such as in local taxationFootnote 35 and large information technology projects,Footnote 36 which emerge as a result of relative freedom of the executive to make policy choices, often unchecked by much scrutiny in parliament. At the same time, the transformation and reinvention of the governing institutions of the modern British state – what Moran calls hyper-innovation – contrast with an earlier period of stagnation.Footnote 37 This dramatic shift resulted from a crisis in the economic policies, loss of confidence in political institutions and the decline of the once stable world of club government. The idea of policy punctuations is more consistent with this account of the British political agenda than incrementalism. Indeed, the distribution of budget changes in Britain is punctuated.Footnote 38
The British electoral system tends to be associated with unified control of government, meaning that changes in the plurality party in parliament are expected to generate policy changes, which studies of party manifestos demonstrate.Footnote 39 There is a straightforward chain of cause and effect: shifts in voter preferences translate into party platforms that in turn produce changes in the outputs of government, such as public expenditure.Footnote 40 It might therefore be expected that policy pronouncements would reflect partisan shifts, perhaps more than budgets. Earlier research, however, claims that political parties did not make much of a difference to the policies and outputs of British post-war governments.Footnote 41
Regardless of these negative findings, political scientists are inclined to see partisan control of the powerful executive as the cause of breaks or turning points in the political agenda. For example, some argue that the general election of 1979 represented a watershed in British politics, after which the Conservative governments led by Margaret Thatcher enacted right-wing public policies that made fundamental changes in Britain’s society and economy.Footnote 42 This period of government is associated with prioritization of economic reform along with a new focus on social issues like crime and the family, which some term authoritarian populism.Footnote 43 For others, Thatcher’s leadership was more pragmatic and incremental as the government set about a gradual process of reform and realignment.Footnote 44 That debate continues.Footnote 45 An alternative view is that the rise of New Labour in the 1990s, through its transformation as a centrist party more closely focused on competition for the median voter, represents a turning point in modern British politics. The emergence of a post-Thatcherite consensus between the major political parties over economic policy contributed to agenda expansion as Conservative and Labour governments competed over the issues of health, education and crime in particular. If such a claim is correct, some date during the early or mid-1990s may represent a turning point in the post-war British political agenda.
If the theoretical basis to the punctuated equilibrium model is correct, dramatic changes in the British political agenda would be expected to occur because of the way in which all political systems dampen pressures for agenda change but are nonetheless subject to brief periods when issues attract an increased amount of attention and policy problems are redefined and addressed. However, there is a disjunction between the predictions of the punctuated equilibrium model and existing accounts of the instability of politics and policy making in Britain. The classic account of British government policy making focuses upon the relative absence of veto points in the political system as a cause of instability, whereas the agenda-setting model of Jones and Baumgartner stresses the presence of friction, with veto points being the cause of instability. It might therefore be argued that the classic Westminster–Whitehall model entails friction without veto points as its oligarchic political and bureaucratic elite proved resistant to change while retaining extensive power over the system of government itself. This informal tradition of club-like government could be a source of policy stability and punctuations, which differs from the institutional causes of gridlock observed in the United States. The alternative is that the friction model does not provide an adequate explanation and that the relative absence of checks and balances in the British political system provides a more convincing explanation of periods of dramatic policy change and instability.
Hypotheses
The punctuated equilibrium model is able to integrate alternative perspectives about the historical development of British politics and policy making. In particular, it provides a means for determining the degree of stability and change in the evolving priorities of the British state, with the incrementalism of the collegiate Westminster–Whitehall system – punctuated by periods of radical change, innovation, differentiation and reform enabled by the lack of checks and balances governing those same policy communities at the heart of government. The presence of punctuations in the post-war British policy-making agenda might, furthermore, indicate breaks or turning points, such as those associated with changes in partisan control of government capturing wider shifts in the political mood like, for example, the election of the Conservative government in 1979.
This analysis therefore considers a set of theoretical propositions: first, about whether the distribution of changes in the political agenda is punctuated in Britain; secondly, whether there is change over time in the spread of the content of the political agenda; and, thirdly, whether partisan factors, such as particular elections, governments or prime ministers, represent breaks or turning points over time. Those propositions are represented below as hypotheses:
HYPOTHESIS 1: The punctuated equilibrium model: the general distribution of shifts in the political agenda is a non-normal, leptokurtic distribution.
HYPOTHESIS 2: The entropy model: the relative concentration or fragmentation of the political agenda reveals particular trajectories or turning points in policy-making attention in British post-war politics.
HYPOTHESIS 3: The partisan model: major punctuations in, and/or the entropy of, political attention are influenced by partisan factors, such as general elections, changes in government and the policy style of particular prime ministers.
In the analysis that follows, these propositions, styled as H1, H2 and H3, are each tested against the null hypothesis (H0) of non-significance using a number of different statistical methods.
Data and methods
The Queen’s Speech and the Political Agenda
In many political systems the head of state delivers, on behalf of the executive, an annual formal statement of the proposed legislative programme of the government, which helps set out the policy agenda for the forthcoming year. In Britain, such a convention takes the form of the ‘Speech from the Throne’ (also known as the ‘Gracious Speech’) – the King’s or the Queen’s Speech – which reports the programme of legislative measures that the government intends to enact in the next session of parliament as well as providing more general statements about executive priorities. Researchers have used the speech as a measure of policy-making attentionFootnote 46 and political-cultural dynamics,Footnote 47 just as with the State of the Union address in the United States.Footnote 48 There is evidence of a close link between manifesto pledges and legislative proposals of governing parties and policy outputs.Footnote 49 The speech can also indicate the priorities of policy makers in domains, such as international affairs, where legislation does not always signal changes in outputs.
Of course, the content of the Queen’s Speech does not represent the sum of the executive agenda, such as deliberation in cabinet and its subcommittees, or the extent to which individual ministers pursue specific policies, or how departments, agencies and local government implement these measures. The policy agenda advanced in the Queen’s Speech can, therefore, remain stable while there is significant change elsewhere. For instance, it does not tend to address decisions made through statutory instruments. The legislative content of the speech might sometimes not reflect the salience of prominent issues on the national political agenda (for example, intense public debate over the Iraq War from 2002 to 2003 is not reflected in the degree of attention to international affairs in the Queen’s Speech). Nor does the Policy Agendas coding system measure the exact character of policy tools or instruments, such as whether these were market-based, which often reveals significant distinctions between the policies of governments.
Nevertheless, the Queen’s Speech is a robust aggregate-level measure of policy-making attention in Britain. Decision making about its content represents an important phase of the British political cycle. The speech provides a high-profile signal, at a particular point in time, of the priorities of the core executive to parliament, to governing and opposition parties, to interest groups, to the media and to the public. Because of the limited amount of legislative time available, the executive has to prioritize its agenda for the forthcoming session of parliament, including topics that it considers to be urgent. Some elements of the legislative programme might be included in response to specific crises, media coverage or spikes in the level of public attention, whereas others might entail routine business and gradual implementation of manifesto commitments through the four or five speeches that occur, on average, over the lifetime of a government. The standardized coding of the content enables this analysis to determine which topics the government concentrated on, whether these changed over time, and at what rate.
The project analysed the full text of the Queen’s Speech at the quasi-sentence level according to a version of the policy agendas coding framework adapted for Britain.Footnote 50 The transcripts of the speech were blind-coded by two researchers who compared and reconciled their responses; first, to ascertain whether each quasi-sentence contained any policy content and then, using the original codebook from the United States, to assign a major topic code and sub-topic code to each quasi-sentence. This procedure led to 90 per cent inter-coder reliability for most years. The coders resolved the remaining differences through discussion and the project leaders made the final decision in the few cases where coders could not agree. Most of the British major topic codes are consistent with the original codebook, with a few minor adjustments of sub-topics.Footnote 51
Trajectories of the Political Agenda in the United Kingdom, 1940–2005
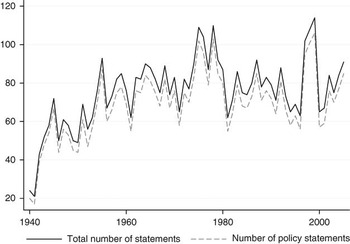
Figure 1 presents the total number of statements and policy statements contained within each speech. This shows the increasing volume of policy content in the 1940s and 1950s as governments got back into their stride after the Second World War, but no clear upward or downward trend thereafter. The basic constitutional, political and policy-making function of the Queen’s Speech does not appear to have changed much over time.
Number of policy statements in the Queen’s Speech, 1940–2005

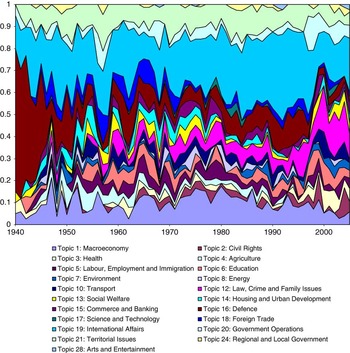
There are elements of both stability and change in attention to the major topics presented in the area graph in Figure 2. The value for each policy topic is assigned a percentage of attention by the executive at any one time, so as one topic rises on the political agenda, the amount of attention for all other topics falls. The observed trends in the content of the speech tend to reflect the conventional wisdom about the rise and fall of certain issues on the policy-making agenda in Britain. For example, there was a gradual expansion of government attention to macroeconomic issues, Topic 1, over the period between 1940 and 1980, with a contraction afterwards. The low ranking of health, Topic 3, persisted until the 1980s, but increased from then on. For defence, Topic 16, the decline of government attention in the period immediately after the Second World War was followed by a relative stabilization after the 1960s. For law and order, Topic 12, escalation of the importance of crime on the political agenda emerged after the 1970s. There is no obvious partisan dimension to trajectories of the British political agenda. Nor is there any evidence of synchronization with the timing of general elections that might suggest a political business cycle at work with respect to the policy-making agenda.
The policy content of the Queen’s Speech, 1940–2005

Results
This article next presents the results of a series of diagnostic tests that investigate how the properties of the policy agenda change over time. Are there punctuations in policy-making attention in Britain? Does the allocation of attention to particular topics become more or less concentrated over time? This analysis uses measures of agenda distribution (kurtosis, semi-log and log-log plots) and concentration/diffusion (entropy scores), which follow the methods of other studies.Footnote 52
Punctuations in British Politics and Policy Making
The punctuated equilibrium model implies a leptokurtic distribution of policy change or outputs, which can be measured with a kurtosis statistic.Footnote 53 The expected properties of these distributions correspond to the theoretical expectations of H1, the punctuated equilibrium model. When compared against the normal (Gaussian) distribution, those with positive kurtosis (i.e. leptokurtosis) have a large, slender central peak to correspond to extended periods of incrementalism or near stasis; weak shoulders to reflect the relative lack of moderate change; and fat tails that represent the disproportionate occurrence of extreme infrequent disturbances (i.e. punctuations). Indeed, the distribution of budget changes is leptokurtic in the United States and elsewhere.Footnote 54 There is also evidence that the leptokurtosis of output distributions becomes more and more severe as the level of institutional friction increases through subsequent stages of the political system.Footnote 55 Measurement of the normality of the political agenda can, therefore, indicate the extent to which British politics and policy making might be characterized by either incrementalism or change. It assists inferences about the degree of friction that exists in the institutions of British government.Footnote 56
The base measure of the political agenda is the percentage (at the quasi-sentence level) of the Queen’s Speech assigned to a particular topic. This treats the agenda space as constant through time. There is no potential for growth or inflation in the political agenda, unlike budgets, because this measure is bounded. Although subject to some fluctuations (see Figure 1), the volume of policy content in the Queen’s Speech tends to be stable over time. The distribution of changes in the frequency of mentions of topics is, therefore, similar to that for the proportion of attention. For this analysis, change scores are equal to the percentage change in the percentage share of the Queen’s Speech for each year for each topic in turn. For twenty-one major topics over the period between 1940 and 2005, this generates a total distribution consisting of 1,365 observations of percentage changes. The number of observations reduces to 997, because those cases where policy-making attention remains stable at zero are treated as missing to avoid false acceptance of H1 due to empirical redundancy of some topic codes.Footnote 57
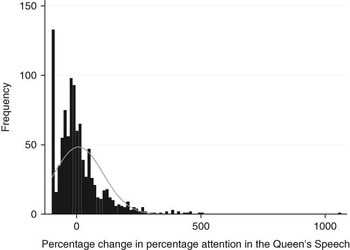
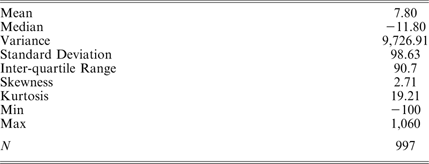
An inspection of the distribution of annual percentage change in the executive’s attention to particular policy topics in the Queen’s Speech, plotted against a hypothetical Gaussian distribution with an identical mean and variance (Figure 3), indicates that changes in the policy-making agenda are not normal but leptokurtic.Footnote 58 The test results reported in Tables 2 and 3 also confirm that percentage change distributions are leptokurtic. The kurtosis score (Table 2) is positive and equal to 19.21. In addition, the Kolmogorov–Smirnov test, which considers whether the sample is drawn from a normal distribution,Footnote 59 generates a D statistic of 0.143 significant at the 99 per cent confidence level (Table 3). However, this test is sensitive to deviations in the tails of the distribution, and therefore is not optimal for the analysis of punctuations. The more powerful Shapiro–Wilk test does not require the mean or variance to be specified in advance.Footnote 60 This generates a W statistic of 0.828, again significant at the 99 per cent confidence level (Table 3). These statistics show that British policy making is sometimes subject to rapid and disproportionate agenda change, similar to other political systems, just as the punctuated equilibrium model (H1) predicts. Punctuations are acute in magnitude in the Queen’s Speech in Britain, though less than in the State of the Union Address in the United States.Footnote 61 This finding does not reflect the lack of veto points in the Westminster–Whitehall system, because there are punctuations despite the relative absence of institutional friction.
Annual percentage change in percentage attention in the Queen’s Speech

Descriptive Statistics for Percentage Change in the Queen’s Speech, 1940–2005

Tests of Normality for the Percentage Change in Percentage Attention based on Raw Data

Estimation of the Underlying Probability Distribution
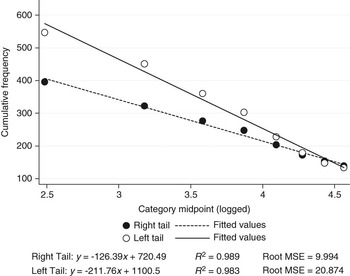
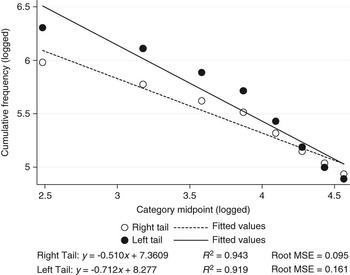
An alternative approach for assessing the distributional properties of the political agenda is to examine the shape of log-log and semi-log plots,Footnote 62 which are drawn from the logged values of the frequencies and the bands of changes. The log-log plot will fit a straight line for a Paretian distribution (that is, for a power-law function), while the semi-log plot will fit a straight line for an exponential distribution.Footnote 63 For a normal distribution, either or both of these data transformations will be curved.Footnote 64 As a rule, the visual inspection of these scatter plots is sufficient to determine which of the transformations best fits the data. However, these plots can also be checked for goodness-of-fit and against the slope of an ordinary least squares regression. The slope of the line provides an additional indicator of the extent of the punctuations, becoming more flat as the data series becomes more punctuated (i.e., when there are more extreme values in the tails of the distribution).
From the estimated plots (see Figures 4 and 5), the distribution of agenda change for the Queen’s Speech is best approximated as a double exponential distribution (Figure 4). The fit is less close for a Paretian distribution, although it might not be rejected outright (Figure 5). Again, this evidence tends to support H1, the punctuated equilibrium model, since the general distribution of change in the political agenda is punctuated and consistent with disproportionate information processing of the sort highlighted in later versions of the model.Footnote 65 The goodness-of-fit measures are superior for the semi-log plots (both R 2 and mean squared error), although the slope of the line of best fit is flatter for the log-log plots. This indicates that there are more disturbances in the tails of the Paretian distribution. These findings are further confirmation that changes in policy-making attention in the Queen’s Speech are punctuated (H1). The priorities at the heart of British government are more often than not stable, but there are also rapid and disproportionate periods of agenda change.
Semi-log plot with a superimposed line of best fit

Log-log plot with a superimposed line of best line

Major Punctuations in the British Political Agenda
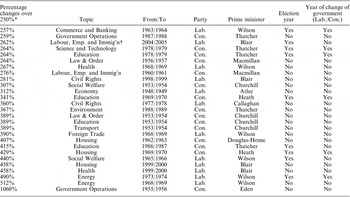
The Queen’s Speech dataset also enables identification of the largest punctuations in the British political agenda over the period between 1940 and 2005. Table 4 reports all those percentage changes in excess of 250 per cent.Footnote 66 This method of presentation illustrates the relative magnitude of change rather than whether a specific topic is high or low on the agenda at a given point in time (which can be observed in Figure 2).Footnote 67 Of the twenty-seven punctuations listed in Table 4, just six coincide with changes in party government while nine coincide with the start of a new parliamentary session. However, because there have been just six partisan changeovers between the Labour and Conservative governments between 1940 and 2005 (not inclusive of the change of government after the wartime national coalition), 22 per cent of the largest punctuations are drawn from 9 per cent of these years. This finding suggests the importance of H3, the partisan model, though further data would be needed to provide a more comprehensive test of this hypothesis.
Major Policy Punctuations in the Queen’s Speech, 1940–2005

*Values, positive tail, in excess of 250 per cent. †Labour, Employment and Immigration.
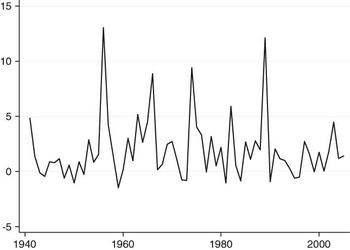
Some of the Queen’s Speeches appear to have been particular watersheds in the political agenda as they contain multiple punctuations. For example, the Queen’s Speech of the Churchill Government in 1954 had four punctuations: in social welfare, law and order, education and transport. Other major punctuations are associated with exogenous shocks to the political agenda. For example, the international oil price crisis of 1973 preceded a 490 per cent increase in the executive’s attention to energy, while the electoral success of the Green party in the 1989 European elections coincided with a 367 per cent increase in attention to the environment in the Queen’s Speech later that year. This pattern is confirmed in Figure 6 where there are noticeable spikes in the kurtosis score of the annual distribution of policy agenda change in 1956, 1966, 1974, 1982 and 1989. Figure 6 illustrates how the degree of kurtosis of the agenda is sensitive to years containing sizeable attention shifts.
Kurtosis score of the annual distribution of change in attention in the Queen’s Speech, 1940–2005

A possible conclusion to draw is that major punctuations in the British policy agenda are a function of exogenous shocks: where changes in the input distribution (i.e. the information that is received and processed by decision makers) are reflected in the subsequent content of the Queen’s Speech (i.e. the output distribution). This means that policy punctuations, as part of the general distribution of agenda change over time, are the product of signals from the external world. This evidence concerning major punctuations in the political agenda might, therefore, contribute to an understanding of the effect of exogenous forces or events in British politics and policy making as well as highlighting the influence of partisan factors, such as elections, governments and prime ministers in setting the content of the political agenda communicated in the Queen’s Speech.
There are a greater number of large-scale punctuations in the political agenda for the Wilson Governments (see Table 4) than for the reforming governments led by Attlee and Thatcher. Moreover, there are a greater number of positive punctuations of the policy-making agenda in the speech of the Churchill Government in 1954 compared with that of the Thatcher Government elected in 1979. One might argue that these findings serve to reinforce claims of the traditional Westminster–Whitehall model regarding the continuities and stabilities that characterize British politics.Footnote 68 Surprisingly, some of the largest positive policy punctuations are observed for some of those governments least associated with dramatic reform or change (e.g. Churchill 1951–55, Eden 1955–57, Douglas-Home 1963–64). This finding also suggests that new data and measures of the priorities of British Government might encourage some reconsideration of established narratives about the activism of particular governments in the post-war period. Of course, it remains quite possible that consistent levels of attention disguise substantial changes in the left–right orientation of policy or policy makers’ preferences for particular tools of government. For example, similar levels of attention to macroeconomic issues for the Callaghan and Thatcher Governments are associated with quite different approaches to economic management. Nonetheless, the results reveal that shifts in political attention are not always discovered where they might be expected.
The Entropy of Political Attention
Our next step in measurement of political attention in Britain focuses upon the character of the agenda as a whole. While punctuations are significant as break points in the degree of attention to specific topics, it is also important to consider whether the general composition of the political agenda changes over time. This analysis can provide an indication of the broader nature of government attention to the spectrum of issue topics covered under the Policy Agendas framework. To measure the degree of concentration or fragmentation of political attention, entropy scores are calculated for the content of the Queen’s Speech across the major topic codes. This measure of the relative concentration or dispersion of data is similar to Herfindahl indices used in other studies of policy agendas and interest-group mobilization.Footnote 69 However, entropy is a more powerful measure for data with low levels of concentration.Footnote 70 An entropy score of zero indicates that attention is concentrated in a single topic, whereas a score of 3.04 indicates that attention is spread across all twenty-one major topics.Footnote 71 Entropy provides a measure of the relative concentration or diversity of policy-making attention across the topics. If government were to concentrate its attention on only a few topics, the entropy score would be low. If attention were instead spread across more of them, the entropy score would be high. When plotted over time, entropy indicates variation in government attention to the range of different topics on the political agenda.
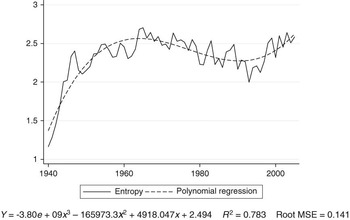
From a visual inspection of Figure 7, it is possible to identify three distinct periods in the entropy of the British policy agenda between 1940 and 2005: the first is wartime and post-war (welfare state creation); the second is the post-1960s (hyper-innovation); and the third is post-Thatcher (economic policy consensus and post-Cold War). There was an expansion of the political agenda throughout the Second World War and post-war period right up to the 1960s as defence ceased to monopolize the attention of governments. This differentiation of the policy agenda might also reflect the process of welfare state creation and diversification of the policy toolkit of modern British government.
Entropy score for the Queen’s Speech, 1940–2005

By fitting a third-order polynomial regression to the entropy time series, it is possible to confirm that the first turning point in the entropy of the post-war British political agenda is identifiable in the mid-1960s, with the first peak of the polynomial in 1964 (2.565).Footnote 72 The first Wilson Government appears to have taken power at the height of the fragmentation of the post-war political agenda. After this, the agenda experienced a period of relative concentration. From the mid-1960s onwards, there was an extended period of decline in diversity of the political agenda in Britain. The principal cause appears to have been the increasing attention of the executive to macroeconomic issues – labour and employment – and international affairs; with inflation, unemployment, strikes and the Cold War (along with international terrorism in the 1970s) becoming the focus of political and public concern. The British political agenda therefore appears to have contracted, rather than expanded, during this period of hyper-innovation and reform.
While it might be expected that the political agenda would tend to become increasingly differentiated over time, the socio-economic conditions of this period (for example, industrial disputes, oil price shocks) prompted a relative concentration of government attention on the economy at the expense of other issues. The tendency for this issue to push other items off the agenda when economic conditions worsen is a cross-national phenomenon.Footnote 73 Thus, the gradual disintegration of post-war economic growth and transition to the ‘ungovernable’ 1970s can be associated with agenda contraction.Footnote 74 This contraction of political attention continued throughout the 1970s and 1980s as successive Labour and Conservative Governments were similarly preoccupied with national economic problems and finding solutions to them.
The second turning point occurred in the early 1990s, after which the agenda started to expand once again. The low point in the polynomial regression is in 1991 (2.274).Footnote 75 This suggests that the demise of Thatcher as leader of the Conservative Government coincided with an expansion of the political agenda. With a relative decline in attention to economic issues, as well as to defence and international affairs, the political agenda once again became more differentiated and diverse. The agenda space, which had been dominated by economic concerns and the Cold War since the 1960s, diversified with increased attention to education, law and order, health, public services and immigration and asylum. This post-Thatcher period signalled a return to a broader focus of government as the main political parties sought to compete on issues other than the economy, defence and international affairs. The agenda continued to expand throughout the 1990s because governments become preoccupied with more policy topics, even during the economic recession under the Major Government. From 1997 onwards, New Labour continued this trend of diversification in attention of policy makers to topics in a more diverse and wide-ranging legislative agenda – either creating or benefiting from it.
In heralding this new era, the end of the Thatcher premiership appears to have been far more significant than the 1979 election as a watershed of the political agenda in Britain. According to this measure of entropy, there is no support for H3. Only after the overthrow of Thatcher and convergence of the Conservatives and Labour on economic policy, with the Exchange Rate Mechanism crisis of November 1992 ending the perceived advantage of the Conservative party on economic management,Footnote 76 did governments turn their attention to other parts of the policy agenda. The fall of Prime Minister Thatcher and rise of New Labour appear to represent a turning point in the modern British political era. From 1991 onwards, the policy agenda diversified, as government spread its attention across a wide range of topics.
The entropy of the policy agenda of the Queen’s Speech reveals distinct eras of post-war British policy making: from welfare state creation to hyper-innovation to post-Thatcherism. This periodization suggests that trends in the entropy of the political agenda are a function of long-term structural, social and economic changes as well as being sensitive to factors in the international environment, such as war or migration. This is a different interpretation of agenda change than the dichotomies that are often favoured in political analysis.
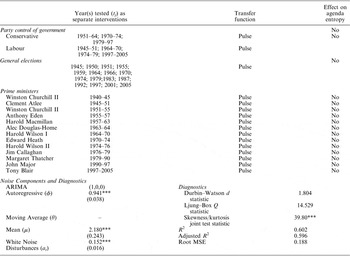
While there are gradual shifts in the entropy of political attention, agenda setting is also subject to shorter-term partisan influences, H3, as well as the effect of prime-ministerial styles and the electoral cycle. Using time-series intervention analysis,Footnote 77 it is possible to estimate the effect of general election years, party control of government and the terms of individual prime ministers on the entropy of the Queen’s Speech (see Table 5). This represents a tough test of H3, since it controls for the inherent dynamics of the entropy measure, which does not appear to undergo dramatic shifts or fluctuations between years (Figure 7). The noise structure of the entropy series is determined to be an ARIMA (1,0,0) process with autocorrelation and partial autocorrelation plots and augmented Dickey–Fuller and KPSS tests for stationarity. This analysis first tests the effect of election years as pulse inputs – interventions with a temporary but instantaneous effect on the entropy score.Footnote 78 It considers whether there is a brief expansion of content of the political agenda in the Queen’s Speech after a general election. These inputs are found to be insignificant at the 95 per cent confidence level. Secondly, the partisan control of government is tested as a pulse input equivalent to a switch that turns on when the Conservative party is in power and turns off when Labour is in power. This input is also found to be insignificant, suggesting that there is no systematic difference in the level of agenda entropy for periods of Conservative government compared with periods when Labour is in office. Thirdly, the influence of prime ministers on the entropy of the Queen’s Speech is also insignificant at the 95 per cent level when tested as a pulse input for the duration of their term of office. This suggests that no single political leader is associated with a more fragmented or concentrated agenda than others. While it is evident that some prime ministers preside over periods of agenda expansion or contraction (see Figure 7), it is possible that these are a function of macro-political trends making it difficult to resolve whether entropy is a function of prime-ministerial agenda setting or not.
Box–Tiao Time Series Intervention Model of Effects of Elections, Party Control of Government and Prime Ministers on Agenda Entropy

*p < 0.05, **p < 0.01, ***p < 0.001 (two-tailed tests) with standard errors in parentheses.
Overall, the findings do not provide support for H3, the partisan model. Controlling for stochastic fluctuations and the autoregressive character of political attention, there are no detectable differences in the level of entropy for Labour and Conservative governments; nor are there spikes during election years or significant differences between the level of entropy for one prime minister compared to that of another. The evidence leads to the rejection of H3, the partisan model, since there is no obvious partisan impact on the relative concentration or fragmentation of the political agenda in Britain as might be translated directly through general elections, party control of government or political leaders. There are no significant changes at the time of the 1979 or 1997 elections. This finding appears to dispel claims that the balance of priorities of the British government changed irrevocably, either with Thatcher or Blair, when they took up office.
Conclusions: British politics and future directions of policy-agendas research
British politics is not an island apart from other political systems in the character of its policy-making agenda. The policy agenda of the Queen’s Speech reveals punctuations, confirming that there are dramatic and disproportionate changes in political attention in Britain, just as in other political systems. Long periods of stability and incrementalism are interrupted by sudden increases or decreases in attention of the executive to particular topics, giving rise to agenda change. Of interest for debate about the impact of institutional friction on changes in policy agendas and outputsFootnote 79 are the results that suggest that British politics is punctuated similar to other political systems rather than less, as the friction model proposes. That finding requires further investigation, though, for venues of politics and policy making other than the Queen’s Speech.Footnote 80
These results also generate insights on some of the classic conundrums of British politics as they apply to the political agenda, such as whether party control of government makes a difference, which it does for punctuations, but not for entropy. Perhaps of greatest significance, the analysis is able to determine the date, direction and magnitude of watersheds or break points in the British political agenda according to the share of attention that the executive assigned to particular topics and the spread of attention across them. The political agenda contains turning points that are driven by the relative dominance of certain issues over the priorities of the executive. For a period after the Second World War, the political agenda diversified but, as the Cold War and economic crises of the 1970s and 1980s deepened, successive governments struggled to attend to issues other than these critical problems. This crowded out the agenda space available for other issues. The critical turning point in post-war British political attention was the post-Thatcher transition, in particular the end of the Cold War and emergence of economic policy consensus among the major political parties, after which the executive enacted a more diverse and fragmented agenda. The long-term decline in importance of international affairs and economic issues opened up space for other topics of public concern. At the same time, the modernization of the Labour party in the 1990s contributed to this process of agenda expansion with its platform of policies on health, education and law and order. The rise of New Labour was, therefore, interdependent with fragmentation of the political agenda in Britain as it either helped create it or benefited from it. As far as fragmentation of the policy-making agenda is concerned, 1991 appears to have been a more significant turning point in British politics than 1979 ever was.
Having challenged some established accounts of modern British politics, what might the policy agendas framework add to its study? First, it provides a measure of the complex and fragmented character of the political agenda and how this changes over time in response to external events and changes in the wider political environment. The policy-making system is not insulated and is influenced by pressures from public opinion, events such as war, and by long-term structural changes, such as a failing economy in the 1970s and disintegration of the British Empire. Within this environment, there are opportunities for political actors, such as political parties or prime ministers, to compete for control over the political agenda and shift it to other issues. However, as the policy agendas approach has demonstrated, this pattern of shifting attention is subject both to periods of extended incrementalism as well as to rapid and dramatic realignments of the status quo.
Given the unique character of British political institutions and the long-standing use of the Westminster–Whitehall model in political analysis, future research into the policy-making agenda in Britain might consider the specific mechanisms that are associated with punctuations of the agenda, the impact of specific institutional features (for example, the electoral system), and the causal mechanisms that link different parts of the political agenda, such as between the media, parliament, departments and agencies, regulators and other policy outputs. More data on other venues in the British political system could address these questions, particularly in comparison with similar data from other countries.
 ; for the exponential distribution,
 ; where X is the category midpoint and y represents the frequencies associated with the midpoints.
 . That is where the entropy score is estimated as the sum for all topics of the likelihood, p(x), that an object x (in this instance a policy statement in the monarch’s speech) falls within a particular topic i, multiplied by the natural log of that likelihood, multiplied by minus one.