Patients that undergo mechanical ventilation are at high risk of preventable pulmonary complications, such as atelectasis, barotrauma, fluid overload, pulmonary embolism, pneumothorax, and pneumonia. Ventilator-associated pneumonia (VAP) is a subtype of hospital-acquired pneumonias that occur >48 hours after the initiation of invasive ventilation. Early and accurate diagnoses are essential parts of VAP treatment.Reference Kalil, Metersky and Klompas 1
The conventional VAP surveillance paradigm is based on radiologic and clinical signs and symptoms. 2 However, this diagnostic method is complex and labor intensive, and results require some degree of subjective interpretation. In addition, the conventional VAP surveillance paradigm does not correlate with histopathologic findings of pneumonia.Reference Klompas and Platt 3
In 2013, The Centers for Disease Control and Prevention (CDC) released a novel surveillance concept called a “ventilator-associated event” (VAE). This concept aimed to overcome some limitations of the conventional VAP surveillance paradigm by focusing surveillance on objective, reliable measurements of significant conditions and complications that occur among patients that undergo invasive ventilation. 4 In initial studies, VAEs were found to be associated with prolonged mechanical ventilation, intensive care unit (ICU) and hospital lengths of stay (LOSs), and short-term mortality.Reference Klompas, Khan and Kleinman 5 – Reference Bouadma, Snneville and Garrouste-Orgeas 8
Little is known about the clinical impact of VAEs and their relationship to conventional VAP. The aim of our study was to evaluate the concordance and possible differences in efficacy (ie, disease severity and outcomes) between the surveillance paradigms for infection-related ventilator-associated complication (iVAC) and conventional VAP.
METHODS
Surveillance was conducted in a 900-bed, tertiary-level, university teaching hospital in Finland from October 2014 to June 2015. The hospital had an adult, closed, mixed medical-surgical ICU with 22 beds (including 3 rooms with 2 beds, 4 rooms with 3 beds, and 4 rooms with 1 bed). Patients were attended by intensivists that were present in the ICU 24 hours per day, 7 days per week. Furthermore, an infectious disease physician performed daily rounds 5 days per week. In general, standard procedures applied throughout the study period included various strategies to prevent VAP, including daily sedative interruption, daily assessment of readiness to extubate, semirecumbent positioning, daily oral care with chlorhexidine, strict hand hygiene, and prophylactics for peptic ulcer disease and deep venous thrombosis.Reference Klompas, Branson and Eichenwald 9
We enrolled all consecutive adult patients (age ≥18 years) admitted to the ICU that received mechanical ventilation via intubation (≥48 hours) and were monitored daily until ICU discharge or death. Patients were excluded when they met 1 of the following exclusion criteria: pneumonia diagnosis or the presence of tracheostomy at the time of ICU admission; human immunodeficiency virus; and significant immune suppression, defined as prolonged neutropenia (>1 week) or chronic steroid therapy with ≥40 mg prednisolone daily for >4 weeks.
This study was approved by the relevant academic center, and it was reviewed by the Ethics Committee of Northern Ostrobothnia Hospital District, Oulu University Hospital, Oulu, Finland, during the autumn of 2014. Written informed consent was obtained from participants, or their next of kin, prior to inclusion in the study (Declaration of Helsinki, 2013).
Definitions
The ventilator-associated condition (VAC) was defined as an increase of ≥3 cm H2O in the daily minimum positive end expiratory pressure (PEEP) or an increase of ≥0.20 in the daily minimum fraction of inspired oxygen (FiO2), sustained for at least 2 consecutive calendar days, in patients that experienced a baseline period of stability or improvement during mechanical ventilation (defined as ≥2 calendar days of stable or declining daily minimum FiO2 or PEEP values). An episode of iVAC was defined as a change that occurred within 2 calendar days of the start of the VAC, which included an alteration in the leucocyte count (≥12,000 cells/µL or ≤4,000 cells/µL) or a change in body temperature (>38°C or <36°C) combined with the initiation of a new antimicrobial agent, which was continued for ≥4 days. 4
Conventional VAP was defined according to CDC criteria. 2 Chest radiographs were acquired on day 0 (the day of a diagnosis of iVAC or conventional VAP), 2 days prior to the occurrence, and up to 2 days after day 0. These radiographs were re-evaluated by a multidisciplinary team that included 1 chest radiologist, 2 intensivists, and 1 infectious disease physician. The main points assessed were the presence or absence of pneumonia or atelectasis (both lungs were assessed separately).
The number of days on ventilation was defined as the sum of days spent on mechanical ventilation in the ICU. 4 The ICU and hospital LOS and short-term (90-day) and long-term (≥6-month) mortalities were measured. Mortality data were retrieved from the official national database (Statistics Finland, Helsinki, Finland).
Data Collection and Outcomes
Data collected included the admission diagnosis, age, gender, body mass index, days on antibiotics, and results from the Acute Physiology and Chronic Health Evaluation (APACHE II), the Simplified Acute Physiologic Score (SAPS II), and the Sequential Organ Failure Assessment (SOFA).Reference Le Gall, Lemeshow and Saulnier 10 – Reference Knaus, Draper, Wagner and Zimmerman 12 On each calendar day, until ICU discharge or death, the daily highest and lowest PEEP and FiO2 values, body temperature, and leucocyte counts were measured. Blood samples were obtained from an arterial line daily at 05:00. The leucocyte count was quantified on a Sysmex WE-5000 hematology analyzer (Roche).
Data Analysis
Categorical variables are expressed as the count and percentage, and groups were compared with a χ2 or Fisher exact test, as appropriate. Continuous variables are expressed as the median and quartiles (ie, where Q1 and Q3 represent the 25th and 75th percentiles, respectively). Groups were compared using the Mann-Whitney U test or the Kruskal-Wallis test, as appropriate. P<.05 was considered statistically significant. Infection rates were defined as the number of episodes per 1,000 days of mechanical ventilation. Concordance between the iVAC and conventional VAP surveillance paradigms was summarized using Cohen’s kappa coefficient (κ). Estimates of κ range from 0 (no agreement) to 1 (complete agreement).
Results
During the study period, 1,218 patients were admitted to the ICU. Of these, 169 received mechanical ventilation for at least 2 consecutive calendar days. However, 84 patients were excluded because they did not meet predetermined eligibility criteria (n=55), declined to participate (n=2), had physical or mental incompetence (n=7), or could not be accommodated due to the lack of study personnel (n=20). Evaluable data was available for 85 patients that received mechanical ventilation for ≥4 days continuously and were supported for 892 total ventilator days. Most included patients had undergone neurosurgical treatments (41.2%), and most were male (68.2%). The median age was 64.0 years (Q1–Q3, 51.5–72.5). The median LOS for the ICU and hospital were 10.4 (Q1–Q3, 5.9–16.7) and 19.5 (Q1–Q3, 11.7–30.2), respectively, and the median numbers of days on a ventilator and on antibiotics were 6.3 (Q1–Q3, 4.3–12.7) and 10.0 (Q1–Q3, 6.0–16.0), respectively. The ICU mortality rates, 28-day mortality rates, and 1-year mortality rates were 5.9%, 29.4%, and 41.2%, respectively.
Incidences of iVAC and Conventional VAP
Of 85 patients, 10 (11.2 per 1,000 days of mechanical ventilation) developed a VAC (11.8%), 9 (10.1 per 1,000 days of mechanical ventilation) developed an iVAC (10.6%), and 20 (22.4 per 1,000 days of mechanical ventilation) developed a conventional VAP (23.5%). In further analyses, the patients (n=3) with both iVAC and VAP were excluded from the conventional VAP group. However, only 1 of 3 iVAC episodes presented at the same time as a case of conventional VAP.
Half of the VAC episodes (50.0%) were triggered by increasing PEEP settings, 3 VACs (30.0%) were triggered by increasing FiO2 levels, and 2 VACs (20.0%) were triggered by both. However, 11 VAC episodes were missed; 7 (33.3%) due to the variability in adjusting ventilator settings and 4 (19.0%) due to the lack of a stable period before the deterioration of oxygenation.
Every iVAC episode fulfilled the criteria that a new antimicrobial agent was started, combined with alterations in the leucocyte count (77.8%) and/or changes in body temperature (100.0%). None of the patients with iVACs exhibited opacities compatible with pneumonia. A single iVAC episode (10.0%) was missed due to the lack of alterations in the leucocyte count and no initiation of a new antimicrobial agent. However, none of the missed VAC or iVAC episodes met the criteria for a conventional VAP.
Every conventional VAP episode fulfilled the criteria that a new or progressive, persistent infiltrate was observed on chest radiographs, combined with alterations in the leucocyte count (58.8%), presence of fever (70.6%), changes in sputum (88.2%), rales in bronchial breath sounds (82.4%), and/or worsening gas exchange (29.4%).
Severity and Outcomes of iVAC and Conventional VAP
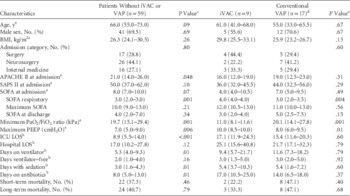
When patients with and without iVAC were compared, patients with iVAC had lower scores on the SAPS II (36.0 vs 50.0; P=.049) and APACHE II (16.0 vs 21.0; P=.047) instruments at the time of admission. Compared to patients without iVAC, those with iVAC had worse clinical outcomes, including longer ICU LOS (17.1 vs 9.9 days; P=.021), more days on antibiotics (17.0 vs 9.0 days; P=.02), lower PaO2/FiO2 ratios (11.0 vs 19.8 kPa; P<.001), and higher PEEP levels (10.0 vs 7.0 cm H2O; P=.002). The patients with conventional VAP had significantly more time on a ventilator (11.6 vs 5.4 days; P=.001) and in the ICU (15.4 vs 9.3 days; P=.004) compared with patients without VAP. When patients with iVAC were compared with patients with VAP (Table 1), the patients with iVAC had significantly lower PaO2/FiO2 ratios (11.0 vs 20.1 kPa; P=.001), higher PEEP levels (10.0 vs 8.0 cm H2O; P=.01), and higher SOFA respiratory scores (4.0 vs 3.0; P=.004).
Clinical Characteristics of 85 Patients That Received Mechanical Ventilation in a Mixed Medical-Surgical Intensive Care Unit in Finland from October 2014 to June 2015

NOTE. iVAC, infection-related ventilator-associated complication; VAP, ventilator-associated pneumonia; BMI, body mass index; APACHE, Acute Physiology and Chronic Health Evaluation score; SAPS, New Simplified Acute Physiologic score; SOFA, Sequential Organ Failure Assessment score; PaO2, partial pressure of oxygen in arterial blood; FiO2, fraction of inspired oxygen; PEEP, positive end expiratory pressure; ICU, intensive care unit; LOS, length of stay.
a Shown as median days and quartiles Q1–Q3 (25th and 75th percentiles).
b Shown as median days and quartiles Q1–Q3 (25th and 75th percentiles).
c Independent-samples, Kruskal-Wallis, or χ2 test between 3 study groups.
d The 3 patients that presented with both iVAC and VAP were excluded from the conventional VAP group. However, only 1 iVAC episode presented at the same time as VAP.
e Mann-Whitney U and χ2 or Fisher’s exact test between iVAC and VAP groups.
Concordance Between the Surveillance Paradigms of iVAC and Conventional VAP
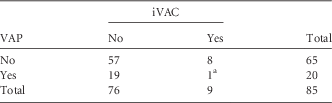
Cohen’s κ coefficient of agreement was 0.09 (95% CI, −0.43 to 0.25) between the surveillance paradigms of iVAC and conventional VAP, which suggested poor agreement (Table 2). The iVAC indicators were most often caused (separately or in conjunction) by noninfectious conditions and complications, such as atelectasis (n=7), fluid overload (n=4), pleural effusion (n=1), bowel ischaemia (n=1), pulmonary embolism (n=1), heart failure (n=1), and acute kidney injury (n=1).
Presence of an Infection-Related Ventilator-Associated Complication and Ventilator-Associated Pneumonia
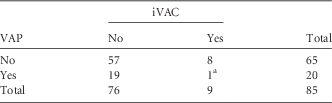
NOTE. iVAC, infection related to ventilator-associated complication; VAP, ventilator-associated pneumonia.
a The sensitivity and specificity of the infection-related ventilator-associated complication surveillance paradigm for detecting ventilator-associated pneumonia were 5.0% (95% CI, 0.1–24.9) and 87.7% (95% CI, 77.2–94.5), respectively. The positive and negative predictive values were 11.1% (95% CI, 1.6–48.5) and 75.0% (95% CI, 72.4–77.5), respectively.
DISCUSSION
In this prospective study, the incidence of conventional VAP was 2-fold the incidence of iVAC. The iVAC surveillance paradigm failed to detect 95% of patients with VAP. Instead, iVAC was due to noninfectious complications other than pneumonia. All patients with either iVAC or conventional VAP had worse clinical outcomes than patients without these conditions.
The Cohen’s κ coefficient (0.09) in this study indicated poor agreement between the surveillance paradigms for iVAC and VAP, consistent with Steven et al,Reference Stevens, Silva and Gillis 13 who reported a corresponding value of 0.06. However, the low agreement we observed was worse than most rates reported previously.Reference Klompas, Khan and Kleinman 5 , Reference Lilly, Landry and Sood 7 , Reference Van Mourik, Klouwenberg and Ong 14 – Reference Chang, Chen, Kung, Wang, Liu and Lai 17 The iVAC indicators were most often caused by other noninfectious complications. Moreover, in previous retrospective analyses of underlying clinical conditions, the causes of VAC most often observed were heart failure, acute respiratory distress syndrome/acute lung injury, atelectasis, alveolar hemorrhage, thromboembolic disease, fluid overload, infections,Reference Lilly, Landry and Sood 7 , Reference Van Mourik, Klouwenberg and Ong 14 , Reference Klein Klouwenberg, van Mourik and Ong 15 and VAP.Reference Klompas and Platt 3 Another explanation for the low sensitivity of the iVAC surveillance paradigm might be that the algorithm did not take into account chest radiographs, early-onset VAP (occurring within 48–72 hours), immunosuppression, or therapeutic hypothermia. Moreover, the definition of iVAC might have been complicated by inadequate data records (eg, the date of intubation, body temperatures) and the lack of samples (eg, endotracheal aspirates, leucocyte counts).
Currently, according to criticism, the conventional VAP surveillance paradigm highlights nonspecific markers (eg, fever, abnormal leucocyte count, change in sputum) and nonobjective, insensitive, and nonspecific chest radiographic findings. 2 In contrast, the novel iVAC surveillance paradigm emphasizes solely objective, but nonspecific changes, such as respiratory status deterioration, laboratory evidence of infection and inflammation, and the initiation of a new antimicrobial agent, but no radiographic findings. 4 The rationale for these different approaches was apparent in our study: all patients with conventional VAP had new or progressive, persistent infiltrate that could be detected on the ≥2 consecutive chest radiographs evaluated by the multidisciplinary team. Conversely, none of the patients with iVAC had opacities compatible with pneumonia. In addition, every iVAC episode was accompanied by the initiation of a new antimicrobial agent, but only 10% of patients with conventional VAP fulfilled this criterion. Both groups exhibited alterations in leucocyte counts and body temperature. However, patients with iVAC had more severe respiratory organ dysfunction than patients with conventional VAP. Although ~33% of patients with conventional VAP showed a trend toward worsening gas exchange, they did not meet iVAC criteria.
A lack of radiographic imaging can interfere with early, accurate diagnoses and delay the prompt treatment of infectious and noninfectious conditions and complications that occur among patients that receive mechanical ventilation. Nevertheless, microbiological methods for diagnosing VAP may require a few days to complete; thus, the current Infectious Diseases Society of America guideline recommends using clinical criteria for diagnosing VAP.Reference Kalil, Metersky and Klompas 1 However, that recommendation may lead to either under- or overdiagnosis.Reference Klompas and Platt 3 In our experience, in outpatients and patients in emergency rooms and wards that have lower respiratory infections, pneumonia may be missed with chest radiographs compared to chest computed tomography (CT).Reference Syrjälä, Broas, Suramo, Ojala and Lähde 18 , Reference Syrjälä, Broas, Ohtonen, Jartti and Pääkkö 19 On the other hand, due to atelectasis and pleural effusions in severe community-acquired pneumonia, plain chest radiographs may show more widespread lung involvement than chest CTs.Reference Karhu, Ala-Kokko, Ahvenjärvi, Rauvala, Ohtonen and Syrjälä 20 In our experience, risk does not appear to be affected by transporting patients from the ICU to the radiology department.Reference Ahvenjärvi, Laurila, Jartti, Ylipalosaari, Ala-Kokko and Syrjälä 21 In the future, new ultra-low-dose CT scans should be used more widely to improve the accuracy of VAP diagnoses.Reference Kim, Park, Lee, Lee, Shin and Moon 22 , Reference Macri, Greffier and Pereira 23
The main strengths of our study were its prospective design and the focus on both short-term and long-term patient outcomes. The study also had some limitations. First, it was a single-center study with a limited sample size and VAE rate (9 iVAC and 17 VAP episodes), which limited the generalization of our results. Second, we did not confirm episodes with chest CTs; thus, based on results for severe community-acquired pneumonia, at least some of our conventional VAP episodes may have been due to noninfectious causes like atelectasis or pleural fluid.Reference Karhu, Ala-Kokko, Ahvenjärvi, Rauvala, Ohtonen and Syrjälä 20 In addition, we missed 52.4% of VAC episodes due to the variability in adjusting ventilator settings and the lack of a stable period of at least 2 calendar days before oxygenation worsened. In addition, nearly half of our patients had undergone neurosurgery, which limits the application of PEEPReference Johnson, Huang and Pilcher 24 and body temperature management; moreover, neurological conditions may cause alterations in body temperature that may obscure a diagnostic assessment.Reference Cunha and Tu 25 , Reference Kilpatrick, Lowry, Firlik, Yonas and Marion 26 It is challenging to determine a pneumonia diagnosis in patients that require neurosurgery. In our experience, when these patients were evaluated with different diagnostic criteria, a 4.7% difference in the pneumonia incidence was found in the same population.Reference Kuusinen, Ala-Kokko and Jartti 27
In conclusion, the incidence of conventional VAP was >2-fold that of iVAC, and the surveillance paradigms for VAP and iVAC capture different pattern of disease. Our results suggest that this novel surveillance concept, although based on objective measures of declining oxygenation, identified deteriorations of oxygenation due to noninfectious causes.
ACKNOWLEDGMENTS
The authors thank the study nurse Sinikka Sälkiö for providing valuable help during data collection. In addition, the authors thank all the patients who participated in this study.
Financial support: No financial support was provided relevant to this article.
Potential conflicts of interest: All authors report no conflicts of interest relevant to this article.