

1. Introduction
Trust is essential to the conduct of everyday life. ‘WEIRD’ college students from the Western, Educated, Industrialised, Rich and Democratic world (Henrich et al., Reference Henrich, Heine and Norenzayan2010b) taking part in trust games (Berg et al., Reference Berg, Dickhaut and McCabe1995) or variation thereof have to a large degree influenced many scholars’ understanding of trust and reciprocity. This study reports on ‘weird’ results from an experiment carried out with ‘non-weird’ subjects. Greig and Bohnet (Reference Greig and Bohnet2008) write that in the western world the amounts returned by the second mover increase with increasing amounts of money invested by the first mover. In developing countries, however, the decisive norm of reciprocity is mostly balanced, indicating that the amount returned will be equal to the money invested, no matter how much was actually invested. Thus, for the first player, trust as an investment does not pay in developing countries as the second player keeps the surplus from the investment. In a recent meta-analysis encompassing 162 replications (15 in Africa) of the standard trust game carried out around the world, Johnson and Mislin (Reference Johnson and Mislin2011) confirmed that participants in Africa send less than those in North America.Footnote 1 If trust does not pay off and is low among people one might recommend the use of certain institutions backed by severe sanctions or other government (or even military) interventions. Thus, if new institutions are recommended based on a wrong measure of trust, the new institution might at the end be responsible for distrust. Thus, how reliable researchers measure trust is extremely important. In this study the main reason for measuring trust is to assess the possibility of self-governance of commonly owned grazing land. Low trust levels indicate the need of trust-building measures by third parties whereas high levels of trust indicate a greater scope for self-governance.
How to measure trust then? A recent development has been the use of economic experiments to measure trust with non-student subjects around the world. The idea behind this is to incentivise participants’ decisions with money in order to circumvent the hypothetical bias inherent in questionnaires. However, the artificial, impersonal, anonymous experimental environment might not serve the intended aim (i.e. to increase internal validity), as exchanging money in abstract economic experiments can also breed other motives. An important point made by most anthropological work on exchange is that exchange does not only serve practical ends, but also expresses and shapes social identities and has a variety of intangible functions, for instance, for prestige, status, respect (Mauss, Reference Mauss1990) and especially for risk reduction (Cashdan, Reference Cashdan1985). These functions might not be adequately measured with standard economic experiments or they might be activated unexpectedly in an experiment and strongly influence the behaviour of participants. Such behaviours are the ‘outlier’ cases reported in Henrich et al. (Reference Henrich, Boyd, Bowles, Camerer, Fehr, Gintis, McElreath, Alvard, Barr, Ensminger, Henrich, Hill, Gil-White, Gurven, Marlowe, Patton and Tracer2005) that cannot be explained with economic theory but only with ethnographic research.Footnote 2 While such ‘outliers’ have so far not been reported for trust games, one standard experiment used in cross-country studies is the ultimatum game where one player decides over the distribution of money and the second player can accept his share or reject the offer. In the latter case both players go home with no money. Hyper-fair offers of over 50% were reported by Henrich et al. (Reference Henrich, Boyd, Bowles, Camerer, Fehr, Gintis, McElreath, Alvard, Barr, Ensminger, Henrich, Hill, Gil-White, Gurven, Marlowe, Patton and Tracer2005) as the mean behaviour in ultimatum games in two New Guinean groups (the Au and Gnau) as well as in Indonesia (Lamalera). In New Guinea, offers above 50% were rejected by applying a costly norm of negative reciprocity, although there is seemingly no need to ‘punish’ the first mover. This puzzling finding only makes sense in the ethnographic context of many New Guinean societies (Tracer, Reference Tracer2003, Reference Tracer, Henrich, Boyd, Bowles, Camerer, Fehr and Gintis2004). Tracer argues that the rejection of generous offers is similar to the gift giving found in Au and Gnau villages, and throughout Melanesia.Footnote 3 This episode suggests that experimental games do not always reveal the ‘true’ social preferences that were initially intended to be measured, as people act bounded rational and apply heuristic, internalised norms or other exchange motives within the experimental context. Although the Au and Gnau (as well as the Nama in this study) are ‘exotic’ societies, such ‘outlier’ cases are important to study as they show how broader context and social norms influence decisions in an economic experiment. At the same time the ‘outliers’ raise methodological questions of carrying out experiments in remote areas as well as for the interpretation of such economic experiments.
In this article I apply a ‘within-culture across-country’ design of a trust game. The two populations analysed here are descendants of a common ancestor, the Nama culture, but colonisation and with it institutional changes in the two populations have been different due to the belonging to different nation states. Similar maybe to natural experiments in institutional change (e.g. North and South Korea or West and East Germany), the former Namaland was homogeneous in terms of linguistic, cultural, geographic and economic possibilities until 200 years ago. However, due to its inaccessibility by sea and by land, Namibia remained much more isolated from western colonial powers until 1884 while South Africa was colonised from 1657 and many of the Nama inhabitants moved to Namibia starting in 1780. On a larger scale such variation created by colonisation was used by Acemoglu et al. (Reference Acemoglu, Johnson and Robinson2001) to identify the causal effect of institutions on long-run economic growth. This paper uses the variation created by external influence to assess the influence of institutional change on social norms – the norm of reciprocity and the norm of trusting/giving – within two populations that share a similar cultural origin.Footnote 4 The ex ante hypothesis is that trust and trustworthiness are higher in Namibia where traditional Nama norms are still practised. The obtained results deviate substantially from those obtained in related studies drawing on a (non-) student subject pool in the laboratory or the field. In the South African Namaqualand (hereafter only referred to as South Africa) measured trust was extremely low (21% of their initial endowment), but reciprocity compared with the low trust was high (average proportion returned from the tripled amount was 37%), while in the bordering Namibian Karas region (hereafter only referred to as Namibia) trust was high (41% of their initial endowment) but reciprocity among participants was almost never practised (average proportion returned from the tripled amount was 8%). These results are outliers compared with existing studies in South Africa and elsewhere.Footnote 5 In the double-blind procedure of Berg et al. (Reference Berg, Dickhaut and McCabe1995) only six out of 28 responders (21%) did not send any money back while it was 25 out of 36 in Namibia (70%). Furthermore, the Namibian case of high-trust low-reciprocity is counterintuitive since usually people anticipate the level of trustworthiness in their own society and trust accordingly. Also, the Namibian result contrasts with the evidence suggesting that Nama in Namibia have intact social norms (Klocke-Daffa, Reference Klocke-Daffa1999; Kössler, Reference Kössler2001) while the traditional norms in Namaqualand most probably ceased to exist due to a bundle of external influences and transitions of property systems (like resettlement or displacement of communities during apartheid, privatisation of the commons in the 1980s or the resettlement farmers after independence). A satisfactory explanation of the results is of great practical importance for the people in both study regions. Claiming and reporting low levels of trustworthiness in Namibia could lead to completely wrong institutional recommendations.
The paper proceeds in presenting the experimental methods (Section 2) and testing the ex ante hypothesis that trust and trustworthiness are higher in Namibia where social norms are still practised (Section 3). Section 4 discusses reason for lower trust in South Africa and tests and discusses several possible explanations for the ‘weird’ reciprocity in Namibia (i.e. high trust and low reciprocity). Section 5 concludes on practical and methodological aspects. The paper has a supplementary appendix that describes the study region, explains the origins of exchange based on anthropological work of the study region and describes past and recent political events. It also contains further analysis, the experimental protocol and the questionnaire items. The appendix is available online at http://www.millennium-economics.com/supplementary-material.htm
2. Experimental set-up
The investment or trust game is a one-shot game played by anonymous pairs of subjects. In the original trust game by Berg et al. (Reference Berg, Dickhaut and McCabe1995) both investor and trustee have an endowment z. The investor can keep or invest his endowment. Assume the investor invests X and keeps z − X. The investment X earns a return, at a rate (1 + r), and becomes (1 + r) X. X is multiplied by r > 1 by the experimenter to capture the efficiency-increasing potential of this transaction. Usually r is equal to 2 inducing the experimenter to triple the amounts sent. The other player, the trustee, must decide how to share the new amount z + (1 + r) X with the investor. Suppose the trustee returns Y and keeps z + (1 + r) X − Y, the total payoff of the investor is z − X + Y and the payoff of the trustee is z + (1 + r) X − Y. The usual prediction is by assuming selfish money-maximising preferences and common knowledge of rationality that returns Y* = 0 and trust X* = 0, which precludes any trustworthiness and reciprocity. X is commonly referred to as ‘trust’, while Y/X measures ‘trustworthiness’ (trustworthiness is precluded when first movers send zero). It is thus presumed that for any positive amount of X player 1 expects some form of reciprocity from player 2. The relationship between X and Y/X determines the form of reciprocity.
I followed the instructions from the trust game protocol of the National Science Foundation project ‘The Roots of Human Sociality’.Footnote 6 Each player's initial endowment was 8 South African Rand and the play was conducted with 2 Rand coins only.Footnote 7 The first player had to choose X, where X = {0, 2, 4, 6, 8}. The choice of X defines the subgame of the second mover where she chooses Y = {0, 2, 4, 6, 8, 10, . . . 32}. This game was played in 10 sessions in eight different villages (seven sessions in South Africa and three in Namibia) with 218 participants (109 for each role). The recruitment process was the same in Namibia and South Africa. The invitation to participate was spread both through written notices at the local shops and municipality office as well as by word of mouth prior to conducting the experiment. A research assistant also went from door to door to inform and recruit people. Upon arrival participants agreed to take part in a game where they could earn some money as well as to fill in the survey forms. Due to small sample properties and the non-random sampling process there were significant differences in characteristics between Namibian and South African participants (see Table A2 and A3 in the supplementary appendix). The differences due to non-random sample selection are tackled with a regression control and matching estimation method to substantiate the differences between the two countries.
There were no differences in the implementation of the experimental protocol in Namibia and South Africa: same language, same stake size, same experimenter, similar experimental locations, similar selection of the subject pool, similar degree of scrutiny (see Roth et al., Reference Roth, Prasnikar, Okunofujiwara and Zamir1991; Levitt and List, Reference Levitt and List2007). Participants needed to be above 18 years of age. Of the participants, 56% were female, the mean age was 33 years and the average education level was eight years of schooling. There were between eight and 15 pairs per session. The allocation of pairs and roles was assigned randomly by drawing a closed envelope with the player and group number (e.g. B87 or A5). It was made clear that the number should be kept private and that the pairs were allocated randomly.Footnote 8 Participants knew that a code starting with A assigned them to the role of player 1 while B assigned them to the role of player 2. Furthermore, it was made clear that people were paired with someone from their own village. The experiments were all pre-tested and run in Afrikaans. The instructions were read aloud from a standardised script by the same native speaker in all villages to all participants. Different examples were visualised on a white board. Questions had to be asked in private and answered according to the protocol. Players were separated into different rooms with one overseer for each group to avoid collusion among players. Communication was strictly prohibited. Then, the players of group A first were called one by one to the experimenter in a separate room where they received a short reminder on their role in the game and could eventually ask further questions until it was made sure that he or she understood the experiment.Footnote 9 The money was then put in front of the person and he or she decided how much to keep or to send. The decision was single-blind but participants did not know the experimenter from prior encounters. All money remained with the experimenter until the end of the experiment. Players from group A who had made their decision were sent to an assistant at a meeting place outside (not back to the other A players). After all participants of group A had made their decision the players from group B were called one by one to the experimenter. It was again made sure that the person understood the rule of the game before he or she made the decision. Players from group B were shown a separate pile of money that an anonymous player in group A had sent and how this amount got tripled. They then decided on the amount to keep and to send. After the decision the person then went to a supervised meeting place outside. After all B players made their decision both the A and B players were again called one by one and handed out the earnings in an envelope. They could leave without interacting with other participants. Before the experiments the socio-demographic details were assessed for each player and after the experiment (but before the payment) participants were asked to complete another short questionnaire.
3. Results
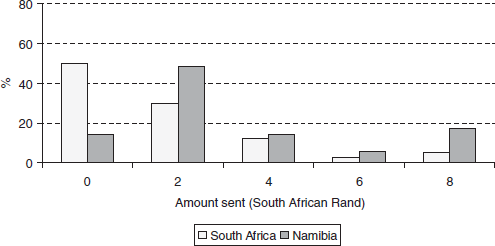
The distributions of amounts sent are shown in Figure 1. In South Africa, the average amount sent was 1.6 ZAR, which is 21% of the initial endowment. In Namibia, the average amount sent was 3.2 ZAR, which is 41% of their initial endowment. The difference of the means between the two regions is significant at the 1% level (Z = –3.43; p < 0.01).Footnote 10 The mode was also different. In South Africa the mode was identical to the Nash prediction of sending nothing. In Namibia, the mode was to send 25% of the endowment (Figure 1). Trustworthiness can be measured as the proportion Y returned of the amount received after the amount sent is tripled X*3. The initial endowment is not added. The average proportion returned in South Africa was 37% (std. dev. = 0.38) while the corresponding proportion in Namibia was 8% (std. dev. = 0.14). Testing for differences in the means yielded significant results (Z = −3.43; p < 0.01). Thus, the differences in trust and trustworthiness between the two countries are substantial in univariate tests.
Distribution of percentage of endowment sent in South Africa (Namaqualand) and Namibia (Karas). Low trust in South Africa: almost 50% of first players sent nothing in South Africa

Section 3.1 analyses the norm of reciprocity within each country; section 3.2 provides the country differences of trust and trustworthiness based on matching estimation; section 4 substantiates the experimental results with additional survey measures and sociological literature pointing towards intact norms in southern Namibia but institutional problems in South Africa.
3.1. Analysing the norm of reciprocity
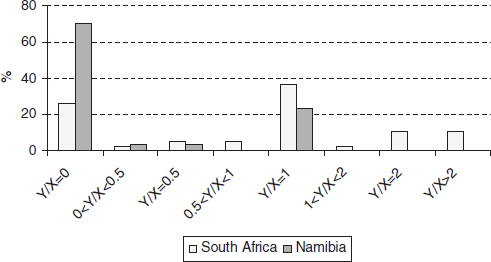
The return ratio Y/X for those who received positive amounts from the first mover, which is similarly indicating trustworthiness, was 1.1 (std. dev. = 1.1) in South Africa and 0.25 (std. dev. = 0.4) in Namibia. A return ratio of 1.5 induces equal sharing of the investment gain; a ratio of 3 indicates that the second player sent all the profit back to the first player. A return ratio of 1 indicates the norm of ‘balanced’ or pure reciprocity, meaning that player 1 got on average the same amount returned as they sent away. This was the mode behaviour in South Africa (Figure 2). A return ratio below one indicates that first players were making losses from trusting their community members. A return ratio of 0 indicates ‘no reciprocity’. This is with 70% the dominating outcome in Namibia (Figure 2). In South Africa the norm of reciprocity is clearly balanced and trust is low, leaving the sender not worse or better off than before. There are even some hyper-fair offers from the second mover with a return ratio above 3. Thus, some people wanted to ‘reward’ the first mover for being generous. Also, in some cases people insisted on sending money back to the first mover although she did not send anything.Footnote 11
Responses by second mover Y/X (return ratio). Low reciprocity in Namibia: 70% of second players did not return anything

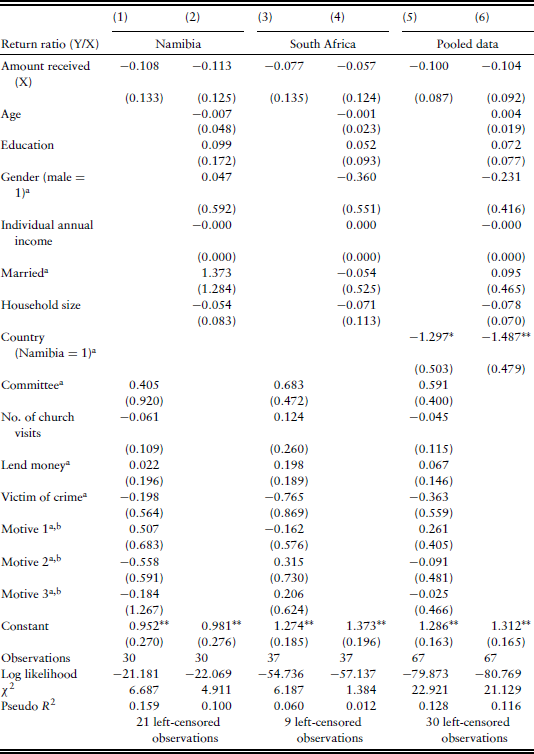
Table 1 (models 1 to 4) shows Tobit regression models for each country with socio-demographic control variables and with ex post measures of motives for sending, habit of lending money, whether person was a victim of a crime and frequency of church visits.Footnote 12 I test the dependence of the return ratio on the amount the player received from player 1. A test between forms of reciprocity can be done with a linear regression function for player 2 where the subscript i denotes the individual i = 1, . . . ,n.

The coefficient β1 has a positive sign for the norm of ‘positive’ reciprocity (i.e. with increasing amounts of money invested by the first mover, the amounts returned by the second mover increase) and a negative sign for ‘adverse’ reciprocity (i.e. with increasing amounts of money invested by the first mover, the amounts returned by the second mover decrease). Balanced reciprocity leads to β0 = 1 and β1 = 0.

Notes: Regression using left-censored Tobit model. a Dummy variables. b Explanation of motive variable: motive 1 – ‘It would be unfair not to send anything’; motive 2 – ‘The receiver probably needs the money more than I do’; motive 3 – ‘I will get punished, either during lifetime or afterwards, if I am not generous to others’. Standard errors are shown in parentheses. Significance for one-sided test: ** 1% level, * 5% level.
The point estimate for amount received (in models 1–6) is negative but insignificant and therefore I cannot reject the null hypothesis of balanced reciprocity. Interestingly, all socio-demographic variables as well as the variables on attitudes and motives are insignificant both within each country and also in the pooled dataset. Their overall explanatory power is very weak. This already indicates that it is quite unlikely that differences in covariates between both countries account for the large difference in trustworthiness. A bias might only arise if the difference between the countries is also correlated with the outcome variable. Models 5 and 6 finally pool the two datasets and include a dummy for the country.Footnote 13 The dummy variable taking 1 if the game was played in Namibia is negative significant and large. Given that the mean value of the return ratio is 0.73 (std. dev. = 0.98; min = 0; max = 5) the coefficient for the country dummy (1.5) is twice as large.
3.2. Matching results on trust and trustworthiness between regions
The country effects for trust and trustworthiness are extremely large and it is unlikely that unbalanced socio-demographic variables or other individual-level variables can account for this. In a robustness test to further substantiate the claim that the different behaviour is driven by the country effect, I apply a matching estimation that forms homogeneous comparison groups to adjust for the difference in observable characteristics related to the selection process (Rosenbaum and Rubin, Reference Rosenbaum and Rubin1983; Heckman et al., Reference Heckman, Ichimura and Todd1998). The matching estimation accounts for the fact that the samples in both countries were not randomly drawn and there is a selection bias in the sense that Namibians were more educated and younger, with a higher proportion of men, fewer married people and lower available income (the characterisation is indeed very similar to the typical student sample). This is mainly due to farmers being on stock posts outside the towns and only coming occasionally and on special invitation to the larger settlements where the research was carried out. Matching has the advantage against the classical regression control approach that it does not require specifying the functional form of the outcome equation. Another advantage of the matching techniques is that the analysis is only made for the region of common support, i.e. individuals in Namibia that do not have an adequate pair in South Africa are not included in the analysis. The basic idea of propensity score matching is to match at least one South African to every Namibian with identical or highly similar values of observed characteristics. The difference in outcome (trust and trustworthiness) between these two individuals is then averaged over the whole population. I perform the matching on a list of observable characteristics that were biased in the sampling process and potentially also influence trust or trustworthiness. Any remaining difference between Namibians and South Africans is then due to any unobservable effects that are attributed to trust or trustworthiness.Footnote 14
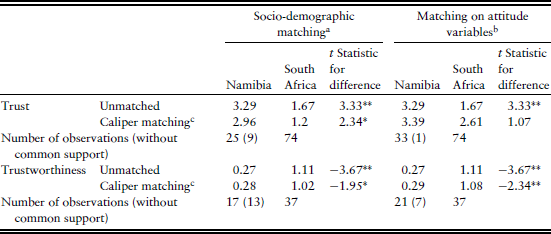
Table 2 shows the result from the matching estimation while the supplementary appendix contains all covariates included in the matching. The radius for the matching is quite small (caliper 0.025) in order to only allow comparison between similar people. This leads to the elimination of some individuals from the sample. This method to establish the country difference is robust against observable selection bias since all variables that differ between the country can potentially influence trust or trustworthiness were included in the matching procedure. From the balancing test one can see that all socio-demographic covariates that were significantly different between Namibia and South Africa prior to the matching are now insignificant. The strong country difference remains in all but one specification (difference in trust using attitude questions for matching). When using attitude variables to match for trust difference the country effect disappears. Especially, the differences that Namibians are more often lending money and going more often to church are still significant after matching. The matching results for trustworthiness show that the remaining differences between both countries are still statistically significant and large.Footnote 15 Since the form of reciprocity in Namibia cannot be explained with socio-demographic variables or other motives it is likely that it is followed by a large part of the population like a convention or a norm. Although the sample sizes in the experiment are small they are neither unusual compared with other studies nor insufficient to make significant inference based on regression and matching analysis.Footnote 16 The recruitment was the same, the experimental procedures were identical in both regions and sample selection had some but not decisive influence on the results.

Notes: a Variables included in the socio-demographic matching: age, education, gender, income, married, single, household size, belonging to Methodist or Roman Catholic Church, belonging to Dutch reformed church or Lutheran church. b Variables included in the attitude matching: committee, no. of church visits, lend money, victim of crime, motive 1 (‘It would be unfair not to send anything’, motive 2 (‘The receiver probably needs the money more than I do’), motive 3 (‘I will get punished, either during lifetime or afterwards, if I am not generous to others’). c Caliper matching with 0.025 radius used as the tolerance level. Significance for one-sided test: ** 1% level, * 5% level.
4. Discussion
Comparing results from this study (i.e. low reciprocity in Namibia and extremely low trust in South Africa) with the review of numerous trust games by Cardenas and Carpenter (Reference Cardenas and Carpenter2008) and the more recent meta-analysis by Johnson and Mislin (Reference Johnson and Mislin2011) highlights how unusual the data are. First, the amounts sent in field or laboratory experiments are on average 40% to 60% of the endowment of player 1 and not as low as in the Namaqualand with only 21%. Moreover, Namaqualand in South Africa scores as the region with the lowest trust. Second, the highly opportunistic behaviour in Namibia has not been observed so far in any laboratory or field study, and third, the discrepancy between the amount sent by player 1 and the amount returned by player 2 in Namibia is also a very unique result.Footnote 17
Section 4.1 discusses the trust levels in both regions and that lower trust in South Africa is replicated by several surveys and other behavioural experiments (Vollan, Reference Vollan2008, Reference Vollan2011; Prediger et al., Reference Prediger, Vollan and Frölich2011). The lower trust in South Africa is correlated with a legacy of maladministration and corruption. Section 4.2 discusses the plausibility of the ‘weird’ high trust and low reciprocity result in Namibia.
4.1. Additional evidence on trust, ethnic identity and local institutions
In this section I further substantiate the differences in trust with survey measures from different enquiries to show that the trust difference did not happen ‘accidentally’ in one experiment but is replicated by different survey instruments and from various sources. Last, I present sociological and anthropological evidence from the Namaqualand showing their difficulties with local institutions and ethnic identity that might explain the low trust levels in South Africa.
4.1.1. Generalised trust from ex post experimental survey and two related surveys
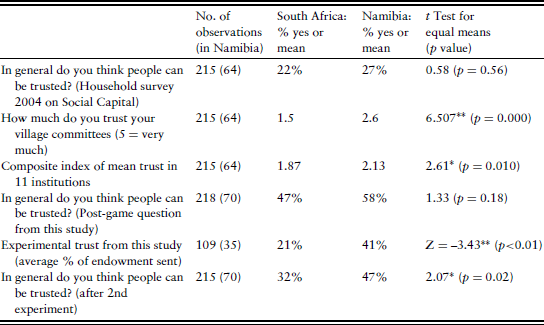
Table 3 compares the different measures of trust for Namibia and South Africa from three different sources: this study, another experimental study (Vollan, Reference Vollan2011) and a social capital survey (own data published in Vollan, Reference Vollan2012). There is a country difference in all questionnaire items (5, 11 and 15 percentage points) and experimental measures (20 percentage points), therefore indicating that trust was higher in Namibia than in South Africa. The social capital survey also shows significantly higher trust in local institutions in Namibia. The degrees of trust, however, vary from survey to experimental methods and whether trust items were asked after an experimental session or not. For example, in the pooled sample (both countries), the same question on general trust yields lower trust in the first survey from 2004 performed with household heads (23%) than it was when asked after the experiments (49%).Footnote 18 Since the people surveyed in 2004 were not the same that played the trust experiment in 2006, there could be a selection bias (in both countries) towards very trustful participants in the experiment. More likely, however, is that the higher value of generalised trust in the post-experiment questionnaire could be due to the bias of having played an experiment where people might justify that they neither sent nor returned much money.Footnote 19 Through the experimental experience and the interaction afterwards with other participants people might have ‘learned’ what the social desirable answer is by stating in an un-incentivised hypothetical question to have high trust in general. However, given that within each survey, experiment trust is consistently measured higher in Namibia than in South Africa it is implausible to expect long-term disequilibrium with high trust and low reciprocity in Namibia.

Notes: Significance: ** 1% level, * 5% level.
4.1.2. Institutional quality and ethnic identity (Afrobarometer, 2008)
Nowadays, in both areas inhabitants face similar social (e.g. HIV), economic (high unemployment, lack of entrepreneurship) and ecological challenges (resource degradation). Based on ratings of political and economic rights, South Africa and Namibia are among the few African countries rated by Freedom House as ‘free’ countries. A more detailed source of information is the Afrobarometer survey carried out in 2008 (round 4) throughout Namibia and South Africa. In the Namibian sample it is possible to identify 72 Nama people (6% of total survey) of which 23 were interviewed in the Karas region (45%, the largest population group in Karas). In the South African sample there are 16 respondents from the Namaqualand district and 12 of them are coloured (i.e. ethnic group of mixed-race people). Given these small sample sizes one cannot make robust inference but some tendencies are very interesting and supportive to the argument of intact social norms in Namibia. The following percentages are reported for the Nama living in Karas and in brackets for the coloureds in Namaqualand. Interesting for possible explanations around trust and strength of norms is the degree of market access (Henrich et al., Reference Henrich, Boyd, Bowles, Camerer, Fehr, Gintis, McElreath, Alvard, Barr, Ensminger, Henrich, Hill, Gil-White, Gurven, Marlowe, Patton and Tracer2005), the perception of the ‘rule of law’ (Herrmann et al., Reference Herrmann, Thöni and Gächter2008), quality of the local Government and people's identity with their ethnic group.
The two surveys suggest that there are only minor differences in market access measured in terms of use of mobile phones. In Namibia only 35% (16% of coloureds in Namaqualand) never use a mobile phone. This confirms the measure from the experiment that the number of purchased food items in both regions is similar.Footnote 20 Among the Nama in the Karas region (coloureds in Namaqualand) 80% (80%) reported not having been attacked or having been a victim of a crime. Only 8% (12%) disagree with the statement that courts make binding decisions and 5% (0%) had to pay bribes to the police. Consequently, only 5% of the Nama see security and crime as the largest problem in the country. The first big difference between the two populations is that the coloureds in the Namaqualand perceive ‘crime and security’ (with 33%) as the biggest problem for the country although not being exposed to more crime. The second large difference is the identity of their ethnic group. Of the Nama, 82% (25% of the coloureds) state that their ethnic identity is similarly important to them as the identity of being Namibian (South African). Also relational trust is stronger in Namibia. In Namibia 82% (75%) report trusting their relatives ‘a lot’, 13% (25%) people they know and 4% (8%) other Namibians. Distrust in local Government is higher in the Namaquland in South Africa. Of respondents in South Africa, 33% report not to trust the local Government at all compared with only 4% in Namibia. This confirms the significantly higher trust in institutions in Namibia from the own survey (Table 3; composite index of mean trust in 11 institutions). The higher mistrust and perception of crime and security in South Africa might well be one reason for the low amounts sent in the trust experiment. The high trust and social identity among the Nama indicates a strong in-group feeling and adherence to cultural practices.
4.1.3. Sociological and anthropological evidence on local institutions in the Namaqualand
South Namibia, due to its climatic condition, was much later colonised and had higher mortality rates among settlers (compared with the South African Namaqualand). Nowadays, population density is still much smaller in Namibia. Following argumentation by Acemoglu et al. (Reference Acemoglu, Johnson and Robinson2001), institutions in South Namibia remained rudimental and based on extraction of resources rather than trying to implement new laws and legislation. Thus, the Nama in Namibia could more or less conserve their traditional norms. When it came to self-organisation and service delivery, the commons in the Namaqualand reserves were confronted with severe challenges in the past. Shackleton et al. (Reference Shackleton, von Maltitz and Evans1998: 21) characterise South African communities as ‘not having had a long tradition of cooperation’. Starting with colonial oppression and the allocation of unproductive land to the coloured community, the situation worsened with the 1913 Land Act, which made it illegal for Africans to own or lease land outside the reserves. The reserves became mainly a pool of migrant workers for the coastal diamond mines. The Coloured Rural Areas Act 24 from 1963 gave power to the South African Minister of Coloured Affairs to mandate and control a local management board consisting of the most influential coloured people in the reserves. Although the management board was called autonomous, decisions had to be approved by the superiors and the power and duties were unrealistic in relation to its resources. Until 1988 only 13% of the population (‘the burgers’) in the reserves were accorded full citizen status with voting rights and rights to stand for office on the board (Westaway, Reference Westaway1994: 8; Boonzaier, Reference Boonzaier1996: 129). However, elected board members were typically elder farmers who lacked formal schooling and the relevant skills for administration. From the times of the board system a lot of money was granted for development projects which never reached its initially designated purpose. The autonomous, non-transparent and undemocratic nature of the board was recklessly exploited by its members. Westaway (Reference Westaway1994: 13) mentions multiple corruption scandals in her report on the administration of the Namaqualand. According to her interviewees people who got elected to the council changed their behaviour because they started to work in the corrupt and inefficient structure of the management board. The corruption scandals of board members that were sufficiently well founded even forced the House of Representatives to appoint commissions of inquiry and the resignations of board members. The board was abolished with independence in 1994 followed by a transitional council and the municipality structure of today.
With the Rural Areas Act 1 of 1979 the Minister had the power to reorganise the communal system which has been distinguished as inferior to commercial farming systems and a cause for rural poverty. The strong western influence (e.g. the imposition of western farming practices) and external interventions that the people in Namaqualand have been and are still facing can also be exemplified by the joint attempt of the apartheid administration and the local management board in 1984 to privatise the communal land into individualised, exclusive ‘economic units’ (May and Lahiff, Reference May and Lahiff2007). The establishment of ‘economic units’ worsened the skewed distribution of access to land and wealth and fuelled the divide among the inhabitants of the communal areas, because the majority of them lost access to grazing land. Although the broad majority of the population successfully opposed the privatisation, as the Supreme Court eventually overruled the system of ‘economic units’ in 1988, the local dispute ‘has left a legacy of factional division and bitterness’ within the communal areas (Cousins, Reference Cousins1996: 11). Internal tensions among the inhabitants of the study area in Namaqualand seem to have continued during the on-going land reform process since independence in 1994. The redistribution of former white-owned land especially abets affluent members of the communities and has led to ‘widespread discontent among those unable to access this land’ (May and Lahiff, Reference May and Lahiff2007). Given the legacy of maladministration and corruption in Namaqualand, the greater perceived crime and the lower trust in local Government and fellow citizens seem not surprising.
4.2. ‘WEIRD’ reciprocity: how high trust and low reciprocity can co-exist
The emerging picture from the previous section (4.1) is that higher trust in people and institutions is probably a result of a more supportive local government in Namibia which did not interfere with ethnic identity in the past and did not regulate grazing control (no privatisation attempts or limiting the number of livestock as in South Africa). The Namibian government further fosters self-governance of water institutions and thereby strengthens local identity. In this section I discuss the plausibility of different explanations for the observed phenomenon of ‘weird’ reciprocity (i.e. high trust and low reciprocity) starting with two economic arguments (selfishness and altruism) before moving to anthropological interpretations.
4.2.1. Adverse reciprocity of player 2
Selfish motives are the most obvious economic explanation for the low returns in Namibia. Not returning any money in the role of player 2 is also the Nash prediction. This can even be more appealing in an environment where people are poor and usually not anonymous. Also, Namibians are not poorer than participants from other trust games carried out in Africa. However, not reciprocating characterises a very untrustworthy environment in which everybody is trying to gain as much as she can. Taking advantage of others should go hand in hand with low trust and the expectation that people are untrustworthy. Trusting people in a society with no trust would not be a long-term equilibrium. Thus, we should not observe high trust. However, also survey measures of trust presented in section 4.1 suggest that Namibians report having high trust levels.Footnote 21
One could maybe think that the formerly practised semi-nomadic lifestyle and the very low population density in Namibia have created a situation where people interact less frequently with each other. Thus, encounters might more often be seen as one-shot which increases the likelihood and benefits of free-riding. This might be true for people living on the stock posts outside the villages (which were not included in the experiment). People living in the main settlements frequently interact with each other. Hence, one can assume the locally practised social norm to be one of common knowledge.
Last, Prediger et al. (Reference Prediger, Vollan and Frölich2011) showed that people in southern Namibia performed more cooperative and coordinated in a repeated common-pool resource experiment than their counterparts in the Namaqualand and also than participants of Janssen and Anderies (Reference Janssen and Anderies2011) in Colombia and Thailand. The important finding is not only the intact norms of cooperation but especially the higher degree of coordination which implies that people's beliefs about other peoples’ action are anticipated. Thus, a defunct expectation about the untrustworthiness of other villagers is quite unlikely given this evidence for the same population.
4.2.2. Redistribution and inequity aversion of player 1
Namibians have more family members staying close to them, which might activate altruistic behaviour. It could be that the amounts sent in Namibia were too high (and not the returns too low), and first players were playing a redistribution game instead of a trust game, using the means available to them, i.e. the standard trust game, to actuate redistributions that accorded with their own circumstances and the circumstances of those around them. However, from Table 1 we cannot conclude that individual income influences the return ratio. Player 2 in Namibia had on average 6800N$ compared with only 3500N$ (player 1) annual income available and thus one would rather expect the redistribution from player 2 to player 1 (i.e. high trustworthiness). Similarly, those first players of the Namibian participants who sent more than 50% of their endowment in the trust game had significantly lower income (t = 2.42; p<0.05) than those who sent less. The fact that the ‘poorer’ player 1 gave to the ‘richer’ player 2 makes any argument in favour of redistribution or inequality aversion very unlikely.
4.2.3. Generalised reciprocity
(a) Experimental evidence for generalised reciprocity. Generalised reciprocity is very similar to altruism as it implies to be generous and to share with members of your group without expecting an immediate return. Based on the design of a conventional trust experiment one cannot distinguish whether altruism or generalised reciprocity is the case.Footnote 22 In generalised reciprocity, the act of returning a gift is exhibited at a later point, when the experiment has already ended and not necessarily by the same person who offered the gift. Furthermore, in generalised reciprocity it is a sign of trust not to reciprocate immediately and thereby signalling the wish to start a social relation with that person. All these descriptions at least do not contradict the observed behaviour in Namibia.
There are also some important differences between altruism and generalised reciprocity: Norms and informal institutions can be defined (broadly following North, Reference North1990) as ‘socially shared rules, usually unwritten, that are created, communicated, and enforced outside of officially sanctioned channels’ (Helmke and Levitsky, Reference Helmke and Levitsky2004) while pure altruism is the act of giving because of enjoying the well-being of others (Becker, Reference Becker1974).Footnote 23 From the two definitions of a norm and altruism it follows that the violation of a norm is sanctioned and followed by a majority in the population irrespective of any personal characteristics like income, age or gender while altruism might more probably be based on a specific situation and emotions. The presented data show no influence from socio-demographic variables on the return ratio (Table 1) and a major part of the participants send as player 1 and keep the money as player 2, which suggests that people share similar beliefs which is the case for traditions and norms. Being altruist towards non-kin is certainly not a norm. There is neither a specific rule nor is it enforced by people if one does not behave altruistic towards a random person or villager.
According to Sahlins (Reference Sahlins1972), the form of reciprocity dominant in exchange is related to social distance. Generalised reciprocity occurs in tight-knit communities. An experimental study of Yamagishi and Kiyonari (Reference Yamagishi and Kiyonari2000) showed that in-group identification advances generalised reciprocity. The high social identity (especially) among (young) Nama people might have further amplified the expectation of in-group reciprocity.
(b) Anthropological evidence on exchange for the study region. The ‘high trust and low reciprocity’ phenomenon is not at odds with the description of generalised reciprocity. I will provide anthropological evidence on the practice of generalised reciprocity from the broader study region that the obtained results can be understood in the context of the Nama culture. This culture has been practised in Namaqualand of South Africa and is still today practised in southern Namibia.
Due to the erratic rainfall in semi-arid regions, risk among livestock owners is uncorrelated with the risk of others in the network. Risk sharing is a known advantage of many common property arrangements (Ostrom, Reference Ostrom1990). According to Klocke-Daffa (Reference Klocke-Daffa1999) the norm of generalised or delayed reciprocity is inherent to Nama culture and has evolved as a risk-sharing device by granting herd access in dry periods. The observation that this form of reciprocity serves as an insurance device among hunter–gatherers in Southern Africa was first made by Wiessner (Reference Wiessner1977). She found risk sharing to be the reason for delayed reciprocity (hxaro) among the !Kung. Later Cashdan (Reference Cashdan1985) argued that risk sharing is the main reason for the delayed or generalised reciprocity among the Basarwa, a former hunter–gatherer society, which now lives in settled communities and depends on cultivation and husbandry. Cashdan (Reference Cashdan1985) argues that people act economically by not minimising their short-term costs of exchange in order to reduce the long-term variance in income. Translating the norm of generalised reciprocity to the experiment implies that the first player in a trust experiment can enter a long-term risk-sharing arrangement by sending money to the other player. In the Nama society and in other societies where generalised reciprocity is practised as the dominant exchange mechanism, not immediately returning a gift symbolises high trust. The gift will only be returned when someone is in need.
4.2.4. Perceived framing and the use of norms
Reasons for carrying out behavioural experiments in the field are to increase the external validity of laboratory studies by getting a more representative sample, people that are more experienced in a specific task or people that might have developed certain norms of behaviour not found in student samples. While these ‘norms’ may be measured as a social preference (i.e. some societies are more or less cooperative), a norm may also be complicated and context specific. Especially participants not used to an artificial decision situation might define the situation of an unframed one-shot experiment according to a certain norm of behaviour relevant to their own framing. Cronk (Reference Cronk2007) explicitly tested the cultural framing with the Maasai in Kenya. He played a trust game labelled as ‘osotua game’ and found significantly lower transfers than in the unframed version since ‘osotua’ refers to gift-giving relationships based on obligation and need. Even without explicit framing Ensminger (Reference Ensminger, Henrich, Boyd, Bowles, Camerer, Fehr and Gintis2000) reports that participants in a public good experiment in Kenya labelled the experiment ‘harambee game’ according to the name of the local fundraising mechanism. While participants might perceive the situation in a way intended by the experimenter (i.e. relate a real-world public good mechanism to a public good experiment) the opposite might also be possible when a strong norm meets an experiment that is not intended to measure this norm explicitly (i.e. relate real-world sharing norm to a trust experiment).
While in the New Guinean ultimatum experiment (Tracer, Reference Tracer2003) participants did not want to enter a situation of (subordinate) exchange and obligation, participants in Namibia applied a deep-rooted behavioural norm to establish long-term relations for risk sharing. In both cases, however, participants neglected an important feature of the experiment (anonymity or one-shot situation). It might be possible that players in Namibia used a heuristic to frame the experiment according to the local norm of generalised reciprocity and acted as if they were in an everyday-life situation thereby neglecting the one-shot design of the experiment.Footnote 24 Conducting the experiment for several rounds would have most probably led to the adaptations of strategies according to the formal rules of the game. However, if players are bounded rational and not take into account the one-shot situation, and if generalised reciprocity is an essential part of Nama culture and culture is a ‘complex of interlocking and durable beliefs, customs and routines that permeates a group or community’ (Hodgson, Reference Hodgson2001: 297), then it is plausible that people apply this culture-specific behaviour in an unframed one-shot situation.
5. Conclusion
In this ‘within-culture across-country’ design of a standard trust game the following phenomenon was observed. In the South African Namaqualand measured trust was extremely low (only 21% of the initial endowment was sent), but reciprocity high, while in the bordering Namibian Karas region trust was high but reciprocity among participants was almost never practised (average proportion returned was 8% and 70% returned nothing). As stated in the seminal article by Gouldner (Reference Gouldner1960), reciprocity is one of the universal ‘principal components’ of moral codes. Looking at the existing literature on trust games one observes a high variance in individual behaviour but it seems that it is a self-evident reflex action to return at least some money for most participants. Similar to the ultimatum game experiments with the Au and Gnau where participants rejected hyper-fair offers (Tracer, Reference Tracer2003), this study also gives one possible explanation based on ethnographic accounts that paradox behaviour persists due to deep-rooted internalised social norms in Namibia. Seemingly, people follow and people use their learned heuristics and internalised cultural norms in a new and abstract decision situation like a one-shot, anonymous economic experiment. Namibian Nama participants perceived the experimental situation as a unilateral gift-giving game (according to the practised norm of generalised reciprocity) instead of a one-shot trust game. However, if the conclusion of generalised reciprocity for the Namibian sample is true, then the relationship between how participants make use of norms and how they define an abstract decision-making situation in an experiment might call for the use of slightly different experiments and/or qualitative interpretations. Thus, if participants unintentionally ‘frame’ the game (although it is not framed at all) then it would make sense to use intentional framing in artefactual field experiments in order to increase internal validity.
Results from laboratory experiments of the trust game and related one-shot games performed with student populations of industrialised countries do not necessarily possess external validity for different cultures and population pools, as humans are learning and norm-adopting individuals and people in other cultures have different experiences, traditions and norms. The standard trust game (Berg et al., Reference Berg, Dickhaut and McCabe1995) is a very intuitive and often-used measure for trust but external validity cannot be automatically achieved by ‘moving the lab to the field’ and correlating group and individual-level real-world factors with experimental data (Cárdenas and Ostrom, Reference Cárdenas and Ostrom2004). This approach might not be sufficient without additional experimental adaptations if results of the standard trust game are used to say something about local institutions or local resource management. While students or people in ‘weird’ countries are used to trusting strangers, people in remote areas are not. They interact daily with each other but not with strangers. The obtained trust measure is related to an unrealistic concept and is thus irrelevant for the everyday life of people that is governed by local institutions and frequent interactions. Most people in remote areas (and to a lesser degree elsewhere) ground trust in on-going relationships within their community, their actions are observed and restrained by strong norms of behaviour. For the same study region trust in family members and friends augments to 80% (Vollan, Reference Vollan2011).
The design of an experiment that researchers use depends on the purpose of their study. If their aim is to test (the failure of) theory then the evidence is important for theory building but not for a direct understanding of reality. Also Bardsley (Reference Bardsley2010) notes that economic experiments derived from theory are often too abstract and, thus, may provide improbable analogues to the stated topic. If their aim is to measure and compare social preferences across regions, one has to find an adequate measure. Finding the ‘right’ tools to measure social (and other) preferences in several contexts might be an interesting methodological topic for future research. For example, a recent study on sharing norms carried out by Lamba and Mace (Reference Lamba and Mace2011) showed that sharing salt (instead of money) yields different results from a formal economic game on cooperation. Increasing the sample size within each region (taking several villages) and including several regions seem as advisable as having reliable measures (not self-reported) for the difference in regions. Last, however, if the researcher aims at saying something on trust in developing countries that will shed some light on specific institutional factors, more realistic designs need to be developed. Using natural field experiments where people act in their normal environment (without knowing they are observed) and in-depth field observation seem to be fruitful methods to study context-dependent trust and trustworthiness. These methods account for the relational trust and a ‘normal’ decision environment. However, also laboratory experiments can be further developed. Although there is a risk of becoming too detached from economic theories and experiments in the laboratory, field laboratories that are designed to shed light on some concrete institutional problems should stepwise account for more realism in design features (more repetition, more framing, less anonymity and more communication) and/or using more realistic experiments (see e.g. Janssen and Anderies (Reference Janssen and Anderies2011), for an experiment with high ecological validity).
The field experiments in this case study either suggest that the Nama are a very selfish and untrustworthy group of people or that the Nama in Namibia practise a deep-rooted social norm that appears paradoxical to western concepts of trust and reciprocity. The practical importance of this question lies in the recommendation for future institutional improvement. The danger in Namibia might be that outsiders who have the autonomy to decide on local policies create conflict by legislating rules without being able to identify the strong local norms and cultural practices already in place, thus creating a situation where formal laws are in conflict with informal ones. In the Namaqualand of South Africa people are in a transition phase. Nowadays, South Africa's gross domestic product is much larger and growth faster compared with other countries in Sub-Saharan Africa. This coincides with the observation of Acemoglu et al. (Reference Acemoglu, Johnson and Robinson2001) that lower settler mortality and early institutions led to long-run economic growth. However, a downside of this development might be that minorities like the former Nama have lost their cultural identity without replacing it with new norms that match the challenge of managing collectively owned resources and advancing individual economic benefits. In the Namaqualand of South Africa it seems important to re-establish trust in local institutions and local leaders. Since the common land in both countries is managed without de facto legal enforcement of the Government, enforcing informal rules and norms among users is mainly done through communicating (dis)approval with other people's action.Footnote 25 However, often self-governance is more difficult in a society with a weak rule of law where people do not accept sanctions of others’ (Herrmann et al., Reference Herrmann, Thöni and Gächter2008). Therefore, an additional first step might be to make local decision-making structures and institutions more accountable, democratic and transparent in order to become legitimate to enforce local rules.