

INTRODUCTION
Compatibility in host-parasite systems can be defined as the state in which a parasite can establish infection and complete its development in a host (Basch, Reference Basch1975). Thus, compatibility is a joint trait of the parasite and host that probably depends on the genotypes of parasite and host at many different loci. Consequently, there is ample opportunity for complex genotype-by-genotype interactions: the phenotype of the host (susceptible/resistant) depends on the genotype of the parasite, and the phenotype of the parasite (infective/noninfective) depends on the genotype of the host (Lambrechts et al. Reference Lambrechts, Fellous and Koella2006). Genotype-by-genotype interaction is particularly apparent in the literature on compatibility between schistosomes and their snail first intermediate hosts (Richards and Shade, Reference Richards and Shade1987; Morand et al. Reference Morand, Manning and Woolhouse1996; Webster et al. Reference Webster, Gower and Blair2004; Theron and Coustau, Reference Prugnolle, Theron, Pointier, Jabbour-Zahab, Jarne, Durand and De Meeus2005). As an agent of human schistosomiasis, Schistosoma mansoni and its new world snail host, Biomphalaria glabrata, have been the subjects of numerous studies on the genetic basis of variation in compatibility between different laboratory strains of snails and parasite (here we use the term ‘strain’ to refer to a field isolate maintained in the laboratory for at least one generation). One consistent result, in study after study, is that snail strains that are naturally or selected to be highly incompatible with one particular schistosome strain, often remain highly compatible with other schistosome strains (Richards and Shade, Reference Richards and Shade1987; Webster and Woolhouse, Reference Webster and Woolhouse1998; Webster et al. Reference Webster, Gower and Blair2004). Susceptibility to particular schistosome strains can be highly heritable in snails (Richards and Shade, Reference Richards and Shade1987; Richards et al. Reference Richards, Knight and Lewis1992; Webster et al. Reference Webster, Gower and Blair2004). However, attempts to analyse the genetic basis of differences among particular snail strains in their susceptibility to a given schistosome strain have suggested a variety of mechanisms, including single or multi-locus inheritance, and either dominance or recessiveness of the trait (Richards, Reference Richards1975; Richards et al. Reference Richards, Knight and Lewis1992; Webster, Reference Webster2001). To date, only one candidate locus has been found to associate with compatibility in either parasite or host (Goodall et al. Reference Goodall, Bender, Brooks and Bayne2006; Bender et al. Reference Bender, Goodall, Blouin and Bayne2007).
Here we present compatibility studies conducted using lab and field samples of snails and schistosomes, all derived from the same natural population in Guadeloupe, West Indies. We show that results of compatibility trials depend very much on whether one uses laboratory-cultured or field-collected individuals. We lay out possible hypotheses to explain some of these results in the hopes of stimulating new research directions.
MATERIALS AND METHODS
Brief overview of experiments
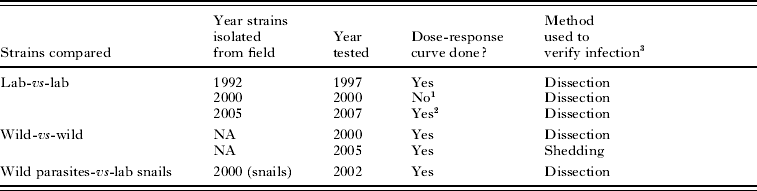
Snail-schistosome compatibility was tested through 4 main types of experiments (Table 1); (i) compatibility trails using lab strains of snails and schistosomes; (ii) compatibility trails using wild snails and wild schistosomes; (iii) compatibility trials involving first wild snails and parasites and later their corresponding snails and schistosomes after each of the first 3 generations of lab culture; finally (iv) compatibility trials using lab snails challenged by wild schistosomes.
Summary of experiments conducted
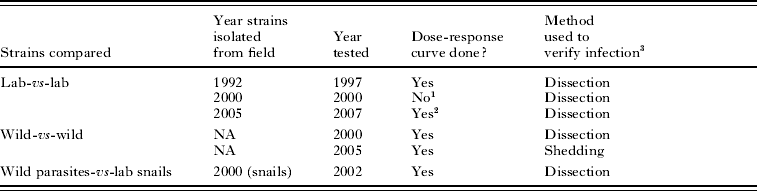
1 Challenges using 20 miracidia performed for first 3 generations of laboratory passage.
2 In addition, challenges using 20 miracida were performed every generation since the strains were established.
3 Snails were either fixed and dissected to count number of mother sporocysts (Dissection) or were observed for cercarial shedding 30 days post-exposure (Shedding).
Sampling site
All host and parasite samples in this study originated from the same transmission site at Dans Fond (DFO; N:16°18·500′, W:061°30·720′), located in the marshy forest of Grande Terre Island in Guadeloupe, West Indies (Theron and Pointier, Reference Theron and Pointier1995). This site has been the subject of numerous studies on the ecology, dynamics and genetics of larval and adult S. mansoni, their intermediate host, B. glabrata, and their definitive host, Rattus rattus (Sire et al. Reference Sire, Durand, Pointier and Theron1999, Reference Sire, Durand, Pointier and Theron2001a, Reference Sire, Langand, Barral and Theronb; Theron et al. Reference Theron, Sire, Rognon, Prugnolle and Durand2004; Prugnolle et al. Reference Prugnolle, Liu, De Meeus and Balloux2005a, Reference Prugnolle, Theron, Pointier, Jabbour-Zahab, Jarne, Durand and De Meeusb, Reference Prugnolle, De Meeus, Pointier, Durand, Rognon and Theron2006). Transmission is characterized here by very low prevalence in snails (0·6% on average), contrasting with very high infection rates (94%) and heavy schistosome loads (160 worms per rat on average) within the definitive hosts.
Measuring compatibility: snail exposure, infection rates and intensities
The level of compatibility for a particular snail-schistosome combination is traditionally quantified as the proportion of snails infected after individual exposure to a fixed number of miracidia (usually in the range of 5–20 miracidia). Snail infection rates vary with the parasite dose used (Theron et al. Reference Theron, Pages and Rognon1997), which makes it difficult to compare the outcomes of different studies. Therefore, compatibility between host and parasite populations or strains was evaluated by challenging individual snails with different numbers of miracidia. Although such dose-response curves are labour-intensive to produce, they are much more informative about the dynamics of compatibility between two strains than are single-dose challenges. All challenge experiments described in this study were conducted by the same person (A. Rognon), using the same protocols. For each experiment, snails (10–12 mm in diameter) were exposed individually to a fixed number of miracidia in approximately 10 ml of water for 8 h. Following exposure to miracidia, snails were replaced in their original containers until their infection status was assessed.
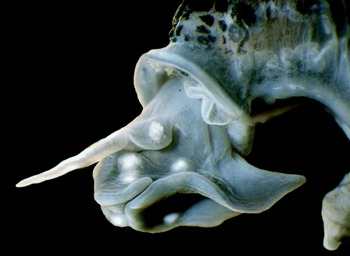
The infected or uninfected status of the exposed snails was detected by 2 different methods: (i) the shedding of cercariae 30 days post-exposure (the length of the pre-patent period); (ii) the presence of well-developed mother sporocysts (MSp) in the head foot region 15 days post-exposure. For the detection of mother sporocysts, the snails were fixed 15 days post-exposure following the methods described by Theron and Gerard (Reference Theron and Gerard1994). In brief, snails were relaxed in pond water containing an excess of crystalline menthol for 12 h. The snail body was removed and fixed in modified Raillet-Henry's solution. The number of MSp present in each snail was determined following exhaustive dissection of the head-foot zone. In this technique, MSp's were readily observable as translucent white bodies within an opaque grey tissue background (Fig. 1). For field-collected snails, the technique also allowed us to distinguish a posteriori between snails infected during the experiment from those naturally infected but undetectable because they were in the pre-patent period during sampling. This distinction is easily made by the presence of young daughter sporocysts in the hepatopancreas of the snails at the time of dissection.
Head-foot region of a Biomphalaria glabrata snail fixed 15 days post-exposure to 20 miracidia of Schistosoma mansoni. Six well-developed mother sporocysts of Schistosoma mansoni are clearly visible as white bodies within the snail tissue.

Compatibility trials using laboratory strains
Laboratory strains of snails and of schistosomes have been isolated from Dans Fond and established in our laboratory at the University of Perpignan 3 times: in 1992, 2000 and 2005 (Table 1).
The snail strains were founded each time using 100–150 uninfected founders from the field. The snail populations were allowed to expand quickly and were then maintained at a census size in the hundreds of individuals. Snails in the lab are allowed to breed freely, and the lab populations are not exposed to any deliberate selection. Note that although B. glabrata are hermaphroditic, they preferentially outcross and show Hardy-Weinberg equilibrium at molecular markers in both laboratory and field populations (Prugnolle et al. Reference Prugnolle, Theron, Pointier, Jabbour-Zahab, Jarne, Durand and De Meeus2005b; unpublished data).
The schistosome strains were founded each time using cercariae from 43–47 infected snails previously exposed to 20 miracidia hatched from eggs collected from the livers of 6 naturally-infected R. rattus. In the lab, schistosome strains are passaged each generation through 5 mice and approximately 24 infected snails (8–10 miracidia at exposure).
Compatibility trails were performed for snail and parasite strains established in 1992 and 2005 and tested after 5 years (Theron et al. Reference Theron, Pages and Rognon1997) and 2 years maintenance in the lab, respectively (labelled as ‘LAB 1997’ and ‘LAB 2007’ in Fig. 2A). Dose-response curves were obtained by challenging individual snails (45–50 snails per treatment) with doses of 1, 2, 5, 10, 20, 30 and 50 miracidia. The doses of 20 and 5 miracidia were omitted for the LAB 1997 and LAB 2007 experiments, respectively. For both experiments snail infection rates and parasite intensities were evaluated by mother sporocyst count.
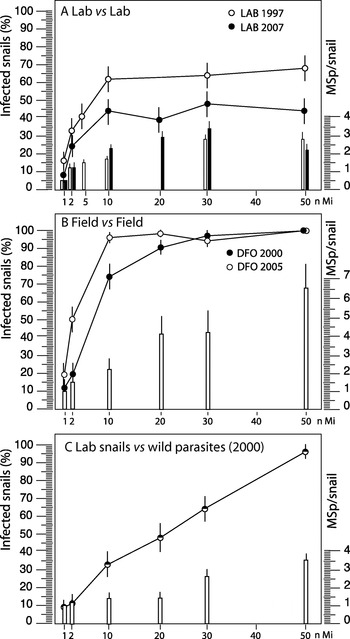
Infection rates (±1 standard error) of individual snails and mean number (bar±1 standard error) of mother sporocysts (MSp) per infected snail exposed to increasing doses of Schistosoma mansoni miracidia (nMi). (A) Both parasites and snails were maintained in the lab for 5 years. N=45 snails per dose. (B) Wild snails challenged with wild miracidia. Data are from 2 different trials in the DFO site. N=39–50 surviving snails per dose. MSp data were collected only in 2000. (C) Laboratory snails maintained for 2 years and then challenged by wild miracidia. N=39–45 surviving snails per dose.

Compatibility trials using wild schistosomes and wild snails
In 2000 and 2005 we generated dose-response curves using schistosomes and snails collected directly from the transmission site (i.e. never passaged in the lab). We refer to these experiments as ‘DFO 2000’ and ‘DFO 2005’. All challenges were conducted at the INRA-Duclos laboratory in Guadeloupe. The livers of heavily infected rats were crushed in a saline solution, and the homogenates were passed through different filters to finally retrieve only schistosome eggs. For each experiment, schistosome eggs were collected from 6 heavily infected rats (>100 worms/host) and placed in fresh water to hatch into miracidia.
Dose-response curves were obtained by challenging individual snails (50 snails per treatment) with doses of 1, 2, 10, 20, 30 and 50 miracidia (Fig. 2B). For the DFO 2000 experiment, all the snails were fixed 15 days post-exposure and dissected to count numbers of mother sporocysts per snail. Dissections showed no evidence of pre-patent infections in any of our field-collected snails. Also, the prevalence of infection in the field averages only 0·6%. Therefore we used the less-laborious cercarial shedding test for the DFO 2005 experiment on the assumption that pre-patent infections would be so rare as to not appreciably influence our results.
Compatibility during the first three generations of laboratory passage
In this experiment the change in compatibility between snails and parasites was followed in going from the field through the first 3 generations of passage in the laboratory. Here a single challenge dose (20 miracidia), was used rather than generating a dose-response curve each time. In 2000, one hundred field-collected snails were individually exposed to 20 wild miracidia. Fifty of these snails were transported back to our laboratory in France, and cercariae shed by 43 of the 46 survivors were used to infect mice and establish a schistosome strain. The remaining 50 wild exposed snails were fixed and dissected to measure infection rates and numbers of mother sporocysts per snail. The lab strain of snails was established from 100 uninfected, field-collected founders. After each of the first 3 generations of culture in France, 50 lab snails were each challenged with 20 lab miracidia. These were also fixed and dissected to measure infection rates and numbers of mother sporocysts per snail. The lab strains isolated in 2005 were tested in the field, and then after each generation of parasite passage, using a dose of 20 miracidia. We have continued testing them each generation, using the same dose.
Compatibility trials using wild versus laboratory snails or parasites
It would be ideal to also have replicated trials in which lab parasites were used to challenge field snails, and field parasites used to challenge lab snails. Owing to logistical constraints the only combination we were able to attempt was a single trial in which lab snails were challenged with field parasites. After the laboratory strain of snail established in 2000 had been in captivity for 2 years, 300 of these lab snails were transported to Guadeloupe to be challenged with wild miracidia. We generated a dose-response curve using these snails and the same protocols as for the wild-by-wild combinations. Infection rates and intensities (number of mother sporocysts per snail) were measured by dissecting each snail. Because we have not been able to replicate this experiment, we consider the results of this trial to be preliminary. They are presented here simply for the sake of completeness.
RESULTS
Laboratory schistosomes versus laboratory snails
The dose-response curve generated using the 1992 laboratory strains shows a rapid increase in infection rate up to a dose of 10–20 miracidia, but then levels off at about 65% infection (LAB 1997 in Fig. 2A). This result suggests that about 35% of the snails in the laboratory population were completely resistant to infection, regardless of the number of miracidia used to challenge. A very similar result was obtained with the 2005 lab isolates, except the curve levelled off at about 45% infection (LAB 2007 in Fig. 2A).
Wild schistosomes versus wild snails
Results obtained for the 2 wild-by-wild dose-response curves (experiments DFO 2000 and DFO 2005) are shown in Fig. 2B. Infection rates increased rapidly with increasing dose, reaching 90–100% at 20–30 miracidia, and 100% at the highest dose.
Change in compatibility in going from field isolates to laboratory strains
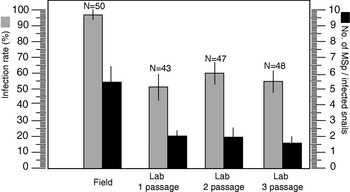
Among the 50 snails that were each exposed to 20 miracidia in Guadeloupe in 2000, 46 survived and 43 of those became infected (93·5%), shed cercariae, and were used to found the schistosome colony in our lab in France. Among the 50 other snails exposed in the same conditions and fixed, 48 harboured developed MSps (96%). The compatibility of this pair of strains using a dose of 20 miracidia dropped to 51·0%, 59·8% and 54·1% after 1, 2, and 3 passages through laboratory mice, respectively (Fig. 3). A similar pattern occurred with the strains isolated in 2005. Again, infection rates dropped from near 100% when wild snails were challenged with 20 wild miracidia apiece, to around 40% after a single generation of passage in the lab. We continue to check the infection rate after each passage, and it remains at about 40% to this day (mean±1 s.e.=41·2±2·8) – right in line with the results of the dose-response curve (Fig. 2A).
Snail infection rates (grey bar±1 standard error) and mean number (black bar±1 standard error) of mother sporocysts (MSp) per infected snail after exposure to 20 miracidia. Snails and parasites were both obtained from the wild population (Field) in 2000, and were then tested after 1, 2, and 3 laboratory generations of passage.

Wild schistosomes versus laboratory snails
Infection rates of laboratory-bred snails exposed to wild miracidia increased gradually to 95% at the highest dose (Fig. 2C). Interestingly, the shape of this curve differs from those of the wild-by-wild or lab-by-lab curves. Rather than quickly reaching a plateau, the infection rate increases almost linearly. So this result seems intermediate between those of the lab-by-lab and field-by-field trials. In this case lab snails appeared to be much more susceptible to groups of wild miracidia than to the same number of lab miracidia, yet not as susceptible as wild snails.
Infection intensities (establishment of mother sporocysts)
In the lab-by-lab trials, infection intensities rose gradually and then levelled off at approximately 2–3/snail after challenge by 10 or more miracidia (Fig. 2A). In contrast, in the wild-by-wild challenge the mean number of mother sporocysts (MSp) that developed within infected snails increased steadily to an average of 6·6±1·3 MSp/snail at the 50 miracidial dose (Fig. 2B), with a maximum of 16 MSp found in one snail. Infection intensities in the wild-schistosome by lab-snail trials (Fig. 2C) were lower than in the field-by-field trials, reaching a maximum of 3·4 MSp/snail at a miracidial dose of 50.
Figure 3 shows the change in number of MSps per infected snail during the first 3 generations of passage of the 2000 lab strains. Although a dose of 20 wild miracidia produced an average of 5·37 MSp per infected snail in Guadeloupe, that number dropped to 2·04, 1·92 and 1·63 MSp/snail over 3 generations of passage in the lab. Thus, as with the percentage of snails infected, the number of sporocysts per infected snail dropped precipitously after the first generation of passage, and then remained relatively constant thereafter.
DISCUSSION
Loss of compatibility in going from field to lab
In the year-2000 field trials a challenge with 20 wild miracidia produced 95% infection. Yet after a single generation of passage in the lab (of schistosome through the new lab snails) the percent infection dropped to 51% and remained between 54% and 60% for the next two generations. The same result was obtained when we established new strains of parasite and snail in 2005 – almost 100% infection in the field dropped to about 40% after a single passage in the lab, and stayed the same thereafter. The number of MSp established per infected snail also dropped after laboratory passage.
Thus it appears that in 3 independent isolations of schistosomes and snails from the same site, there was a massive drop in compatibility in going from field to lab. Even more intriguing is the observation that in 2 independent isolations of snails and parasites from the field, it appears that a large fraction of the lab snails became completely resistant to the lab strain of schistosomes. In stark contrast, we see 100% compatibility when wild snails are challenged with enough wild miracidia (above 20–30 miracidia), and much higher rates and intensities of infection at the lower doses (Fig. 2B).
There are 3 main hypotheses to explain these results. (1) Experimental artifact. The lab-vs-lab trials were conducted in France, and the field-by-field trials were conducted in Guadeloupe. Thus, some experimental factor might have been consistently different between the two settings. (2) Environmental effects. Something about the laboratory environment makes the parasite less infective and/or the snails more resistant. (2) Genetic effects. Either the snail population, the parasite population, or both underwent genetic changes during laboratory culture.
Experimental artifact
We took great pains to ensure that the trials conducted in the lab in Guadeloupe were as similar as possible to the trials conducted in the lab in France (the same person did all the trials, same equipment, etc.). Regardless, it is difficult to imagine how experimental artifact could produce the plateaus seen in the lab-by-lab curves, which suggest the existence of a completely resistant subset of the lab snail population. For example, if some factor (say the water) reduced the average infectivity of miracidia in the lab in France (or resistance of the snails), then the lab-by-lab curves would have shapes similar to those of the field-by-field curves, but simply with a lower inflection point. Thus, we think that the fundamentally different shapes of the two sets of curves really do reveal an interesting biological phenomenon that deserves further study.
Environmental effects
It is well known that the susceptibility of snails can depend on, for example, their size, age and physiological status (Anderson et al. Reference Anderson, Mercer, Wilson and Carter1982; Theron et al. Reference Theron, Rognon and Pages1998; Krist et al. Reference Krist, Jokela, Wiehn and Lively2004). So it is quite plausible that something about being raised in the lab environment makes snails more resistant. For example, perhaps nutritional status differs or some microbe or other stressor in the lab tank keeps the immune system of lab snails ramped up (Hertel et al. Reference Hertel, Bayne and Loker2002). But again, it is difficult to imagine a mechanism that would generate a completely resistant subset of the population, rather than just a higher average resistance per snail. An environmental effect on the parasite is also possible, although again we do not have any candidate mechanism that would render that strain of parasite completely unable to infect just a subset of the snail population.
Genetic effects
(1) Genetic change in the snails
The lab breeding colony of snails is never challenged, so any selected change must have been a correlated response to selection on some other trait that is inadvertently under selection in the lab. Genetic drift remains a possibility, but the lab colony was founded each time using more than 100 individuals, and remained large thereafter. Also, lab strains of B. glabrata tend to retain substantial molecular genetic diversity (e.g. Mulvey and Vrijenhoek, Reference Mulvey and Vrijenhoek1981; Campos et al. Reference Campos, Carvalho, Goveia and Romanha2002). Thus, it is hard to believe that just one or two generations of drift in the snails caused the changes we observed.
(2) Genetic change in the schistosomes
If selection is involved, one possible source is the definitive host. Rats are the definitive host in nature, but the parasites are passed through mice in the lab. It would be quite interesting if selection for performance in a novel definitive host resulted in a correlated response in infectivity to snails. Such a result would suggest that the parasite uses some common mechanism to infect both the intermediate and definitive hosts.
An even more plausible genetic explanation is rapid genetic drift in the lab schistosome isolate. The miracidium that infects a snail becomes a sporocyst that then undergoes a round of asexual reproduction that culminates in the release of thousands of genetically identical cercariae. In most labs, rodents are infected by being placed in water that contains cercariae shed by several infected snails. Thus, there is a huge potential for non-random variance among clones in transmission to the next generation if care is not taken to equalize the cercarial contribution from each snail. Strong selection among clones in going from the natural definitive host (rats or humans) to mice or hamsters in the lab would add an additional, non-random component to the among-clone variance in transmission success (e.g. high variance is seen among clones in their inherent infectivity to mice; J. Boissier, personal communication). Rodents are expensive to maintain, so most lab strains of S. mansoni are passed through only a handful of rodents each generation. A mouse can support 50–100 adult schistosomes at most. We have little idea what is the variance in family size (egg production) among adult worms, and thus what is the effective number of breeders per host that contributes to the next generation (Criscione and Blouin, Reference Criscione and Blouin2005). Thus, most lab strains of schistosomes probably undergo severe genetic bottlenecks beginning with the first generation of lab passage. Consistent with this prediction, molecular genetic studies show that lab strains of schistosomes have only a fraction of the allelic variation found in field samples, and they also show the distorted allele frequency distributions typical of bottlenecked populations (Cornuet and Luikart, Reference Cornuet and Luikart1996; Stohler et al. Reference Stohler, Curtis and Minchella2004).
A possible mechanism: matching alleles and bottlenecks
One hypothesis that would explain our results is that the success or failure of a challenge by one parasite depends on the matched/mismatched status of the host and parasite genotypes, as in matching-alleles models (Agrawal and Lively, Reference Agrawal and Lively2003; Basch, Reference Basch1975; Theron and Coustau, Reference Theron and Coustau2005). Any one snail and miracidium may have a modest probability of matching. However, as a snail is challenged with increasing numbers of miracidia, the probability of at least one match increases rapidly. Increasing the miracidial dose simply involves sampling a larger fraction of the phenotypic diversity in the parasite population. Under this model all snails eventually succumb when challenged by enough wild miracidia because the probability of at least one match approached 1·0. Such a system of phenotype matching could then explain the drop in compatibility after laboratory passage if the phenotypic variation is genetically based. If laboratory passage involves a more severe genetic bottleneck and loss of alleles in the parasite population than in the snail population, then a large fraction of the snails could quickly become ‘resistant’, owing simply to loss of compatible alleles in the schistosome strain. Under this scenario those snails are not ‘resistant’ to schistosomes per se. They are simply not matched by any individuals in the now genetically-depauperate lab strain of parasites.
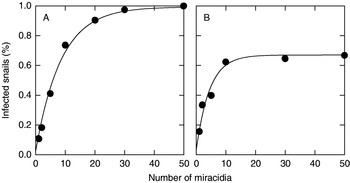
Such a genetically based system of phenotype matching could generate curves that look very much like those in Fig. 2A and B. If each miracidium has a low, but constant probability of matching a target snail, and if miracidia infect independently of each other, then the probability that a snail becomes infected when challenged by x miracidia can be written

where p=the probability of infection per miracidium. For example, in Fig. 4A we plotted Equation 1 with a value of p=0·11 in the same panel as the wild-vs-wild data from 2002. Curves like those in Fig. 2B, in which there appears to be a completely resistant subset of snails, can be generated simply by multiplying equation 1 by a constant, f, which is the fraction of snails that can be infected. For example, in Fig. 4B we plotted the 1997 lab-vs-lab data and equation (1) with f=0·67 and p=0·2.
Example of how simple models of independent infection with low individual infection probabilities can generate curves that look very similar to some empirical curves. (A) 2000 wild-by-wild data (circles) versus equation 1 parameterized with p=0·11 (line). (B) 1997 lab-by-lab data (circles) versus equation 2 parameterized by f=0·67 and p=0·2 (line).

One can also generate similar-looking curves via a matching genotypes model. Here the snail becomes infected if at least 1 miracidium in the pool of challengers carries the same (matching) genotype as the snail. The probability that a snail becomes infected when challenged by x miracidia equals

where N a=the number of genotypes present in the parasite population, h i=the frequency of genotype i in the host population, p i=the frequency of genotype i in the parasite population. If all snail alleles have a matching allele in the parasite population, then these curves will asymptote to 100% infection as x, the number of challenging miracidia, increases. If some snail genotypes are not matched by a genotype in the parasite population, then the curve will asymptote at f, the fraction of snails that can be matched.
The actual shapes of curves generated by Equation 2 will obviously depend on the particular allele frequency distributions in parasite and host populations. We can, a posteriori, choose parameter values that make the curves from Equation 3 fit some of our observed data quite well (Fig. 4). This does not mean we have proof for a matching genotypes model, but it does show that such a model remains a plausible explanation for our results.
Some possible consequences of using bottlenecked lab strains
If the bottleneck hypothesis is correct, then this could explain why studies to date show such a variety of genetic mechanisms and of strain-by-strain interactions. The chance loss or fixation of alleles at compatibility loci may cause different loci to appear overly important in controlling compatibility in different pair-wise combinations. In other words, in different studies a different set of loci may, by chance, explain a disproportionate amount of the variance in compatibility between particular lab strains. Loci that might be particularly misleading in that sense include loci encoding highly polymorphic systems of matching alleles that hosts use to recognize invaders, and/or invaders use to mimic hosts (Zhang et al. Reference Zhang, Adema, Kepler and Loker2004; Theron and Coustau, Reference Theron and Coustau2005). Here, the compatibility of any pair-wise combination could depend largely on which matching alleles were lost by chance during the domestication of each partner, and so would not predict compatibility with other strains, or with the original field populations. For example, this hypothesis predicts that if we had selected the apparently resistant fraction of snails revealed in Fig. 2A, we would have rapidly obtained a snail strain that is highly ‘resistant’ to that particular schistosome strain (we are currently conducting that experiment using the 2005 strains). However, in this case the proportion of snails that did not acquire infection would not be sensus stricto resistant to S. mansoni. They would simply be not matched by the reduced number of parasite genotypes contained within that particular bottlenecked laboratory strain of schistosome. Those snails might remain highly compatible with other schistosome strains that retain different alleles (cfTheron and Coustau, Reference Theron and Coustau2005).
We are not arguing that all variation in compatibility results from polymorphic systems of matching alleles. Compatibility is a complex process that involves many steps from recognizing the invader to preventing its successful establishment (Loker et al. Reference Loker, Adema, Zhang and Kepler2004). Indeed, the only resistance locus identified to date (Goodall et al. Reference Goodall, Bender, Brooks and Bayne2006; Bender et al. Reference Bender, Goodall, Blouin and Bayne2007) is clearly part of an effector mechanism – killing the parasite once it has been successfully recognized by the host. But the idea that using inbred strains causes different loci to be important in each strain-by-strain comparison would hold for any polymorphic, genetically based mechanism of resistance.
Some caveats
We recognize that replicated trials of each reciprocal combination of field-by-lab would have gone a long way towards identifying which species is responsible for the difference between lab and field trials. The one combination we were able to attempt (lab-snails vs field-schistosomes) produced intriguing results in that infection rates were, overall, lower than in the wild-by-wild combination, but there was no plateau. The higher infection rates are consistent with the bottleneck hypothesis. But, if parasite diversity was all that mattered, the curve should have looked just like the field-by-field curves, not the more gradual increase with dose that we observed. Taken at face value, this result suggests that something about the snails also changed in the lab. But until this result can be replicated, we hesitate to make too much of it.
Summary
To our knowledge, this is the first study to compare the results of compatibility trials using lab-reared and field-collected individuals from the same source populations. We showed that even a single generation of laboratory passage had a large effect on the results of compatibility trials. Barring experimental artifact, possible explanations include environmental effects on either host or parasite, and genetic change in either host or parasite. We suggest one possible mechanism that could produce curves very much like those observed. The bottleneck hypothesis could explain much of the highly variable strain-by-strain compatibilities that are so apparent in the literature on schistosomes and their snail hosts.
We thank Hervé Mauleon (INRA, Domaine Duclos) for logistical support in Guadeloupe, and Jean-Pierre Pointier for help with field samples. This work received financial support from the CNRS (EDD), and the Ministère de l'Ecologie et du Développment Durable (Ecosystèms Tropicaux n° 752600). Thanks to C. Bayne, J. Tennessen, C. Adema and M. Steinauer for comments on earlier drafts. M. Blouin's sabbatical at CNRS-UPVD was supported by the University of Perpignan and Oregon State University.