Introduction
Microscale mechanical testing is a powerful technique for exploring localized mechanical response of small volumes that facilitates a more detailed analysis of deformation mechanisms, especially when coupled with modeling. Examples of successfully downsized mechanical testing techniques include indentation, compression, tension, and cantilever/bend testing. While some of these techniques feature pure uniaxial compression/tension loading or mixed modes, data from the tests can be used in the determination of shear stresses in a system. For microcompression or microtension tests, the resolved shear stress (RSS) can be calculated provided the knowledge of the specimen orientation with respect to slip planes is known.
One phenomenon observed in microscale testing was the increase in yield strength with a decreasing volume, with some of the original experiments reported in Cu [Reference Fleck, Muller, Ashby and Hutchinson1]. Not all of the increase in yield strengths arise from the same source. In indentation studies, for instance, the higher hardness observed with shallower indentation depth arises from the large strain gradients that give rise to geometrically necessary dislocations [Reference Poole, Ashby and Fleck2, Reference Nix and Gao3, Reference Gao, Huang, Nix and Hutchinson4, Reference Huang, Xue, Gao, Nix and Xia5, Reference Durst, Backes, Franke and Goken6]. Micromechanical structures (e.g., pillars), on the other hand, showed higher yield strengths and were found to come from dislocation starvation or the limited dislocation sources in the test volume [Reference Uchic, Dimiduk, Florando and Nix7, Reference Greer, Oliver and Nix8, Reference Kiener, Motz, Schöberl, Jenko and Dehm9, Reference Kiener, Motz and Dehm10, Reference Kim and Greer11, Reference Frick, Clark, Orso, Schneider and Arzt12, Reference Kim, Jang and Greer13, Reference Jennings, Burek and Greer14, Reference Soler, Wheeler, Chang, Segurado, Michler, Llorca and Molina-Aldareguia15, Reference Wu, Heidelberg and Boland16, Reference Budiman, Han, Greer, Tamura, Patel and Nix17]. In turn, the calculated RSS from these tests showed a strong size effect, albeit with a trend equivalent to that observed in the normal stress in the system. A question arises as to whether or not a more direct method of measuring shear stress on the microscale is possible and if it is influenced in a similar manner by such size effects.
Torsion tests are generally employed to determine shear properties of materials due to pure shear loading on the specimen. While a few of systems have been developed and demonstrated the capability to perform microscale torsion tests, there are a number of issues with the configuration [Reference Fleck, Muller, Ashby and Hutchinson1, Reference Walter and Kraft18, Reference Liu, He, Dunstan, Zhang, Gan, Hu and Ding19, Reference Dai, Huan, Gao, Dong, Liu, Pan, Wang and Bi20]. Limitations with early torque transducers restricted the range of torques and sample sizes measurable, although this has been alleviated with improvements to the transducer that enable more accurate measurement of shear properties over older designs. All systems, however, require freestanding wires or the capability to produce similar specimen geometries. This generally precludes the isolation of specific microstructural features or interfaces, as well as a number of specimen forms (e.g., films).
Few studies have studied shear on the microscale using commercially available micromechanical testing equipment such as pico/nanoindentation load frames. The major advantage of using this equipment is not only the ease-of-use and access, but also the high load and spatial resolution. Furthermore, conventional specimen preparation (i.e., focused ion beam milling) enables the characterization of a wide range of specimen geometries. Previous studies using microscale shear testing focused on single-crystal Au and Cu with the surface oriented along the [Reference Fleck, Muller, Ashby and Hutchinson1–Reference Kiener, Motz and Dehm10] direction using a double-shear specimen [Reference Heyer, Brinckmann, Pfetzing-Micklich and Eggeler21, Reference Wierczorek, Laplanche, Heyer, Parsa, Pfetzing-Micklich and Eggeler22]. In this configuration, direct activation of the [Reference Fleck, Muller, Ashby and Hutchinson1–Reference Kiener, Motz and Dehm10] (111) slip system was demonstrated and observed in situ via a scanning electron microscope (SEM).
Beyond single-crystal systems, interfaces and grain boundaries provide an exciting avenue of research to perform using micromechanical testing due to the ability to isolate these features. For thin film systems, nanoscratch tests are among the more popular tests for evaluating adhesion [Reference Wierczorek, Laplanche, Heyer, Parsa, Pfetzing-Micklich and Eggeler22, Reference Steinmann, Tardy and Hintermann23, Reference Larsson, Olsson, Hedenqvist and Hogmark24, Reference Beak, Harris and Liskiewicz25]. This test involves pushing a hard tip into contact with the film at a prescribed load and moving it laterally across the surface. One major drawback to this technique is that the response is a combination of the film, substrate, and interface. This combined response complicates the direct evaluation of the interface. If the coating is sufficiently thick, then a variety of micromechanical structures can be produced. Microcantilevers, clamped beams, and micropillar testing all provide unique approaches to evaluating the interface strength of coatings [Reference Maio and Roberts26, Reference Matoy, Detzel, Muller, Motz and Dehm27, Reference Schaufler, Schmid, Durst and Goken28, Reference Chen, Mu and Meng29, Reference Mu, Zhang, Hutchinson and Meng30].
Microcantilever specimens are a simple geometry that can easily isolate interfaces, but suffer from a mixed loading scheme that renders nonbrittle failure difficult to interpret without use of modeling. Additionally, Ga implantation in the notch tip can influence the result, although this may be avoided by etching a notch at a glancing angle. Micropillar testing, on the other hand, requires the interface to not be aligned parallel or perpendicular to the loading direction. Further, the method provides the most direct measurement only if the materials are sufficiently different (i.e., ceramic/metal), otherwise the response includes the deformation behavior of the two materials. Beam bending, however, has been utilized successfully to measure the interface strength between two nonbrittle materials [Reference Wu, Zhang, Liu, Zhang, Cheng, Li, Zhang and Sun31, Reference Radchenko, Anwarali, Tippabhotla and Budiman32]. The main drawback to this approach is that the test requires complementary modeling in order to extract the interfacial strength and judicious observation to determine when delamination has occurred.
A novel structure was recently developed by Mayer et al. for evaluating interface properties in an Al–SiC multilayer system [Reference Mayer, Li, Mara and Chawla33]. Rectangular, micron-sized “S” shear beam specimens were fabricated for ex situ testing and transmission electron microscopy (TEM) transparent specimens for in situ studies. Deformation was observed to occur in the designed shear region, and localized in the Al layer and at an Al–SiC interface. It should also be noted that the shear design used by Mayer et al. possesses an intrinsic disadvantage as the shear region is coupled to the dimensions of the pillar. For materials that have a shear yield close to the tensile yield, special care must be taken to select geometries that exhibit simple shear, rather than mixed loading. Furthermore, it was not demonstrated for ex situ testing how interfaces located in the bulk of the material might be isolated to study the shear response.
Recent improvements to conventional macroscale shear specimen designs (e.g., double shear, top hat) made by Gray et al. produced a compact shear specimen with a single shear region and localized shear near the interface [Reference Gray, Vecchio and Livescu34]. Testing along multiple orientations for heavily textured materials resulted in the formation of shear bands and grain rotations up to 25° along the shear direction in the shear region, similar to microstructural changes observed in conventional shear designs. The principal success for this design was that, unlike other designs which often have a complex/mixed stress state, the stress state in the gage section is simple shear [Reference Peirs, Verleysen, Degrieck and Coghe35, Reference Mayr, Eggeler, Webster and Peter36]. In this study, we draw upon these recent advances to develop a design and recipe for fabricating microscale shear specimens in the bulk material and at interfaces or boundaries of interest.
Results
Single-crystal Cu
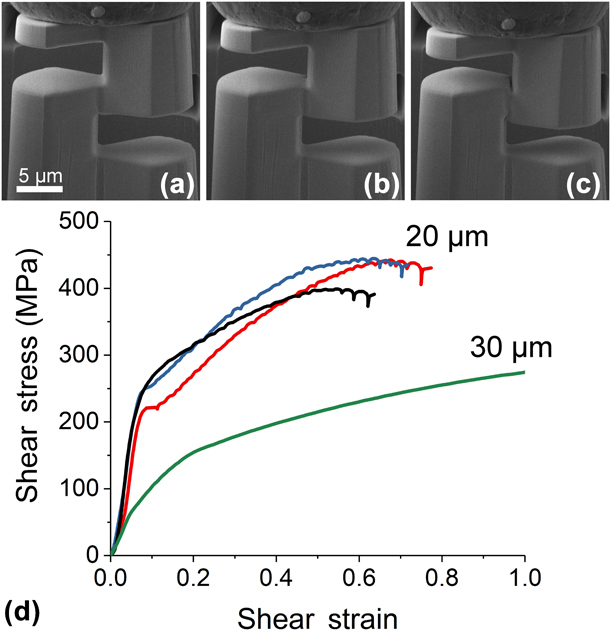
Figure 1 provides the shear response of the shear specimens fabricated in the single-crystal Cu. Figures 1(a)–1(c) show the specimen before loading, after yielding, and just before fracture, respectively. Shear stress–shear strain curves for both 20-μm specimens and a typical 30-μm diameter specimen are provided in Fig. 1(d). For the compression of single-crystal Cu specimens, loading is applied close to the [111] direction (Schmid factor of ∼0.28) with the resulting response exhibiting a comparatively large amount of strain hardening and a few load drops occurring before fracture. Furthermore, the yield stress for the shear specimens with a nominal diameter of 20 μm is significantly higher than that previously obtained by double-shear testing [Reference Wierczorek, Laplanche, Heyer, Parsa, Pfetzing-Micklich and Eggeler22]. The larger shear specimens (nominal diameter of 30 μm) yielded at a stress several times lower than the smaller counterparts. Livingston et al. investigated the influence of dislocation density on the RSS in pure Cu and found a square root dependence through a range of dislocation densities [Reference Livingston37]. We note the possibility that the single-crystal copper specimen used in this study had a higher dislocation density because of the preparation that led to a higher than expected shear yield measured in both specimens.
Shear response of a 20-μm single-crystal Cu(111) specimen (a) before loading, (b) after yielding, and (c) before fracture. Shear stress–shear strain curves of 20 μm and a 30-μm diameter shear specimens provided in (d).
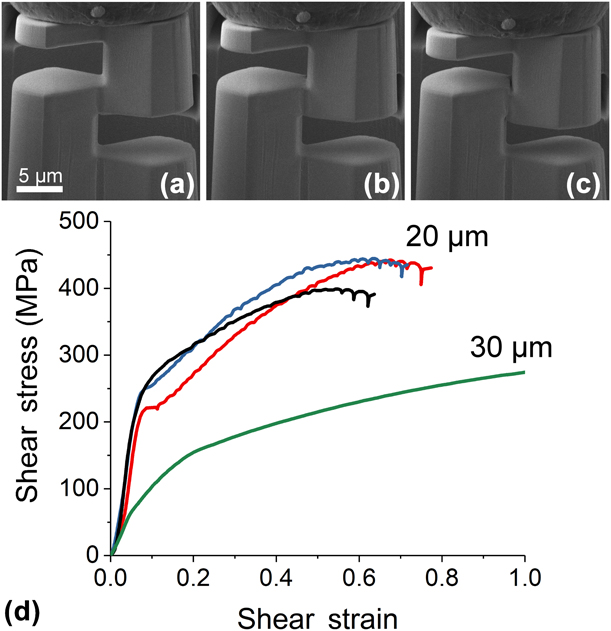
The large discrepancy in the deformation behavior of the 20- and 30-μm shear specimens, notably in the flow stress at low strain value, is somewhat surprising and not fully accounted for by dislocation content. A similar phenomenon has been observed previously in several simple metal systems under micropillar compression and torsion [Reference Fleck, Muller, Ashby and Hutchinson1, Reference Kiener, Motz, Schöberl, Jenko and Dehm9, Reference Kiener, Motz and Dehm10, Reference Frick, Clark, Orso, Schneider and Arzt12, Reference Jennings, Burek and Greer14]. The RSS in our shear specimens at 10% strain is ∼55 MPa, lower than the data presented in [Reference Kiener, Motz and Dehm10] for either micropillars made in Cu(100) or Cu(111) and polycrystalline Cu in macroscale tension tests. However, the difference in RSS between pillars differing in diameter by a factor of two is no more than a factor of 1.2–1.5, with smaller differences at larger pillar sizes. For our specimens, the difference in shear stress between the two sizes tested in this study is a factor of 2.
It was noted by Frick et al. that sink-in of the pillars may cause dislocations to reach the support region underneath the pillar and immobilize due to the insufficient stress in those regions, resulting in higher than expected stresses [Reference Frick, Clark, Orso, Schneider and Arzt12]. The analogous case for our specimen is that dislocations may move to the supports of the shear specimen but become immobile at low strain due to the low stress in the supports, a hypothesis supported by Fig. 2. The difficulty in comparing shear stress data obtained from pillars at small length scales is partially due to the fact that the free surface-to-volume ratio on a pillar is much larger than that for our specimen design. Additionally, aside from the different loading configuration, the shear region is surrounded by a larger volume of the same material on two sides, compared with one with a micropillar. Because there is no good equivalence established for shear specimens, comparisons with the literature are difficult. Further experiments are planned to explore the effect of size on this shear specimen design.
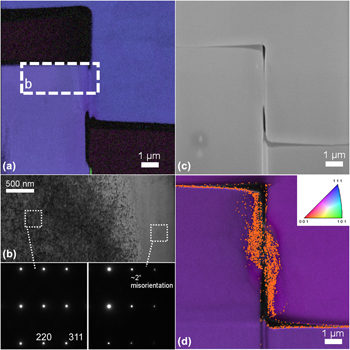
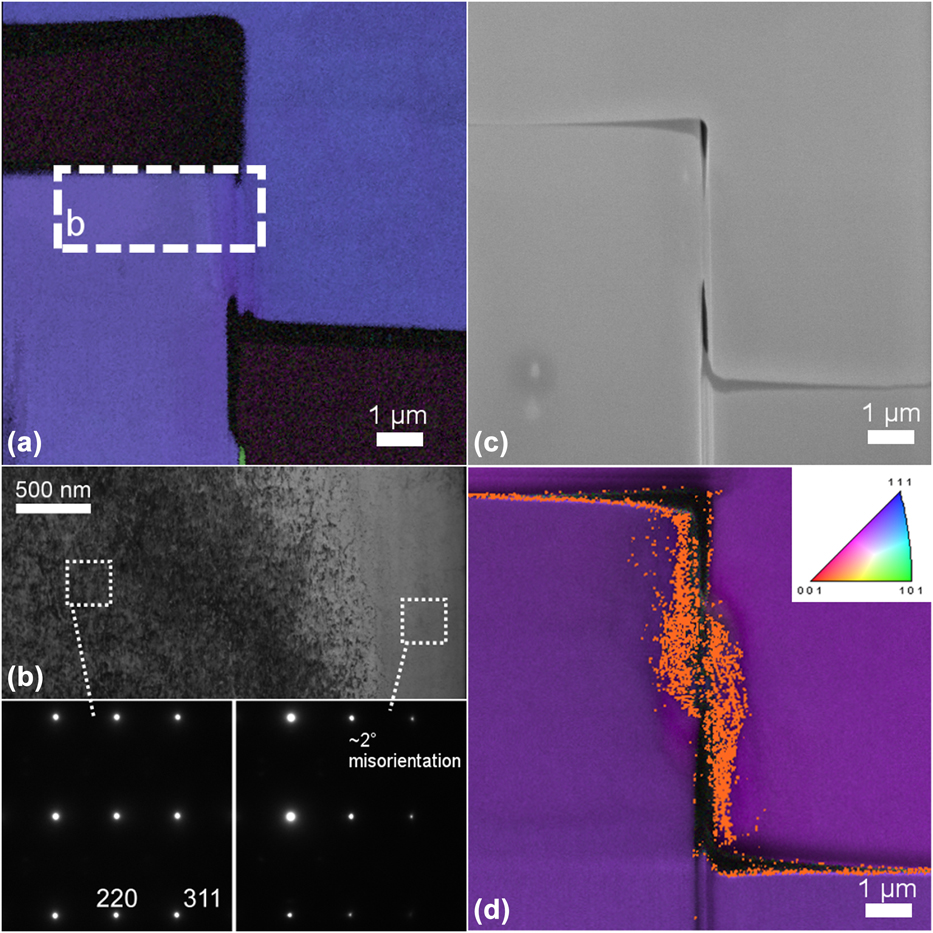
(a) EBSD map in a shear specimen and (b) bright-field TEM of the shear region just after yielding. Inset diffraction patterns near the [112] zone axis for the unaffected bulk and shear region. (c) SEM micrograph of a shear specimen after fracture. Inverse pole figure with orange highlighting in (d) indicates regions with a misorientation >1°.
Irrespective of specimen size, there is a notable difference in the strain-hardening response of the single-crystal Cu specimens in this study compared with those with the slip plane oriented parallel to the loading direction (Schmid factor is ∼0) [Reference Wierczorek, Laplanche, Heyer, Parsa, Pfetzing-Micklich and Eggeler22]. Wierczorek et al. observed shear with less strain hardening in Cu specimens with loading parallel to the  $\left[ {0\bar{1}\bar{1}} \right]$ direction. It is important to note in our specimens that at larger strain values (>0.5) a significant reduction in the shear area appears.
Figure 2 provides a post-compression examination of a compressed 20-μm single-crystal shear specimen. Figure 2(a) shows an EBSD image of a shear specimen lift-out just after yielding. The map reveals a small degree of orientation change in the shear region near the left support. The inset box labeled “b” in Fig. 2(a) outlines the location where TEM was performed. Figure 2(b) shows a bright-field micrograph of the region with the lamella tilted such that the support region (far from the shear region) was oriented along the [211] zone axis. An inset diffraction pattern of this region is shown on the bottom left of Fig. 2(b) with two diffraction spots labeled. A distinct difference in strain contrast arising from crystallographic orientation is observable and the angle of this boundary matches that between the  $\left( {\bar{1}11} \right)$ slip plane and the (111) plane when viewed at this orientation. At the same tilt condition, another diffraction pattern was taken near the shear region which shows a misorientation of ∼2°.
Figure 2(c) shows an SEM image of a single-crystal shear specimen after fracture. A clean fracture between the two supports is observed without significant deformation outside of shear region. A corresponding EBSD map is provided in Fig. 2(d) with an orange coloration marking regions with a misorientation >1°. Deformation in the shear region does not extend beyond ∼1 μm into either support. The result shows that, despite the fact that slip planes were not oriented parallel to the shear loading direction, shear is localized.
Nanocrystalline Cu film
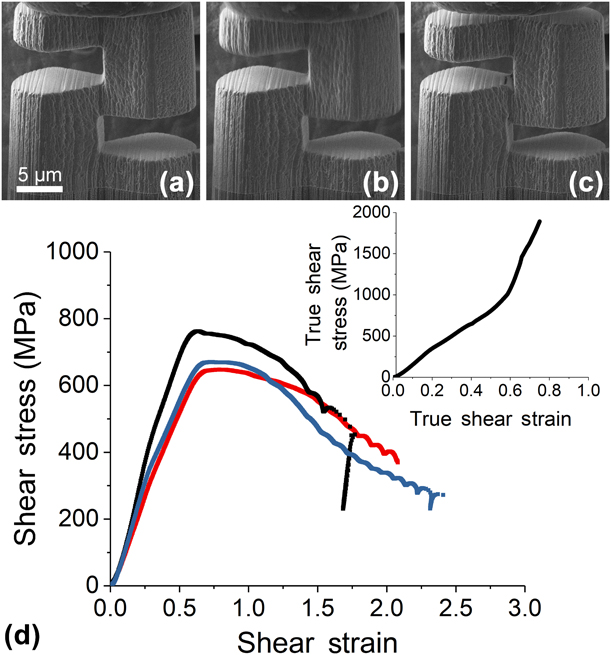
Figure 3 provides the shear response of nanocrystalline Cu microshear specimens with the shear area oriented along the film growth direction and fabricated from the top surface of the film, referred to as orientation “A”. Figures 3(a)–3(c) show the shear specimen before loading, after yielding, and before fracturing, respectively. Figure 3(d) provides shear stress–strain curves and a typical true shear stress–strain curve for reference. Microshear testing on these specimens demonstrated a yield stress three times greater than the single-crystal counterparts. Figure 3(c) shows the presence of potential cracks near the top edge of the shear region just before fracture. While there is a more pronounced decrease in stress after yielding, the true stress–strain curve suggests that no softening occurred in the system. Strain softening is a well-known phenomenon occurring in many nanocrystalline materials and has also been observed in nanotwinned Cu under tensile stress when dislocation emission from twin boundaries and grain boundaries are the primary deformation mode [Reference Meyers, Mishra and Benson38, Reference Tang and Schoenung39, Reference You, Li, Gui, Lu, Zhu, Gao and Lu40].
Shear response of a nanocrystalline Cu specimen with the shear plane oriented parallel to the growth direction (a) before loading, (b) after yielding, and (c) before fracture. Shear stress–shear strain response of nanocrystalline Cu shear specimens provided in (d) with a true shear stress–strain curve inset for reference.
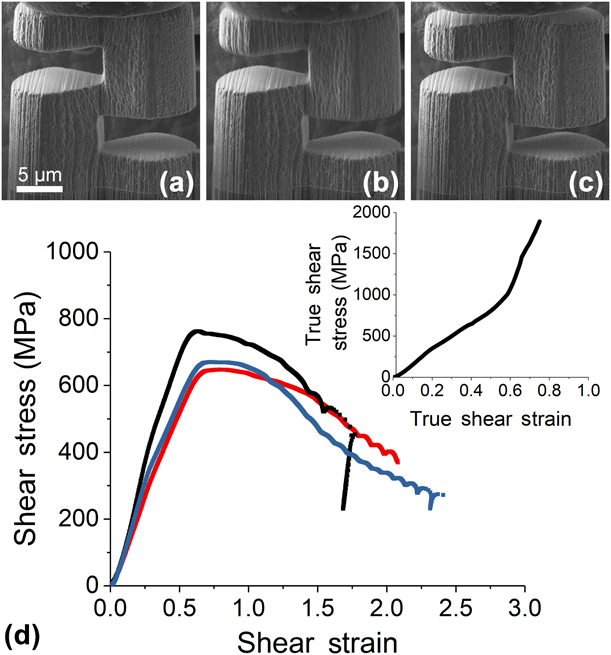
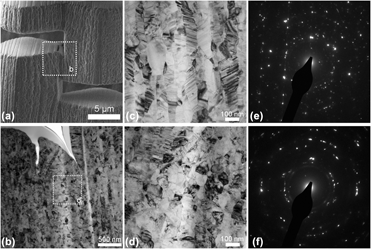
Figure 4 shows an examination of a nanocrystalline shear specimen compressed to a strain value of ∼1.5 (before failure). The dashed square in Fig. 4(a) indicates the location where a lamella was lifted out for TEM analysis shown in Fig. 4(b). In this region two separate cracks nucleated from the surface and extended down to a depth of ∼500 nm below the original surface. To understand the impact of shear stress on the microstructure, TEM micrographs of the film far from the shear region and in the shear region [dashed box in Fig. 4(b)] are provided in Figs. 4(c) and 4(d), respectively. Selected area diffraction patterns of the regions in Figs. 4(c) and 4(d) are provided in Figs. 4(e) and 4(f), respectively.
(a) SEM micrograph of a shear specimen with the shear plane oriented parallel to the growth direction before fracture with a dashed box indicating the region examined via bright-field TEM in (b). (c) Microstructure of the nanocrystalline-Cu far from the shear region. Dashed box in (b) denotes the shear region examined in (d). Selected area diffraction patterns of the (e) support and (f) shear region, respectively.

In the support regions, the Cu film features a microstructure with large elongated grains 50–70 nm in width and 200–500 nm in length, oriented along the growth direction. Under loading, two distinct behaviors are observed in the shear region. Near the upper portion of the shear region [Fig. 4(b)], the larger elongated grains are observed to rotate up to 35° under the large stresses present. Although the grain changes deeper into the shear region are not as clear, the bright-field micrograph [Fig. 4(d)] shows grain evolution into a more equiaxed microstructure with a corresponding change in size to ∼80 nm. Furthermore, the narrow twins observed in the support regions are notably absent in the shear region. Figures 4(e) and 4(f) indicate that no significant change in texture has occurred from the deformation process.
It was previously reported that under large compressive strains, twins annihilated in nanocrystalline Cu [Reference Anderoglu, Misra, Wang, Hoagland, Hirth and Zhang41, Reference Wang, Li, Anderoglu, Zhang, Misra, Huang and Hirth42, Reference Li, Wang, Huang, Misra and Zhang43]. This conclusion was reached under the assumption that the expected twin size should decrease after compression, provided no significant changes to existing twins or grain boundaries occurred. Instead, nanotwins remained in the material after deformation, albeit with a slight enlargement of the twin thickness. The previous models and observations of nanotwinned Cu may not necessarily hold in our system, as deformation mode differs with that used previously [Reference Anderoglu, Misra, Wang, Hoagland, Hirth and Zhang41, Reference Wang, Li, Anderoglu, Zhang, Misra, Huang and Hirth42, Reference Li, Wang, Huang, Misra and Zhang43, Reference Li, Wang, Zhang and Misra44], in addition to the significantly higher strain levels and lower twin density.
Si–Cu interface
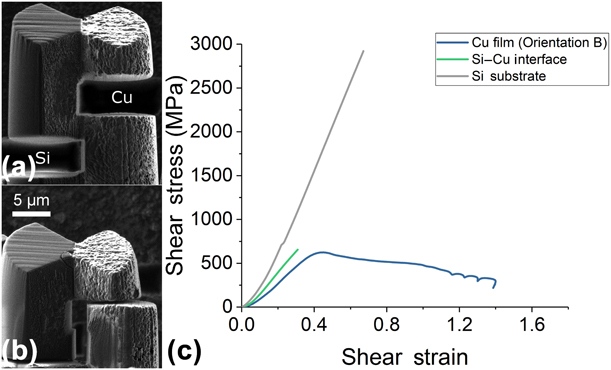
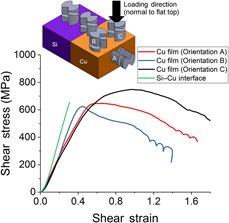
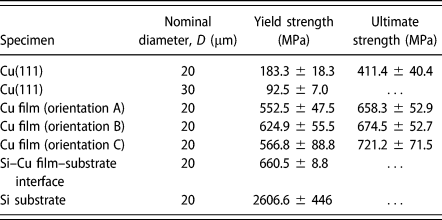
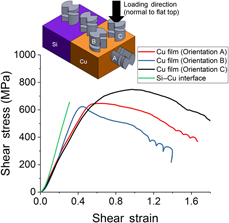
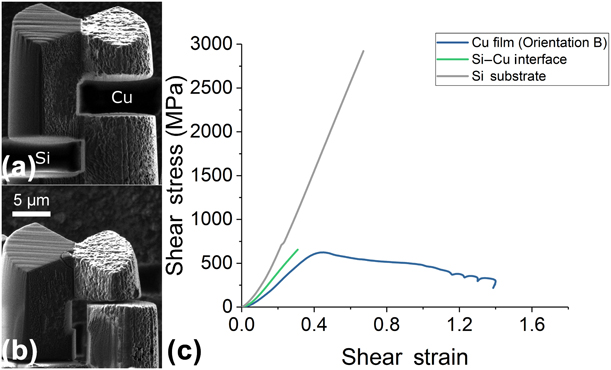
One of the critical advantages to the design of this shear specimen is the capability to target specific boundaries, defects, or regions in the microstructure. As a proof-of-concept, we milled shear specimens at the interface of a deposited Cu film and Si substrate. During the fabrication process, the interface was placed near the middle of the shear region (within 2 μm). In addition to shear specimens at the interface, three sets of specimens were fabricated. One set was placed in the silicon substrate. Two sets were placed in the film with orientations “B” and “C”. Orientation B specimens have a shear plane parallel to the growth direction and were fabricated on a surface perpendicular to the top surface of the film. Orientation C specimens have a shear plane normal to the growth direction. Figures 5(a) and 5(b) show the specimen before loading and after fracture. Typical engineering shear stress–strain curves for the Si, Cu–Si interface, and orientation B Cu shear specimens are provided in Fig. 5(c). Figure 6 compares the shear stress–strain curves of each shear specimens with each orientation in the film and at the interface, with an inset schematic of the shear specimen orientation and location provided. Table I summarizes of the shear response of specimens examined in this study.
Shear response of a shear specimen placed at the interface of the silicon substrate and nanocrystalline Cu film (a) before loading and (b) after fracture. Shear stress–shear strain curves of shear specimens in the silicon substrate, interface, and with orientation B in the film provided in (c).
Shear stress–strain response of specimens placed in the nanocrystalline Cu film with orientations A, B, and C and specimens placed at the interface of the silicon substrate and nanocrystalline Cu film. A schematic of the specimens with the respective locations and orientations provided as an inset in the figure. Loading is applied normal to the flat top surface on the shear specimens. An illustration is provided for orientation C.

Shear yield and ultimate strengths for shear specimens in single-crystal Cu, nanocrystalline Cu film, and at the Cu film and Si substrate interface. The 30-μm diameter shear specimens were not compressed sufficiently to observe fracture behavior.
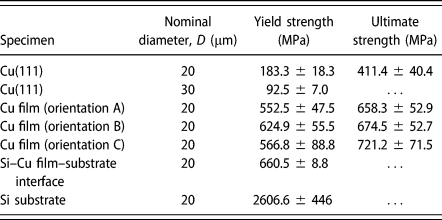
The shear response of the film, substrate, and interface all show dramatically different responses, with notably different characteristics for shear specimens in the nanocrystalline Cu film. The shear response of orientation B specimens in the film closely matches the observed behavior of the specimens fabricated from the top surface of the film (orientation A) shown in Fig. 3, but with a slightly higher elastic stiffness and yield strength. With this configuration, little strain hardening in the engineering stress–strain curve is observed after the yielding, similar to orientation A. Shear specimens with orientation C deformed in a markedly different way. A similar elastic modulus and yield strength to orientation A specimens was observed. However, the shear specimens exhibited more strain hardening up to a slightly higher ultimate strength, resulting in a larger amount of deformation before reaching a maximum shear stress.
One major source for the observed deformation behavior of shear specimens in the nanocrystalline film arises from the anisotropic nature of grains in the microstructure and the different loading configurations with respect to the grains. Orientations A and B have shear planes parallel to the growth direction, thus inducing stress parallel to the elongated grains. Similar loading configurations and subsequent shear response was also observed in macroscopic shear testing in Al with elongated grains [Reference Mayer, Li, Mara and Chawla33]. On the other hand, Orientation C shear planes are perpendicular to the growth direction and thus induce stress perpendicular to the elongated grains, resulting in different shear behavior. That is, based on their orientations with respect to the microstructure, shear specimens with orientation C contain a higher density of grain boundaries intersecting the shear plane, while shear specimens A and B contain a lower density of grain boundaries intersecting the shear plane.
There may be other, albeit minor, contributions to the different shear responses arising from other microstructural properties. For highly textured films, it would be reasonable to attribute the differences in strain hardening to activated slip systems. However, Fig. 4(c) and the inset diffraction pattern suggest that the system is not strongly textured. Another consideration to be made is the influence of twins on the shear response. You et al. showed that twin boundary orientation plays an important role in the hardening behavior and should be considered [Reference You, Li, Gui, Lu, Zhu, Gao and Lu40]. In our system, twins were observed to be oriented between 60° and 90° to the growth direction. Although there are not major differences in the yield stress, ultimate shear stress, and strain hardening up to the yield point between orientations A and B, the response after yielding suggests the possible influence of twins on the deformation behavior.
Shear in the silicon substrate showed the expected brittle fracture behavior of silicon at room temperature with a fracture stress significantly higher than the single-crystal or nanocrystalline copper specimens. The shear response of specimens at the interface displayed a mixed behavior between the response of the Si substrate and the nanocrystalline Cu film, notably in the elastic stiffness. Fracture of the specimens occurred at a value similar to the ultimate shear stress of the nanocrystalline specimens. However, the stress–strain curve shows a lack of plastic deformation beyond the yield point, indicating the phenomenon of brittle failure. The shear response at the interface is unique compared with all shear specimens, as it lacks both significant plastic deformation and high yield strength, suggesting that the mechanical response of the film–substrate interface response is directly probed with this technique.
Discussion
Although the compression of interfacial and single-crystal (Si and Cu) microshear pillars provides a clear view on the deformation behavior, the nc-Cu microshear specimens present a more complicated picture of the mechanical response of the respective systems. One of the shortcomings of the present work is that a picture of the microstructural deformation in the material is provided only at the outset of a test (very low strain) or near/after failure (very high strain). This does not provide a clear picture to evaluate the shear mode during deformation. For example, torsion-based material processing begins as simple shear but does not necessarily remain simple at high strain values as shear localizes [Reference Zhilyaev and Langdon45]. Some forms of simple shear processing, such as equal channel angular extrusion (ECAE), remain largely in simple shear through high strain processing [Reference Segal46, Reference Segal47, Reference Valiev and Langdon48].
For the nc-Cu microshear pillars, the observed grain rotation and grain refinement, in addition to the appearance of crack tips at high strains, raise questions as to what state the shear region is in. Framed from the perspective of material processing, the grain changes observed in the high strain shear pillar (Fig. 4) could be attributed to dynamic recrystallization commonly seen during ECAE and rolling [Reference Derby49]. The lack of strong texturing, observed in certain ECAE routes and simple shear extrusion processing, suggests that simple shear is present in a large portion of the remaining shear region [Reference Bagherpour, Qods, Ebrahimi and Miyamoto50]. On the other hand, normal stresses arising from a nonzero bending moment are present in the pillar and may contribute to the cracking observed, deviating from an entirely shear load. The designs produced by Gray et al. and Mayr et al. were shown to deform by simple shear [Reference Gray, Vecchio and Livescu34, Reference Mayr, Eggeler, Webster and Peter36]. Both acknowledged the presence of bending moments in the system with the chosen designs aimed at minimizing the influence of nonshear forces on the specimen deformation. Future work is planned to determine the influence of these nonshear forces on the microshear pillar response.
Beyond these issues, we note that this configuration enables a more direct measurement of film cohesion to substrates compared with methods mentioned previously. Shear specimens fabricated by Mayer et al. were used to evaluate layer deformation and interface strength between layers in an Al–SiC multilayer film. These specimens, however, were restricted to the edges of the sample, severely limiting the volume of material accessible. This design enables the placement of shear specimens at any location of the sample surface with conventional FIB milling techniques. Shear specimens are fabricated by annular milling, while the side cuts are made by tilting the stage to 20° from the ion beam direction. The simple procedure avoids the need for additional microscopy to identify regions of interest and the restriction to place such features near the edge of the sample.
Conclusions
We utilized FIB milling techniques to create a novel shear specimen for mechanical testing on the microscale. Improvements on the traditional “S” shear beam design by implementing notches to define the shear region reduce bending moments that arise with larger specimens. Additionally, the single shear region enables the isolation of boundaries or regions of interest for localized shear property measurements. Shear testing on single-crystal copper oriented along the [111] direction demonstrated shear localization despite the fact that slip planes were not aligned to the loading direction. Shear specimens in nanocrystalline Cu possessed a yield strength three times larger than single-crystal specimens and exhibited grain rotation, slight grain growth, and loss of texture upon loading. Cu film adhesion properties were evaluated by fabricating shear specimens with the interface positioned in the middle of the shear region. Shear specimens at the interface exhibited brittle failure with a yield strength comparable with the nanocrystalline Cu film. Comparison of the shear response in the Si substrate and Cu film with different orientations indicated a response unique to the interface of the film and substrate.
Experimental methods
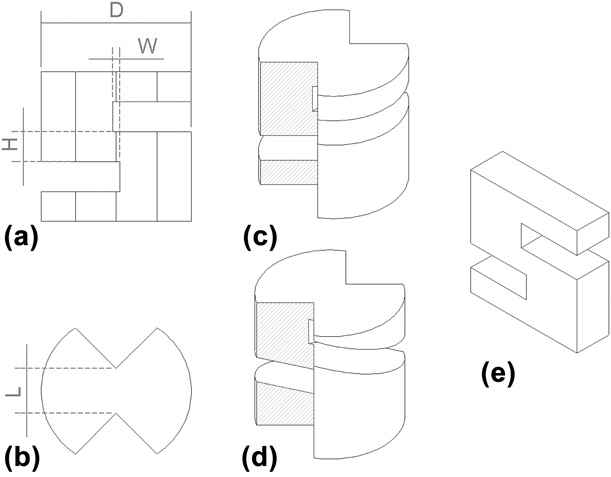
Figure 7 provides a schematic diagram of the microscale shear specimens fabricated in this study. Specimen geometry must be carefully considered to avoid yielding in the supports before yielding or fracture in the shear region. Gray et al. estimated the stress on the shoulder region of cylindrical shear specimens as [Reference Gray, Vecchio and Livescu34],
 $${\sigma _{{\rm{shoulder}}}} = 3.79{{{\sigma _{\rm{y}}}{A_{\rm{s}}}} \over {{D^2}}} + 0.735{{{\sigma _{\rm{y}}}{A_{\rm{s}}}} \over {\left( {{1 \over 2}{D^2} - r_{\rm{c}}^2} \right)}}\quad ,$$
Where σy is the tensile yield stress of the material, A s is the shear area (A s = HL), D is the pillar diameter, and r c is the cutout radius 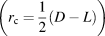 $\left( {{r_{\rm{c}}} = {1 \over 2}\left( {D - L} \right)} \right)$. The design used by Mayer et al. possesses an intrinsic issue because the shear area is coupled to the pillar diameter in this design; the two options for reducing shoulder stress are the reduction of the shear area by narrowing the region (decrease H) or using an anisotropic geometry (i.e., rectangular bar). It should be noted that for the “S” shear beam used by Mayer et al., widening the specimen has the deleterious effect of increasing the bending moment at the support. Without the cutout, this shear structure possesses a narrower range of acceptable specimen geometries, especially for those materials whose shear yield strength is closer in value to the tensile yield strength.
(a) Side and (b) top schematic views of the shear specimens used in the present study. Isometric views for (c) pillars with 90° cuts for single-crystal and nanocrystalline specimens and (d) 70° cuts for interfaces. (e) “S” design from Mayer et al.’s study.

The microscale shear specimen design shown in Fig. 7 introduces notches to define the shear region width [Figs. 7(a) and 7(b)], enabling the production of larger pillars over the traditional shear beam geometry. Furthermore, the single shear region present in this geometry permits the isolation of interfaces or boundaries otherwise difficult, if not, impossible to achieve using a double-shear geometry [Reference Heyer, Brinckmann, Pfetzing-Micklich and Eggeler21, Reference Wierczorek, Laplanche, Heyer, Parsa, Pfetzing-Micklich and Eggeler22].
The shear stress in the gage section can be calculated by
 $$\tau = {F \over {{A_{\rm{s}}}}}\quad ,$$
where F is the load measured by a load cell, and the shear area, A s = HL. The shear strain is calculated using
 $$\gamma = {d \over W}\quad ,$$
where d is the shear displacement, corresponding to the displacement of the tip after touching the specimen surface. The in situ testing showed no significant drift of the bottom portion of the shear specimen during testing. To avoid bending at higher shear strain states, the specimen design requires carefully balancing of the shear region width (W) and area to avoid large bending moments. In this study, we use more conservative values for the dimensions of the shear specimens [Figs. 7(a) and 7(b)]: D = 20 μm, H = 3 μm, L = 4 μm, and W = 1.5 μm. Shear stress–shear strain curves are calculated from the original shear area and width, respectively.
Single-crystal copper samples with the surface oriented along the [111] direction were purchased from MTI Corporation (Richmond, CA). Nanocrystalline copper films were deposited on a Si substrate using a custom-built DC magnetron sputtering system. The deposition was conducted at 2 × 10⁻³ torr with 500 W of power on a 4 inch Cu target. The resulting deposition rate was ∼1 nm/s and continued until the film reached a thickness of ∼24 μm.
Shear specimens were milled using a FEI Helios Nanolab (ThermoFisher Scientific, Hillsboro, OR). Rough milling was performed using an accelerating voltage of 30 kV and a beam current of 21 nA. Fine polishing and milling of the shear region was performed using a lower current of ∼2 nA. Two distinct shear specimen geometries were utilized in this study to measure shear properties in the bulk and at the film–substrate interface. Figure 7(c) provides an isometric view of the shear pillar with cuts oriented at 90° for shear testing in the single-crystal copper and nanocrystalline copper films. In order to produce multiple shear specimens along the film–substrate interface, the specimen was tilted 20° from the ion beam direction, resulting in cuts at 70° with respect to the top surface of the shear specimen [Fig. 7(d)].
Shear specimens were compressed using a PI-85 (Hysitron, Minneapolis, MN) indenter equipped with a 20-μm diamond flat punch and placed inside of a SEM (ThermoFisher Scientific, Hillsboro, OR) operated at 2 kV. Postcompression characterization of the shear specimens was performed using a standard focused ion beam lift-out technique through the shear region. TEM micrographs were taken on a F30 (ThermoFisher Scientific, Hillsboro, OR) operated at 300 kV and equipped with a Gatan OneView camera. Electron backscatter diffraction patterns were collected using a Inspect (ThermoFisher Scientific, Hillsboro, OR) equipped with an EDAX system to verify single-crystal orientation and visualize deformation in compressed single-crystal copper samples.
Acknowledgments
J.G.G, S.M., and N.L. acknowledge the support of the U.S. Department of Energy, Office of Nuclear Energy Fuel Cycle Research and Development Program, and the Los Alamos National Laboratory (LANL)/Laboratory Directed Research & Development (LDRD) Program. This work was performed, in part, at the Center for Integrated Nanotechnologies, an Office of Science User Facility operated for the U.S. Department of Energy (DOE) Office of Science. Los Alamos National Laboratory, an affirmative action equal opportunity employer, is operated by Los Alamos National Security, LLC, for the National Nuclear Security Administration of the U.S. DOE under contract DE-AC52-06NA25396.