Introduction
The Bank of America Chicago Marathon (Chicago, Illinois USA) is one of the world’s largest marathons. Due to the high numbers of participants, spectators, and volunteers, effective data communication is a large concern for event managers and other participating organizations that must absorb large and diverse quantities of information in the short time needed for swift, informed decisions. The event managers sought to develop additional systems to make collected data more readily available to decision makers. This led to the data visualization system described in this report, which compiles various data streams in one dashboard system designed to facilitate rapid data absorption. This report describes the motivation and development of this system and establishes guidelines for similar systems at other mass-gathering events.
The data visualization system is a tool to expand the effectiveness of the Chicago Model (CM). The CM is a holistic approach to mass-gathering event management, developed by the organizers of the Chicago Marathon. It allows organizers to plan and facilitate the marathon with a central focus on maintaining the health and safety of the participants.Reference Hanken, Young, Smilowitz, Chiampas and Waskowski 1 A mass-gathering event is an organized event involving large numbers of participants that puts substantial stress on the surrounding environment.Reference Başdere, Ross, Chan, Mehrotra, Smilowitz and Chiampas 2 , 3 The CM aims to reduce this stress and seamlessly implement events without causing unnecessary strain on public resources. Past incidents, like the race-day cancellation of the 2007 Marathon due to excessive heat, inspired organizers to think critically about current systems. Organizers concluded that a more formal management structure was necessary. The CM is based around three main pillars: Information Systems, Communications, and Organizational Structure.
Information Systems
Information systems ensure that information is shared efficiently and accurately as the event progresses. Data streams from the information systems provide decision makers with the foundation for informed and quick decisions. The data streams allow participating agencies, such as the Chicago Police Department, Chicago Fire Department, Chicago’s Office of Emergency Management and Communications, and Superior Ambulance, to consolidate resources and collaborate in event supervision.Reference Hanken, Young, Smilowitz, Chiampas and Waskowski 1 The Marathon staff has made significant strides in providing accessible and complete information systems. Prior to implementing the visualization system, screens throughout the Forward Command tent, where organizers are stationed on race day, displayed spreadsheets containing key data on aspects of the marathon, from weather day to 5K runner counts. These screens were displayed prominently in positions near key decision makers, allowing them access to the information. However, although data were extensively available, there was limited visualization of this data, making it challenging to absorb in real-time. This restriction was one of the key factors motivating this project.
The data visualization system can serve as the central point of information and ensures that data streams update seamlessly in real-time across linked mobile devices, reducing the risk of costly information delays.
Communications
Clear and efficient communication among involved parties is critical to the CM. There are 15 agencies and over 150 people in Forward Command for the Marathon; clear communication is essential. Involved agencies utilize multiple forms of communication, such as verbal messages, electronic instant messages, radio transmissions, and email. While communication ties closely with the other pillars of the CM, communication fulfills a unique role in reinforcing the collaborative nature of the CM. With multiple agencies involved, it is critical that they remain in constant communication.Reference McCarthy, Chiampas, Malik, Cole, Lindeman and Adams 4 Communication streams can become excessively noisy; it is essential to streamline interactions.
The data visualization system bolsters communications in several ways. First, it reduces noise by providing unique data streams that minimize the use of multiple communication methods. Agencies can focus on the task at hand, rather than searching for the medical group, course operations, or other agencies in the tent. The data visualization system also improves response times in emergencies by providing necessary data for decision making in real-time. Displayed prominently in the data visualization system is a banner that communicates the current alert level of the course. The Event Alert System (EAS) is a color-coded system used throughout the race that enables streamlined communications of the overall condition of the race.Reference Stout, Cannon-Bowers, Salas and Milanovich 5
Organizational Structure
The CM adopts an Incident Command System (ICS) that formalizes the structure for agencies responsible for managing the marathon. The ICS follows from the National Incident Management System (NIMS) designed to organize personnel in responses to incidents, larger-scale disasters, and other unexpected events.Reference Chiampas and Jaworski 6 The NIMS provides a uniform approach for managing incidents that allows for standardized and flexible incident response. The chain of command is designated prior to the event, and an incident commander is appointed to oversee the top-down structure.
The data visualization system supports this structure, providing the ability to synchronize data updates for involved parties, even those remotely accessing the system. Remote users include captains of Aid Stations on the course, along with others who might face issues staying informed due to their location. The visualization system strengthens the core of the organizational structure to bring members agencies together.
Report
System Development Process
Initial Design
The development process began in 2013 at meetings with key Marathon stakeholders to establish a vision for the data visualization system and to determine critical features. Plans were developed to test the data visualization system at the Bank of America Shamrock Shuffle (Chicago, Illinois USA), an 8K race in March, and the Marathon. Deployment at the Shamrock Shuffle benefits the development process through additional testing of new developments at a smaller event.
Key data points were identified that provide a snapshot of the marathon status. Initial data points included: EAS event color status; visualization of the marathon course; runner counts at key locations on the course; general comments on the race status; weather reports; and medical station utilization. These data points were divided into seven components, which together comprise the data visualization system.
-
∙ Observation: Maintain a narrow focus on key data to reduce clutter.
2014 Bank of America Shamrock Shuffle
The system was first tested in a real-time application at the 2014 Shamrock Shuffle. The map display section included a map of the race created by LandAirSea (LandAirSea Systems, Inc.; Woodstock, Illinois USA) that displayed the course and various Global Positioning System (GPS) markers.
Deployment at the 2014 Shamrock Shuffle largely was successful. A survey was distributed to the 150 people in Forward Command, and 42 responses were received. The survey was designed to provide insight on the utility of the data visualization system and its components, and to identify areas for improvement in future races. The average system rating was 6.8 out of eight for effectiveness and the average effectiveness rating was 6.2 out of eight. The map widely was considered to be the most useful component. Thus, the design shifted to focus on the map display and custom functionality that would allow for better portrayal of data utilized by the involved agencies
-
∙ Observation: Geodata is a powerful way to gain situational awareness.
2014 Bank of America Chicago Marathon
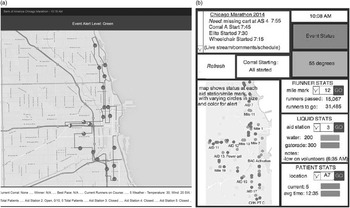
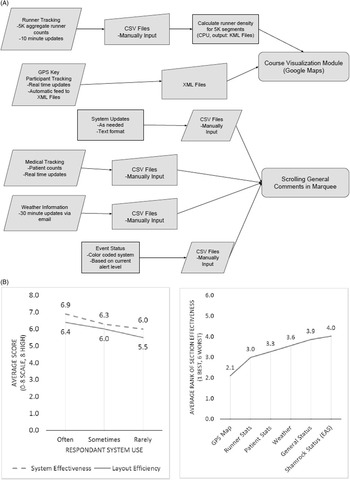
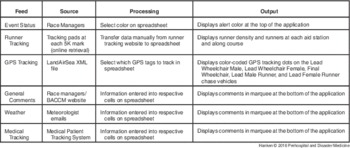
This paradigm shift centered the focus of the data visualization system on the map display with minimal text. The system prototype at the marathon utilized Google Maps (Google; Mountain View, California USA) and simple data visualization methods rather than the text fields from the BASS system. Table 1 shows the six data feeds, indicating the data source, the processing required to enter the information into the system, and the final form of the output. Figure 1 shows the data visualization system used at the 2014 Marathon. The system consisted of various modules, described next, and is presented in Figure 2.
(A&B). Data Visualization System Deployed at the 2014 Chicago Marathon

(A&B). Flow Chart of System Data Sources and Processes Abbreviations: EAS, Event Alert System; GPS, Global Positioning System.

Feeds Used to Populate the Data Visualization System, the Processing Steps, and the Display Format

Abbreviations: BACCM, Bank of America Chicago Marathon; GPS, Global Positioning System.
Event Status
The event status feed is a color-coded bar at the top. The color indicates the alert level for the event, according to EAS. The bar contains space for text messages to convey event updates. This is an important module to include in case of emergency, allowing users to quickly see the escalated alert level and receive necessary messages for effective response.
Course Visualization
The course visualization module consists of a map that consumes most of the display space. The marathon course is represented by latitude and longitude coordinates and is stored in a KML file that displays this information over a Google Map. Segment lengths are normalized and runner density is displayed by segment with colors indicating density. The flexibility of procedurally generated KML using information from CSV files generated by the user through manual input allows for rapid adjustments to the information displayed on the map.
Runner Tracking
The runner tracking feed contains data input from the timing mats located at each 5K mark along the race course, provided by a third party. The timing mats record the number of runners crossing each 5K mark. From this information, runner density is estimated in shorter segments along the course, such as the stretches between aid stations. Since these segments do not correspond to the 5K timing mats, the following equations are used to estimate runner counts, with the following notation for a chosen segment j along the course:
-
- aj : One endpoint of segment j, measured in kilometers from the race start.
-
- R(aj): Runners past endpoint of segment j.
-
- R+(aj): Runner count recorded at 5K marker immediately prior to endpoint aj.
-
- R−(aj): Runner count recorded at 5K marker immediately following endpoint aj.
-
- K+(aj): 5K marker immediately prior to endpoint aj , measured in kilometers from race start.
-
- K−(aj): 5K marker immediately following endpoint aj , measured in kilometers from race start.
 $$\eqalignno{\it R(a_{j} )&={\it R}^{{\plus}} ({\it a_{j} }){\asterisk}\left( {1{\minus}\left( {{{{\it a_{j} }{\minus}{\it K}^{{\plus}} ({\it a_{j} })} \over {\rm 5}}} \right)} \right)\cr&{\plus}{\it R}^{{\minus}} ({\it a_{j} }){\asterisk}\left( {1{\minus}\left( {{{{\it K}^{{\minus}} ({\it a_{j} }){\minus}{\it a_{j}} } \over {\rm 5}}} \right)} \right)$$
Equation (1) calculates the number of runners past segment endpoint aj as a combination of the runner counts at the two 5K markers before and after aj , weighted by the relative distances between aj and these markers.
 $${\rm Runners}\,{\rm in}\,{\rm segment}\,{\it j}={\it R(a_{j} )}{\minus}{\it R(b_{j} )}$$
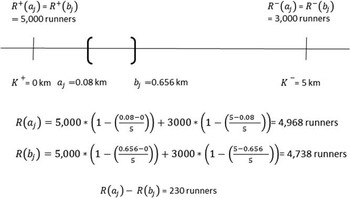
Equation (2) calculates the number of runners in segment j by the number of runners passing the start point of the segment minus the volume of runners who passed the endpoint of the segment. Figure 3 presents an illustration of the calculation of Equations (1) and (2). The density of runners in a segment is obtained by dividing the number of runners in a segment by the length of the segment. Density values are converted to a color code for display as a heat map over the course. The map displays the percent of runners passing each aid station with Equation (1), with the aid station location used for aj .
Sample Runner Tracking Calculation.

Key Participant Tracking
The GPS tracking feed of key participants is displayed as an overlay on the map. This information is obtained from a third party who supplies the GPS tracking system, LandAirSea, in XML format and converted to colored points on the map. The GPS trackers follow the Lead Wheelchair Male, Lead Wheelchair Female, Final Wheelchair, Lead Male Runner, Lead Female Runner, and Last Runner. These individuals are represented with a dot differentiated by color that updates in position as the XML file from LandAirSea is updated.
Medical Tracking
The medical tracking feed consists of information from the Medical Patient Tracking System (MPTS). For each medical location, this module displays the number of current patients, the overall utilization of beds, and the total number of patients seen. This information is displayed on the marquee.
General Comments
The general comments feed is displayed as a marquee below the map. The scrolling marquee facilitates the display of more information in a small space. The marquee display contains the following: summary MPTS information for each aid station; weather information; individual aid station status; and any other necessary general comments, such as the number of runners on the course and finishing times of the winners.
Weather
The weather feed consists of input from the meteorology team sent via emails every 15 minutes. The information includes wet-bulb globe temperature, humidity, and wind speed at four locations on the course. This information is displayed on the marquee.
Backend Systems
For the 2014 Marathon, the data visualization system stored data in Google Spreadsheets and used Google Fusion Tables to generate many of the KML layers for the map display, which allowed for rapid prototyping. However, use of external data sources led to restrictions in the complexity of data that could be displayed and stored to minimize loading time for the website. On race day, the loading times increased due to poor available bandwidth for Internet connection, and the data visualization system periodically paused while attempting to load new data. As a result, some users could not obtain information from the system for approximately one minute. This created a need to move to an internal data storage and layer creation system so that the data could be stored in tandem with the web page. This would limit loading and data retrieval times and minimize the probability of screen pauses.
Currently, the backend system reads and writes text files to the web site base directory, which is then used to display information on the data visualization page. Data are entered through a spreadsheet system page included in the website. Output is written to text files which are pulled to the data visualization system interface every five minutes. Updates are completed within one second, as compared with the update times that exceeded one minute when using Google Spreadsheets.
-
∙ Observation: Fast/seamless data updates to data visualization system are essential
Discussion
Future Applications
Plans are in progress to expand the use of this system to other endurance events. While the courses change for each marathon and data fields may differ, the data visualization system’s main features should prove beneficial for effectively managing other events. This work has identified four key principles for creating a successful data visualization system at similar events:
-
∙ Principle 1: Narrow focus on necessary data;
-
∙ Principle 2: Data must be accessible quickly;
-
∙ Principle 3: Geodata is most useful for rapid data absorption; and
-
∙ Principle 4: Data must be rapidly and seamlessly updated.
These four principles result in an accessible and useful system that can better inform decision makers during mass-gathering events. The system should aim for rapid absorption of critical data needed by decision makers.
Limitations
Several limitations have been identified through the system deployments at race events. In terms of generalizing insights to other events, one key limitation is that this study does not include adjustments for smaller, less resource-intense events. Future work will explore ways to scale the data visualization system for smaller events.
Additionally, several limitations were observed that may apply to all events. The system does not have a field for comments related to either weather or runner tracking, which is critical for unexpected situations. There are also limitations with the runner density calculations, due to segmentation of the course into 5K segments when a more granular segmentation is desired. Revisions to the equations for estimating runner density between 5K segments are in progress through ongoing research.
Further, the ability to archive data throughout the day is another needed feature. Archiving would allow the creation of a database of relevant marathon data and further analysis could be performed to better inform future iterations of the system.
Conclusions
The data visualization system described in this report represents a first attempt to unify various data streams at mass-gathering events. As these events bring together thousands of participants and large numbers of organizing agencies, it is essential that the communication of data is effective and straightforward. The data visualization system works to this end: displaying essential data streams based on an iterative process of stakeholder input.