
I. INTRODUCTION
The NiAl-based alloy is promising to serve in high temperature environment for its high oxidation and corrosion resistance, relatively low density, high melting point, high Young' modulus, the ability to retain strength and stiffness at elevated temperature, etc. Reference Liu1–Reference Koch and Whittenberger4 These excellent elevated temperature properties make NiAl based alloy potential candidate for replacing superalloy. Reference Dey5,Reference Ward-Close, Minor and Doorbar6 The conventional routine for fabricating NiAl-based alloy is ingot casting which leads to a coarse-grained microstructure. Some researchers tried to find alternative ways to produce NiAl-based alloy like rapid solidification Reference Sheng, Zhang, Guo, Wang and Ye7 and directional solidification. Reference Wang, Shen, Zhang and Fu8–Reference Shang, Shen, Wang, Du, Xiong and Fu12 Another promising way is powder metallurgy (PM) such as hot pressing sintering (HPS). However, the NiAl-based alloy prepared via metallurgical routine shows low-temperature brittleness owing to lack of sufficient independent slip systems below the ductile-to-brittle transition temperature (DBTT). Reference Liu and Horton13,Reference Lin Lü, Qing Chen, Qu, Su and Long Zhou14 Lots of researchers have carried out investigation on improving low-temperature ductility of NiAl-based alloy. Eryong Liu used mechanical alloying to produce nanocrystalline NiAl intermetallic to improve mechanical properties. Reference Liu, Jia, Bai, Wang and Gao15 Liyuan Sheng investigated the effect of Au and Ho additions on ductility. Reference Sheng, Zhang, Guo, Yang, Liang and Ye16,Reference Sheng, Wang, Xi, Zheng and Ye17 LinZhi Tang analyzed the relationship of Ti, Nb, Hf, W additions and mechanical behaviors. Reference Tang, Zhang, Li and Gong18 An effective way to improve mechanical properties, especially for room temperature ductility, is plastic deformation which is particularly beneficial to PM since it can eliminate some essential problems such as low relative density. There is a large deformation temperature range of plastic processing, especially for alloys with high melting point. Combined with the consideration that mechanical properties may be sensitive to strain rate, it is of great importance to determine a suitable processing window.
The trial and error experiment was traditionally used to establish the relationship between the processing conditions and mechanical properties. Theoretically, the microstructure can be controlled by deformation parameters, e.g., deformation temperature and strain rate. Hot deformation characteristics related with microstructures can be determined via plastic deformation at different conditions. Nevertheless, the comparison among different parameters reveals only the one superior than other limited number of control groups. It is too difficult to determine precisely the most effective processing window. The processing map, developed on the basis of dynamic materials model (DMM) proposed by Prasad, is more efficient and accurate for optimizing processing parameters to arrive at an effective processing window. Reference Prasad19,Reference Prasad, Gegel, Doraivelu, Malas, Morgan, Lark and Barker20 According to DMM, the plastic flow is dynamic, nonlinear, and irreversible. The deformation of workpieces is regarded as a process of power dissipation which is consisted exclusively by two parts. One is related to structural transformation which improve mechanical properties while the other is unfavorable to properties. Therefore, the effective processing window can be determined by considering only these two parts. Studies of processing map are mainly focused on titanium alloys, magnesium alloys, Ni-based superalloys, and so on. Reference Gangolu, Gourav Rao, Sabirov, Kashyap, Prabhu and Deshmukh21–Reference Jiang, Dong, Zhang, Zheng and Yao26 But there are few reports on deformation behaviors and processing map of NiAl-based alloy.
In the present work, the high temperature deformation behavior of NiAl-based alloy was characterized by isothermal compression tests in the wide range of deformation temperature and strain rate. Based on Arrhenius-type constitutive equation, the dependence of deformation behaviors on strain rate and deformation temperature was discussed. The processing efficiency and instability maps were constructed to optimize processing parameters. In addition, hot forging was performed according to as-established processing maps. High temperature mechanical properties were examined and fracture surfaces were analyzed.
II. MATERIALS AND EXPERIMENTAL PROCEDURES
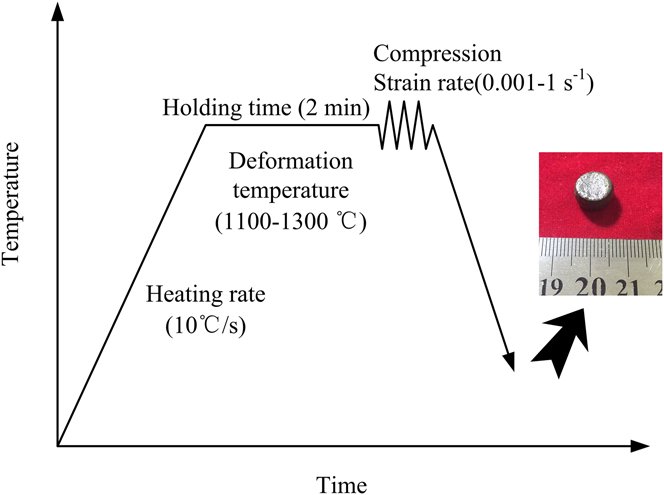
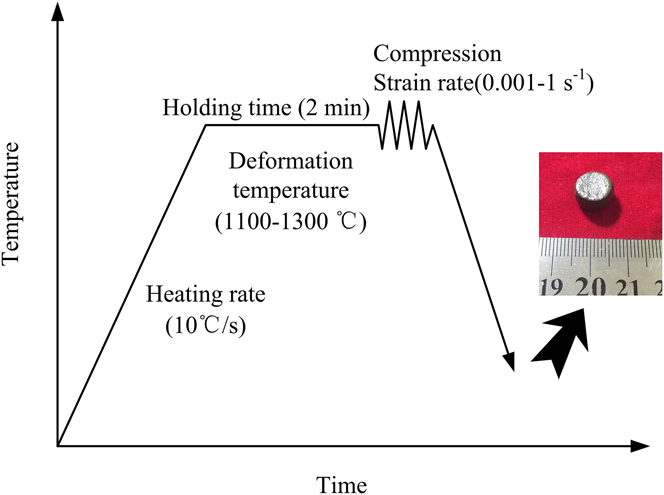
The starting materials were prepared by HPS of green mixture which consisted of Al (15 μm, 99.6%), Ni (10 μm, 99.6%), and Al2O3 (0.2 μm, 99%) powders. The molar proportions of Ni and Al were fixed to 1:1, and 0.05 volume fraction of Al2O3 was added to produce particle reinforced NiAl-based alloy. Figure 1(a) shows the microstructure of the hot-processing sintered products. It consisted of NiAl grains and Al2O3 particles. The selected area electron diffraction (SAED) pattern taken from the white particle in TEM micrograph shows the Al2O3 particle located at grain boundary. Cylindrical compression specimens of 8 mm in diameter and 12 mm in height were sectioned from the starting materials. The hot compression tests were performed on a Gleeble-1500D thermal mechanical simulator in the temperature range of 1100–1300 °C with an interval of 50 °C and strain rate range of 0.001–1 s−1. The temperature of specimen was monitored by a thermocouple spot welded at the center of the specimen surface. All the specimens were heated at a heating rate of 10 °C/s and held for 2 min at the compression temperature to reach a thermal balance. The compression temperature was controlled to ±2 °C and height reduction was 40% (the true strain 0.51). During the compression process, the load-stroke charts were converted to true strain-true stress curves assuming that the specimens were uniformly deformed before failure. The deformed specimens were quenched to ambient temperature by water immediately after compression tests. The heating controlling process is schematically illustrated in Fig. 2. The specimens were cut parallel to the compression axis. Tensile tests were performed on samples with a gauge section of 3 × 2 × 10 mm3 through Instron 5500R tensile equipment (Instron Corporation, Norwood, Massachusetts). The fracture surfaces were observed via Quanta 200 FEG microscope (FEI Company, Hillsboro, Oregon). The foils for TEM were prepared by metallographically ground followed by ion milling. The microstructure observations were performed on the Tecnai G2 F30 microscope (FEI Company) with an acceleration voltage of 300 kV.
Optical micrograph (a) and TEM image (b) of the starting material.

Schematic illustration of the isothermal compression process.
III. RESULTS AND DISCUSSION
A. Hot deformation behavior
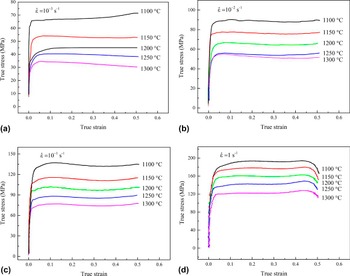
The typical flow stress curves at the different temperature and strain rate are displayed in Fig. 3. When the strain rate is 10−1 s−1, the flow stress curves exhibit the characteristic of dynamic recrystallization (DRX), i.e., the flow stress firstly increases with strain. After the true strain exceeds a critical value, the flow stress begins to drop with increasing strains. The level associated with steady deformation is then obtained. Theoretically, there is a competing process of dynamic softening and work hardening mechanism. At the initial stage of deformation, the winding on the dislocations and increase in dislocation density contribute to increase in flow stress. As the true strain further increases, the dynamic softening mechanisms, such as DRX and dynamic recovery (DRV), override work hardening mechanism, the flow stress starts to decrease. When a dynamic balance of dynamic softening and work hardening is reached, the flow stress stays nearly constant. When the strain rate is 1 s−1, the curves exhibit the characteristics of DRV. There is no perceptible peak flow stress and a recovery-controlled steady state flow can be observed instead. A comparison of curves in Fig. 3 reveals that the flow stress is negatively sensitive to temperature yet positively to strain rate. This is the case because a higher temperature provides more energy for the annihilation and rearrangement of dislocations, as well as the rotation of grains, thereby enhancing the softening mechanism. When specimens are strained at a higher strain rate, dislocations do not have enough time for annihilation and rearrangement. Therefore, the accumulation and multiplication of dislocations give rise to an increase in flow stress. In particular, at a strain rate of 10−1 s−1, the true strain at yield point decreases as the temperature increases, this is presumably attributed to higher mobility of dislocation, vacancies, and boundaries. Interestingly, at a relatively high strain rate (1 s−1), the curves exhibit a remarkable serrations as displayed in Fig. 3(d). It is assumed that dynamic strain aging (DSA) is the main reason responsible for this phenomenon. The DSA phenomenon is also found in some FCC and BCC alloys with substitutional and interstitial atoms. Reference Gangolu, Gourav Rao, Sabirov, Kashyap, Prabhu and Deshmukh21 In addition, the occurrence of DSA is beneficial for flow behavior and even the microstructure of workpieces during hot working. Reference Serajzadeh27
True stress-true strain curves at different strain rate: (a) 10−3 s−1, (b) 10−2 s−1, (c) 10−1 s−1, (d) 1 s−1.

B. Constitutive equation
The true stress-true strain curves present a qualitative characterization of effects of deformation parameters on flow stress. The Arrhenius-type constitutive equation is used to describe quantitatively the effects:
 $$\dot \varepsilon = {A_1}{\sigma ^{{n_1}}}\,\exp \left( { - {Q \over {RT}}} \right)\quad ,$$
 $$\dot \varepsilon = {A_2}\,\exp \left( {\beta \sigma } \right)\,\exp \left( { - {Q \over {RT}}} \right)\quad ,$$
 $$\dot \varepsilon = A{\left[ {{\rm{sinh}}\left( {\alpha \sigma } \right)} \right]^n}\,\exp \left( { - {Q \over {RT}}} \right)\quad ,$$
where
 $\dot \varepsilon$
is the strain rate (s−1), σ is the flow stress (MPa), Q, a value reflecting the difficulty degree of atomic arrangement during hot deformation, is the apparent activation energy (kJ/mol), T is the deformation temperature (K), and R is the gas constant [8.314 J/(mol K)]. A
1, A
2, A
3, α, β, n
1, and n are material constants independent of strain rate and deformation temperature. The relationship of α and β is given by
 $\alpha = \beta /{n_1}$
. Equation (1) is the power law which is applied in a low stress range (ασ < 0.8) and Eq. (2) the exponential law applied in a high stress range (ασ > 1.2). Equation (3) can be applied in a wide range of stress which is called the hyperbolic-sine law. Both sides of Eqs. (1)–(3) are taken in the natural logarithm and given by:
 $$\ln \,\dot \varepsilon = {n_1}\,\ln \,\sigma + \ln \,{A_1} - {Q \mathord{\left/ {\vphantom {Q {\left( {RT} \right)}}} \right. \kern-\nulldelimiterspace} {\left( {RT} \right)}}\quad ,$$
 $$\ln \,\dot \varepsilon = \beta \sigma + \ln \,{A_2} - {Q \mathord{\left/ {\vphantom {Q {\left( {RT} \right)}}} \right. \kern-\nulldelimiterspace} {\left( {RT} \right)}}\quad ,$$
 $$\ln \,\dot \varepsilon = n\,\ln \left[ {\sinh \left( {\alpha \sigma } \right)} \right] + \ln \,A - {Q \mathord{\left/ {\vphantom {Q {\left( {RT} \right)}}} \right. \kern-\nulldelimiterspace} {\left( {RT} \right)}}\quad .$$
The values of n
1 and β can thus be obtained from the slope of
 $\ln \,\sigma - \ln \,\dot \varepsilon$
and
 $\sigma - \ln \,\dot \varepsilon$
curves when the temperature is given. They can be expressed as:
 $${n_1} = {\left( {{{\partial \ln \,\dot \varepsilon } \over {\partial \ln \,\sigma }}} \right)_T}\quad .$$
 $$\beta = {\left( {{{\partial \ln \,\dot \varepsilon } \over {\partial \sigma }}} \right)_T}\quad .$$
The peak flow stresses σp at the different strain rate and temperature are extracted and plotted as the function of strain rate. The values of material constants n
1 and β are obtained by using linear regression analysis based on the slope of
 $\ln \,{{\rm{\sigma }}_{\rm{p}}}\;{\rm{versus}}\;\ln \,\dot \varepsilon$
and
 ${{\rm{\sigma }}_{\rm{p}}}\;{\rm{versus}}\;\ln \,\dot \varepsilon$
lines (Fig. 4). α is calculated by
 ${\rm{\alpha }} = {\rm{\beta }}/{n_1}$
. It should be noticed that n
1 = 6.51 is higher than that of pure metals (n
1 = 3 − 5), indicating that high temperature compression deformation is ascribed to the operation of dislocation mechanism.
Reference Tang, Zhang, Li and Gong18
The linear relationships of (a)
 $\ln \,{\sigma _{\rm{p}}}$
versus
 $\ln \,\dot \varepsilon$
and (b)
 ${{\rm{\sigma }}_{\rm{p}}}$
versus
 $\ln {{\dot \varepsilon }}$
.

Once the value of α is obtained, n and Q are determined by the equations given by:
 $$n = {\left[ {{{\partial \ln \,\dot \varepsilon } \over {\partial \ln \left( {\sinh \left( {\alpha \sigma } \right)} \right)}}} \right]_T}\quad .$$
 $$Q = R \cdot n{\left[ {{{\partial \ln \left( {\sinh \left( {\alpha \sigma } \right)} \right)} \over {\partial \left( {1/T} \right)}}} \right]_T}\quad .$$
 $\ln \left( {\sinh \left( {\alpha {\sigma _{\rm{p}}}} \right)} \right)$
is plotted as the function of
 $\ln \,\dot \varepsilon$
and 1/T, respectively (Fig. 5). The value of Q is calculated to be 326.31 kJ/mol. The activation energy for hot deformation is lower than that of NiAl–9Mo–Hf, suggesting that the difficulty degree of thermally activated deformation of Al2O3 particle reinforced NiAl-based alloy is lower than NiAl alloy with Mo and Hf addition.
Reference Chen, Guo and Zhou28
Using the hyperbolic-sine law, the constitutive equation of the alloy associated with peak stress is expressed as:
 $$\dot \varepsilon = 1.53 \times 1{0^{10}}{\left[ {\sinh \left( {9.63 \times {{10}^{ - 3}}\sigma } \right)} \right]^{5.09}}\,\exp \left( { - {{326310} \over {8.314T}}} \right).$$
The linear relationship of (a)
 $\ln \,\left( {{\rm{sinh}}\left( {\alpha \sigma } \right)} \right)$
versus
 $\ln \,\dot \varepsilon$
and (b)
 $\ln \,\left( {{\rm{sinh}}\left( {\alpha \sigma } \right)} \right)$
versus 1/T.

Zener–Hollomon parameter (temperature compensated strain rate) is used to verify the validity of as-established constitutive equation and given by:
 $$Z = \dot \varepsilon \,\exp \left( {{Q \over {RT}}} \right) = A{\left[ {\sinh \left( {\alpha \sigma } \right)} \right]^n}\quad .$$
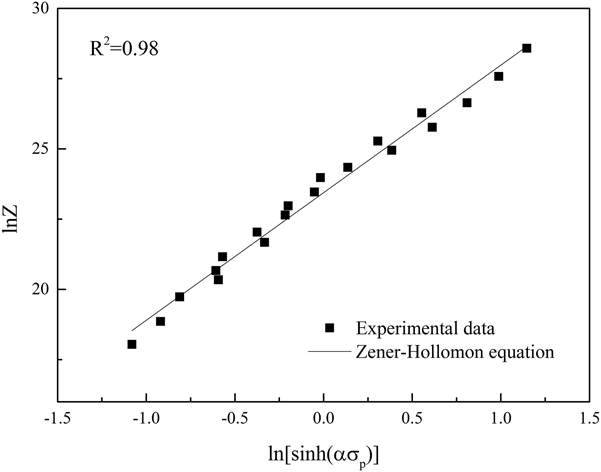
Similarly, the peak stress in the flow stress curves is extracted. The relationship between the Zener–Hollomon parameter and peak stress is summarized, and the linear fitting curve is shown in Fig. 6. The curve suggests that the true stress is sensitive to strain rate and temperature. The value of Z increases with peak stress. In addition, the correlation coefficient R 2 is 0.98, proving the high accuracy of Eq. (11) for characterizing the hot deformation behavior of the studied alloy.
The linear relationship between the peak stress and the Zener–Hollomon parameters.

C. Processing efficiency and instability maps
The constitutive equation reveals that the effect of deformation temperature and strain rate on flow stress are vital factors in plastic deformation. It is of great significance to establish an effective processing window. Processing maps, developed from DMM, provide the basis of optimizing technique parameters. In DMM, the power input in the workpieces is dissipated predominantly through two parts: consumption in plastic deformation and structural transformation. Reference Prasad and Seshacharyulu29 The former produces visoplastic heat while the latter is related to internal energy variation. Therefore, the energy absorbed by workpieces can be determined by:
 $$P = \sigma \dot \varepsilon = G + J = \int_0^{\dot \varepsilon } {\sigma {\rm{d}}\dot \varepsilon } + \int_0^\sigma {\dot \varepsilon {\rm{d}}\sigma } \quad .$$
Where G is the energy consumed in plastic deformation and J is that in structural transformation. The power partitioning is determined by strain rate sensitivity of flow stress as follows:
 $$m = {\left. {{{\partial \lg \sigma } \over {\partial \lg \dot \varepsilon }}} \right|_{\varepsilon ,T}} = {\left. {{{\partial J} \over {\partial G}}} \right|_{\varepsilon ,T}}\quad .$$
Where m is the strain rate sensitivity exponent. In DMM, the relationship between
 $\lg \,\sigma$
and
 $\lg \,\dot \varepsilon$
is assumed to be linear. When m < 0, defects in microstructure will be observed. When m is large enough, superplasticity can be achieved. The parameter η describing the efficiency of power dissipation is given by:
 $$\eta = {{\Delta J/\Delta P} \over {{{(\Delta J/\Delta P)}_{{\rm{line}}}}}} = {{m/(m + 1)} \over {1/2}} = {{2m} \over {m + 1}}\quad .$$
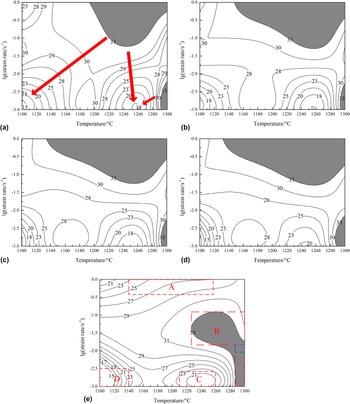
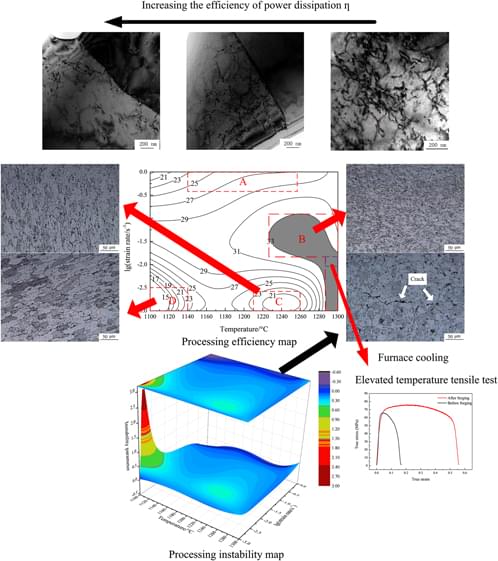
The value of η denotes the ratio of nonlinear dissipation to linear one. Generally, a larger value of η suggests that the proportion of energy consumed in structural transformation is higher, which indicates that the proportion of DRX grains is higher and accordingly workability is desirable. The processing efficiency maps developed at the strains of 0.1, 0.2, 0.3, 0.4, and 0.5 are presented in Fig. 7, respectively. The isoefficiency contours and shaded domain represent the efficiency of power dissipation and the high efficiency domains (η > 0.33), respectively. It is of importance to point out that the processing efficiency maps are roughly same except at a strain of 0.5, indicating that the strain has no remarkable effect on processing efficiency. The hot work of studied materials in a range of low to intermediate strain is believed to be transient and belong to the steady-state type that is attributed to the increasing deformation energy and the microstructure evolution during hot deformation procedure. Reference Sun, Wan, Hu and Ren30 In the Fig. 7(a), the processing efficiency is higher than that in other domains when the temperature is in the range of 1190 to 1280 °C, the logarithm of strain rate is in the range of −1.25 to 0 or when the temperature is in the range of 1290 to 1300 °C, the logarithm of strain rate is in the range of −3 to −2.25. Along the direction of arrows, there are two low processing efficiency domains, i.e., the temperature is in the range of 1100 to 1120 °C, the logarithm of strain rate is in the range of −3 to −2.5, or when the temperature is in the range of 1240 to 1270 °C, the logarithm of strain rate is in the range of −3 to −2.5. In these two domains, η is less than 20%. When the strain increases, the high efficiency domains extend to lower temperature. In other words, they become larger with increasing strains. It is presumably attributed to higher stored energy for occurrence of DRX when increasing the strain. In general, at a lower temperature, the processing efficiency is relatively low because energy for process of DRX is not sufficient. Interestingly, there are two peak processing efficiency domains at a low to intermediate strain yet one peak processing efficiency domain at a relatively high strain. Theoretically, it might be attributed to accumulative deformation amount that results in sensitivity of deformation to high strain rate.
Processing efficiency maps at the different strains: (a) 0.1 (b) 0.2 (c) 0.3 (d) 0.4 (e) 0.5.

To characterize the deformation characteristics of the studied alloys, the processing efficiency map at a relatively large strain is discussed in detail. It is divided into four major domains denoted as A–D [Fig. 7(d)] according to the values of power dissipation efficiency. In the domain A where the logarithm of strain rate is in the range of −0.5 to 0 and temperature is in a large range from 1140 to 1260 °C, the processing efficiency is moderate. The high efficiency domain B is in the temperature range of 1228 to 1300 °C and logarithm of strain rate of −1.8 to −1.1 or the temperature range of 1285 to 1300 °C and logarithm of stain rate of −3 to −1.8. In the domain C where efficiency of power dissipation is moderate, the temperature is intermediate to high and strain rate is low. The bottom of power dissipation efficiency appears at domain D where both the temperature and strain rate are rather low.
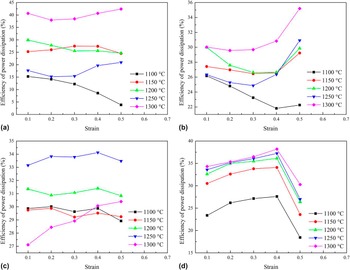
When the true strain reaches 0.5, processing efficiency maps show different features. Therefore, it is necessary to take consideration into relationship between true strain and dissipation efficiency. Their relationship is displayed in Fig. 8. At a strain rate of 10−3 s−1, the efficiency of power dissipation does not vary significantly at each deformation temperature with an exception at 1100 °C [Fig. 8(a)]. When plastic deformation takes place at a low strain rate, the efficiency of power dissipation is not sensitive to strain. Similar trend regarded as nearly stable stage is found in Fig. 8(b). However, there is a sharp increase when the strain varies from 0.4 to 0.5. When the strain rate is 10−1 s−1, there also appears a nearly stable stage with an exception at 1300 °C as displayed in Fig. 8(c). It is interesting to note that the value of η is relatively low compared with that at other strain rates. Even though it is commonly held that the ductility of materials at a high temperature is better and the deformation resistance is lower, the strain rate also has remarkable effect on workability. In Fig. 8(d), there is an abnormal trend when the strain increases from 0.4 to 0.5. It is presumably because when deformation amount is large enough combined with consideration of a high strain rate, work hardening effect is very strong and impedes the occurrence of DRX. In general, efficiency of power dissipation increases with deformation temperature because energy for DRX is more sufficient. So a relatively high temperature is suitable for industrial manufacturing.
Effects of strain on the efficiency of power dissipation at different temperature and strain rate: (a) 10−3 s−1 (b) 10−2 s−1 (c) 10−1 s−1 (d) 1 s−1.

Since a high efficiency of power dissipation does not necessarily come with a favorable workability and instability mechanisms (e.g., the flow localization, adiabatic shear band, wedge cracking) probably contributes to a high efficiency of power dissipation. Therefore, the instability during plastic deformation must be taken into consideration. Prasad instability criterion has been extensively used in determining the unfavorable processing conditions. Reference Zhang, Hu, Ding, Zhu and Qin31 To be specific, the principle of maximum rate of entropy production in the metallurgical systems gives rise to instability proposed by Prasad and is given by:
 $$\xi = {{\partial \lg \left( {m/\left( {m + 1} \right)} \right)} \over {\partial \lg \,\dot \varepsilon }} + m \,\,\lt\,\, 0\quad .$$
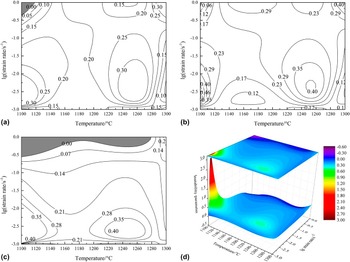
The variation of values of instability parameter is plotted against temperature and logarithm of strain rate as displayed in Fig. 9. At the strain of 0.1 [Fig. 9(a)], the instability domain is located at upper-left corner where the strain rate is high and temperature is low. When the alloy is strained to a higher strain value (the true strain 0.3), there is negligible instability domain, suggesting that the studied alloys can be hot worked without flow instability occurring. The phenomenon that there is nearly no flow instability at a low strain is also found in titanium alloy. Reference Zhao, Xiao, Ge, Sun and Xi25 As the strain increases to 0.5, the stability domain in Fig. 9(c) becomes large and will be discussed in detail. The value of instability parameter generally decreases with increasing strain rate. In other words, flow instability is more likely to occur at a high strain rate. The instability domain is delineated using black line as shown in Fig. 9(d). In the logarithm strain rate of −0.35 to 0, flow instability could occur even at the intermediate to high temperature. Although exposure to high temperature, and time is not enough for process of DRX. Work hardening effect is rather strong and accordingly the flow instability is likely to occur.
Processing instability map at the strain of (a) 0.1 (b) 0.3 (c) 0.5 and three dimensional processing instability map at the strain of 0.5 (d).

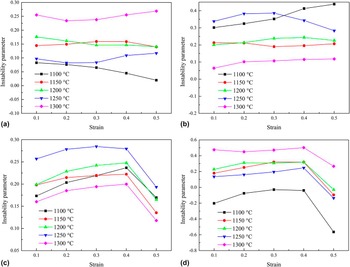
Similarly, the processing instability maps are affected by strain, so the relationship between instability parameter and true strain is also taken into consideration as shown in Fig. 10. Unlike the efficiency of power dissipation, there is no significant variation as the strain increases when the strain rate is less than 10−1 s−1. In other words, as soon as the strain rate is rather low, strain is unlikely to become predominant factors resulting in flow instability. Particularly, at a strain rate of 10−3 s−1 [Fig. 10(a)], the value of instability parameter decreases monotonously with increasing strain. This trend indicates that instability is more likely to occur as the strain accumulates in the condition that deformation resistance is large. Similar trends can be traced in Figs. 10(c), (d) and 8(d) when the strain varies from 0.4 to 0.5. So when the strain rate is large, the effect of strain on plastic deformation becomes significant. When the deformation temperature is low and strain rate is high [Fig. 10(d)], the value of instability parameter is below zero, suggesting instability mechanisms operate. Therefore, low temperature and high strain rate are not beneficial for plastic processing. The result is consistent with that of power dissipation efficiency analysis.
Effects of strain on the instability parameter at different temperature and strain rate: (a) 10−3 s−1 (b) 10−2 s−1 (c) 10−1 s−1 (d) 1 s−1.

D. Microstructure evolution
The domains with various processing efficiency are believe to be closely related to microstructures. Thus, four domains in Fig. 7 were characterized through microstructure observation. In the domain A and C where the processing efficiency is low, the grains show features of anisotropy [Figs. 11(a) and 11(b)]. The initial equiaxed grains are elongated during compression. When deformation is performed in domain B where processing efficiency is high, there is no perceptible anisotropy in the microstructure as displayed in Figs. 11(c) and 11(d). Corrugation of grain boundaries can be found with ease. This phenomenon reveals that DRX takes place during hot deformation and originally strain hardened microstructures are partially or totally eliminated by newly formed equiaxed grains. To be specific, when the deformation is 1300 °C and strain rate is 10−2 s−1, grain refinement is obvious. So it can be safely said that the process of DRX is sufficient, i.e., nucleus grows and totally replaces initial grains. At this deformation condition, the proportion of energy consumed in structural transformation is high. The instability map with a strain of 0.5 reveals that deformation at 1150 °C/1 s−1 and 1250 °C/1 s−1, corresponding to domain A in the processing efficiency map, comes up with operation of instability mechanism. Cracks are discovered in these two conditions Figs. 11(e) and 11(f). It is concluded, as above, that the microstructure evolution is in good agreement with processing efficiency maps combined with instability maps.
Microstructure of specimens deformed at (a) 1100 °C/10−3 s−1 (b) 1250 °C/10−3 s−1 (c) 1250 °C/10−1 s−1 (d) 1300 °C/10−2 s−1 (e) 1150 °C/1 s−1 (f) 1250 °C/1 s−1, with a strain of 0.5.

Since processing efficiency is closely associated with DRX that results in annihilation of dislocations, dislocation density might be related to processing efficiency. Therefore, the dislocation distribution of deformed specimens was observed as shown in Fig. 12. Obviously, the dislocation density increases when deformation conditions vary from high to low efficiency. Particularly, dislocations are evenly distributed in the grains as shown in Fig. 12(a). As the processing efficiency further decreases, dislocations start to accumulate at grain boundaries and dislocation density is relatively high [Fig. 12(b)]. The dislocation pile-up even appears in Fig. 12(c).
Dislocation distribution of specimens deformed at (a) 1300 °C/10−2 s−1 (domain B) (b) 1250 °C/10−3 s−1 (domain C) (c) 1100 °C/10−3 s−1 (domain D), with a strain of 0.5.

E. Effective processing window
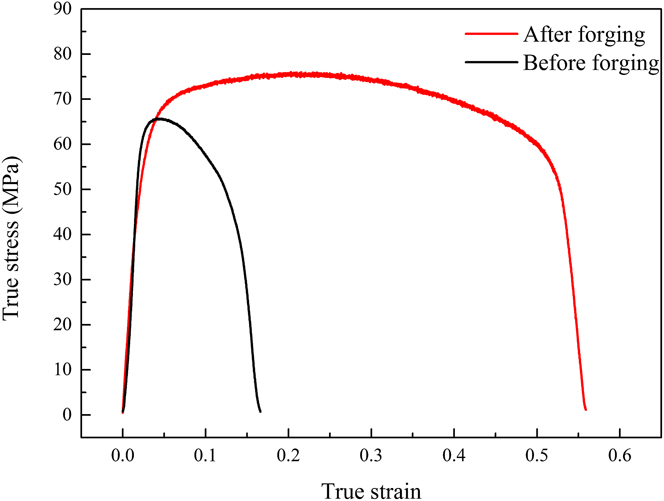
When the true strain is 0.5, the processing efficiency is high in domain B. Therefore, the studied alloys are selected to be strained to a relatively large value in the condition of domain B. The hot forging was performed at the temperature of 1295 ± 5 °C and strain rate range of 0.01–0.017 s−1 [corresponding to the region delineated by blue line in Fig. 7(e)]. The disks of the NiAl-based alloy were strained in vacuum HPS furnace to the height reduction of 0.4, responding to the true strain of 0.51. The disks were then cooled in the furnace. Tensile specimens were sectioned from deformed materials and the surfaces of gauge section were ground. Tensile tests were performed at 1000 °C and strain rate of 10−3 s−1. The results of tensile tests are displayed in Fig. 13. After hot forging, the elevated temperature ductility of specimens was improved appreciably, increasing from 17.86% to 74.87%. Interestingly, the strength does not increase as much as the elongation does. It is presumably because that deformation at an effective processing window attributes to the fully occurrence of DRX which will decrease dislocation density, as well as refine grains. While plastic deformation attributes to accumulation and multiplication of dislocation, i.e., it could enhance work hardening effect, the work hardening effect is neutralized and even overridden by DRX. Hence, the increase in strength is not remarkable. Figure 14 shows the facture morphology of specimens stained at the elevated temperature. Ductile fracture with extensive necking and dimples can be found in Fig 14(b). On the other hand, the fracture surface of the specimens before forging lacks dimples and voids. After hot forging, the fracture surface shows obvious characteristics of stripping, suggesting that the cracks are difficult to propagate and ductility is improved. The result is consistent with the mechanical tests.
The true stress-true strain curves of high temperature tensile tests at the temperature of 1000 °C and strain rate of 10−3 s−1.

Fracture surfaces of tensile specimens (a) before forging; (b) after forging.

IV. CONCLUSIONS
The deformation behavior and microstructure of PM NiAl-based alloy were analyzed in the temperature range of 1100–1300 °C and strain rate range of 0.001–1 s−1. According to effective processing window predicted by processing maps, hot forging was performed on hot-pressing sintered billets. Conclusions have been drawn from this study:
-
(1) There is a competing mechanism in the isothermal compression tests, namely dynamic softening and work hardening mechanism. The predominant softening mechanism varies at different strain rate. When strain rate is 1 s−1 and 0.1 s−1, the flow stress curves show characteristic of DRV and DRX, respectively. The value of activation energy for deformation is obtained by hyperbolic sine-type constitutive equation and equals to 326.31 kJ/mol.
-
(2) According to processing efficiency maps, effective processing window with a strain of 0.5 lies in the temperature range of 1228–1300 °C and strain rate range of 0.016–0.079 s−1 or temperature range of 1285–1300 °C and strain rate range of 0.001–0.079 s−1. The instability maps reveal that operation of instability mechanism will occur in the temperature range of 1100–1270 °C and strain rate range of 0.45–1 s−1.
-
(3) The efficiency of power dissipation and instability parameters are sensitive to strain, strain rate, deformation temperature to some degree. When the strain rate is high enough, effects of strain on both power dissipation and instability parameters become obvious. But when the strain rate is low, effects of strain are not obvious.
-
(4) The microstructure evolution indicates that grain refinement takes place sufficiently in high efficiency domains. Anisotropic grains stemmed from deformed original microstructure appear in low efficiency domain. In instability domain, cracks are discovered. In addition, as processing efficiency decreases, dislocation density increases. In particular, dislocation pile-up is developed in the considerably low efficiency domain.
-
(5) As the effective processing window on the basis of processing efficiency maps and instability maps indicates, hot forging was performed and the result shows that elevated temperature elongation increases from 17.86% to 74.87%. Fracture surfaces of deformed materials show stripping features.
ACKNOWLEDGMENTS
The authors gratefully acknowledge the financial support from the National Natural Science Foundation of China (Grant No. 51675126 [former Grant No. 51205081]) and the Natural Science Foundation of Heilongjiang Province (Grant No. DC 2013C048).