Introduction
Captive populations are often small and consequently inbreeding rates can be high with associated reductions in fitness (Meuwissen and Woolliams, Reference Meuwissen and Woolliams1994; Boakes et al., Reference Boakes, Wang and Amos2007; Oldenbroek, Reference Oldenbroek2007). These populations, whether agricultural breeds or zoo populations, are generally kept in separate breeding units such as zoos and farms. Exchange of animals between breeding units is often limited. Within each (small) unit, the risk of high inbreeding rates and associated loss of diversity is even higher. On the other hand, genetic diversity of the whole breed or population may be maintained, because a different, albeit small, part of total diversity tends to remain within each subpopulation. Consequently, inbreeding may be reduced by using individuals of a different subpopulation as a parent. A rotational mating scheme organises exchange of individuals in a structured way so that diversity at the population level is maintained and inbreeding within subpopulations is reduced.
Rotational mating schemes have been in use in agriculture for a long time (e.g. Chevalet and De Rochambeau, Reference Chevalet and De Rochambeau1985; Alderson, Reference Alderson1990; Honda et al., Reference Honda, Nomura and Mukai2004). Several varieties exist, but in general males that are used as sires are provided by another subpopulation than dams. A great advantage is that detailed pedigree records are not needed to restrict inbreeding with rotational mating schemes. Despite their usefulness, literature on rotational mating schemes is scarce. Consequently, little is known about their effectiveness, e.g. in relation to other methods that restrict inbreeding. Cyclical mating systems, as opposed to rotational mating schemes, have been developed for use within populations to restrict inbreeding. Typically, each individual is replaced by one of its offspring only, and mated to an individual from a different family (e.g. Wright, Reference Wright1921; Farid et al., Reference Farid, Makarechian and Strobeck1987; Sanchez et al., Reference Sanchez, Bijma and Woolliams2003). The rotational mating schemes discussed here function at the (sub)population level rather than at the individual level. Here females of one population are mated to males from another population.
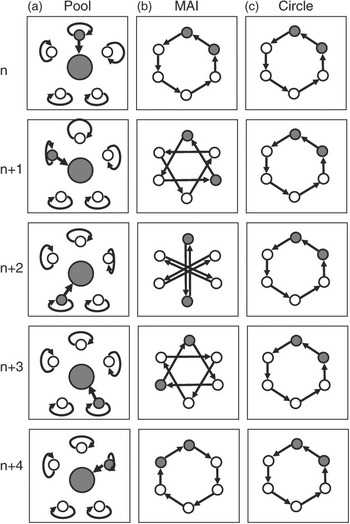
Several of these rotational mating schemes have been in use to restrict inbreeding. Best described is a scheme (Figure 1a) where a pool of females is mated sequentially to a different inbred sire line (Honda et al., Reference Honda, Nomura and Mukai2004). Genetic diversity is maintained and inbreeding is restricted in the pool because once a sire line has provided males it is reused only after all other sire lines have been used. By that time the contribution of the original sire line to the pool has dwindled and hence inbreeding will be low. A second scheme is maximum avoidance of inbreeding (MAI; Figure 1b). Here inbreeding is postponed as long as possible by mating females of a subpopulation each year to males of a different subpopulation. Inbreeding occurs only after all subpopulations have provided males once, and one is forced to reuse a previous supplier subpopulation of males. Finally, a so-called ram circle or breeding circle can be used to restrict inbreeding (Figure 1c). In sheep, breeding these have been in use over a long time. In a breeding circle, the first flock provides sires for the second flock, the second flock for the third flock, and so on, and the last flock provides sires for the first flock. Flocks never use sires born in their own flock and always use sires from the same donor flock. Inbreeding is restricted because although sires from the same flock are used each year, their mothers stem from another flock. Although used in practice, breeding circles are, apart from research by De Rochambeau and Chevalet (Reference De Rochambeau and Chevalet1985), absent from the conservation genetics literature.
Rotational mating schemes involving six subpopulations. Circles represent flocks or subpopulations. Arrows point from donor flock of males to recipient flock. (a) Central large pool with inbreeding sire lines, (b) maximum avoidance of inbreeding (MAI) scheme and (c) breeding circle. Each row represents one breeding season, after a cycle of five breeding seasons the top row scheme is used again (n is number of five breeding season cycles since start of the scheme). One donor recipient combination is highlighted in grey showing that in (a) there is one recipient flock, with changing, in (b) for a particular flock the donor changes and for (c) donor–recipient combinations are constant.

Other methods to restrict inbreeding that need pedigree records are, for example, minimum coancestry and related schemes (Caballero et al., Reference Caballero, Santiago and Toro1996) and optimal contribution schemes (Meuwissen, Reference Meuwissen1997). In these methods, selection of parents is based on relationships. In the case of optimal contribution schemes, animals selected as parents and their contributions to the next generation can be calculated so that the average inbreeding in their offspring under random mating is minimal. Theoretically, this is the most efficient way to restrict inbreeding rates in the long run.
The aim of this paper is to compare two rotational mating schemes: maximum inbreeding avoidance and a breeding circle. The main question is how effective these methods are compared to each other in a practical situation. To this end, we used computer simulations using data from the rare sheep breed, the Kempisch Heideschaap, and compared the rotational mating schemes to no inbreeding restriction.
The Kempisch Heideschaap is a rare sheep breed that is kept in a small number of flocks with limited exchange of animals between the different flocks. For sheep in The Netherlands, a selection programme for scrapie resistance is obligatory (Vellema, Reference Vellema2002; Windig et al., Reference Windig, Eding, Moll and Kaal2004 and Reference Windig, Meuleman and Kaal2007). Under this programme, only rams homozygous for the ARR allele may be used, limiting the number of potential parents. Consequently, this selection programme reduces the effective population size further and inbreeding restriction is even more necessary in order to avoid unacceptably high inbreeding rates.
Material and methods
Kempisch Heideschaap
The Kempisch Heideschaap was a multi-purpose breed that produced wool, meat and manure and was herded on relatively poor soils in the south-eastern part of The Netherlands and adjacent parts of Belgium. At the start of the 1900s, the Texel sheep with superior growth characteristics and the reduction of marginal grazing (heath) land following the introduction of artificial fertilisers caused a severe decline in numbers of Kempisch Heideschaap. In the 1960s, when the breed was all but extinct, conservation efforts started and a flock was recreated from the remaining scattered animals. The recovery continued in the 1970s and the breed is now mainly used for grazing nature conservancy areas. Currently, there are about 2400 animals in the official registry of the breed association (‘flock book’) in six large flocks (>200 animals) and two smaller flocks (about 50 animals). Each year most females are mated, but only about 400 offspring are used to replace older animals, with similar replacement rates across flocks.
Breeding
There is no coordinated breeding programme for the Kempisch Heideschaap. Breeding is mainly based on the policy of the shepherd who selects rams for siring next year’s offspring. Generally, young rams up to 2 years are used for breeding. Exchange between flocks is limited to a few animals per year, mostly rams. Mating generally takes place by releasing rams in a flock and reliable pedigree records are consequently not available. In recent years, there has been strong selection for scrapie resistance. Scrapie is a neurodegenerative disease caused by misfolding of the prion protein. Polymorphism in the prion protein encoding genes determines resistance. The main variants are ARR, AHQ, ARQ and VRQ haplotypes. Homozygous ARR animals are fully resistant for classical scrapie. A European-wide eradication programme based on this polymorphism is now in operation. In The Netherlands, only ARR/ARR rams can be used in breeding and consequently strong selection for ARR animals takes place. In the Kempisch Heideschaap, the frequency of the ARR allele at the start of the research (2004) was 40.7% and in the cohort of animals born that year was 59.1%.
Evaluation of breeding programmes
To evaluate the effectiveness of breeding circles in inbreeding reduction and conservation of genetic diversity relative to other breeding programmes, computer simulations were run. Two extreme possibilities of exchange were evaluated as benchmarks. At one extreme was full exchange of animals and complete mixing of flocks, i.e. rams had equal probabilities of mating with ewes regardless of the flock origin. This mimics the situation where the whole breed acts as one big population. At the other extreme there was no exchange between flocks and each flock exclusively using rams born in its own flock; in other words, here the whole breed is split into eight separate populations. In the real situation, exchange between flocks is limited, but not absent. This was approximated by running a computer simulation with rams having 5% probability of being used outside its flock of birth.
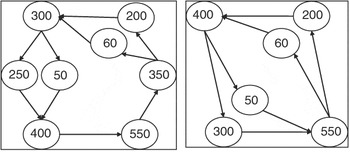
The three previous options were compared with two rotational mating schemes: maximal inbreeding avoidance (Figure 1b) and a breeding circle (Figure 1c). The breeding circle and maximum inbreeding avoidance schemes were slightly modified for the Kempisch Heideschaap because small flocks cannot provide enough rams for large flocks. To accommodate for this in the simulations, the two smallest flocks were paired to middle-sized flocks, and they together received and provided rams for large-sized flocks (Figure 2).
Breeding circles used for restriction of inbreeding rates evaluated in this study. Each ellipse represents one flock, arrows indicate use of rams, pointing from donor flock to receiving flock. No rams of own flocks are used. Left: breeding circle with all eight existing flocks, right: breeding circle with the six participating flocks.

Simulations were similar to Windig et al. (Reference Windig, Eding, Moll and Kaal2004) where the effect of selection for scrapie resistance was simulated for different sheep breeds. For the current study, flock structure was added to be able to evaluate rotational mating and inbreeding rates in individual flocks. For each simulation a population was set up in the computer, resembling the real population of the Kempisch Heideschaap as much as possible. Each animal received the age, sex and flock membership of a real animal. Total population size was 2160 animals divided over eight flocks (numbers per flock in Figure 2). Sex ratio was 1 ram to 5 ewes. Animals that were not typed for the scrapie genotype (these were all ewes) received at random a genotype with probabilities determined by the frequency of typed animals. In subsequent generations all animals were assumed to be typed for the scrapie allele.
Subsequent generations were simulated assuming that sex ratio, flock sizes, age structure and replacement rates remained constant at the level of 2005 under all scenarios evaluated. This meant that each year 40% of the ewes were replaced by newborn lambs v. 68% of the rams. Ewes to produce litters for the next generation were selected at random. Each year the number of ewes selected was the same as the number of litters in the breeding season 2003/2004. Litter size was one or two, the probability of the litter size was determined by the frequencies in 2003/2004. Ewes stayed their whole life in the same flock where born, as this is generally the case in the real population. ARR/ARR rams were exclusively selected according to the scrapie elimination programme. Flocks used either rams born in their own herd or from the flock specified by the breeding circle. In the scenario without exchange between flocks, in about 5% of the simulations ARR/ARR rams were unavailable in the own flock, for the smallest herds. In that case, an ARR/ARR ram from another flock was used. Relationship coefficients between individuals and their inbreeding coefficients were set to 0 in the base generation.
All scenarios were simulated by 25 simulations for 50 generations. Twenty-five simulations were used to gain information on variability of results and reduce bias in the mean. Evaluations with more than 25 runs showed that the means hardly changed above 20 simulations (Windig et al., Reference Windig, Eding, Moll and Kaal2004). The effect on genetic diversity was evaluated by inbreeding rates and long-term contributions of founder rams. The average inbreeding level is related to genetic diversity, but is less suitable as a measure of diversity than inbreeding rates (Falconer and Mackay, Reference Falconer and Mackay1996; Holt et al., Reference Holt, Meuwissen and Vangen2005). This is because it is dependent on where the arbitrary base generation is chosen, and because it does not distinguish between inbreeding due to recent or (very) old ancestors. Although inbreeding rates capture most aspects of changes in diversity, differential use of founders can be different for populations with equal inbreeding rates, especially if populations are structured into subpopulations such as flocks (Chevalet and De Rochambeau, Reference Chevalet and De Rochambeau1985; Alderson, Reference Alderson1990; Honda et al., Reference Honda, Nomura and Mukai2004). Therefore, genetic contributions (Woolliams et al., Reference Woolliams, Bijma and Villanueva1999; Woolliams and Bijma, Reference Woolliams and Bijma2000; Woolliams, Reference Woolliams2007) of founder rams were also monitored. A genetic contribution of an individual is defined as the proportion of genes present in a population at a specific point in time that is derived from that individual. The total contribution of founder rams is always 50%, with the other half coming from the founder ewes.
DNA typing and relationship estimation
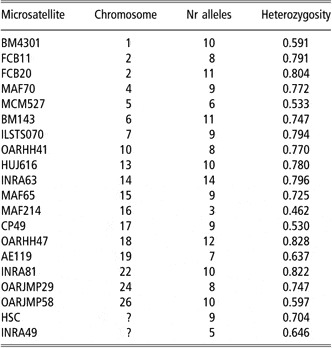
Ignoring existing relationships in the first generation may be misleading, particularly if animals of some flocks are more related to each other than to animals from other flocks. Pedigree records were not available; therefore, relationships were evaluated with the help of microsatellite markers. One owner with two flocks decided not to take part in the sampling scheme; therefore relationships in only six flocks were evaluated. Blood samples from 159 animals across the six participating flocks, including all 108 rams available for breeding in these flocks, were taken. Samples were typed for 20 microsatellite markers (Table 1). Kinships (f) were estimated using the weighted equal drift similarity (WEDS) method of Oliehoek et al. (Reference Oliehoek, Windig, van Arendonk and Bijma2006). In simulations, the WEDS estimator proved to work better than an array of commonly used kinship estimators in structured populations with inbreeding. WEDS is an estimator based on the relationship between molecular similarity and f. Molecular similarity has to be corrected for alleles that are alike in state but not identical by descent. The WEDS estimator uses a different correction factor for each locus so that the change in coancestry since a hypothetical founder population has been equal over all loci (details in Oliehoek et al., Reference Oliehoek, Windig, van Arendonk and Bijma2006). Average kinships within and between flocks were computed to get an overall picture of the current genetic diversity.
Microsatellites used for the estimation of relatedness

Simulations for the breeding circle scenario were repeated with marker-estimated relationships in the first generation for the six flocks participating in the DNA typing. Since not all animals in the initial generation were typed, their relationships were partly simulated, partly determined with the help of marker-estimated kinships. Animals that were not typed received in the simulations an inbreeding coefficient equal to the average of its flock plus or minus a random value. This value was drawn from a normal distribution with average of zero and a standard deviation (s.d.) as in the largest flock. Likewise, relationships with members of its own flock (other flocks) were equal to the average relationship within the flock (with the other flock) plus a random value. This does not guarantee a positive definite relationship matrix, but since no inversion of matrices was involved, the approximation of the real relationship matrix was appropriate.
Results
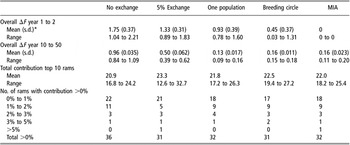
The exchange of individuals between flocks determined the rates of inbreeding. Without rotational mating, ΔF from year 1 to year 2 ranged from 0.93% for full exchange between flocks to 1.75% for no exchange between flocks (Table 2). With an exchange of on average 5% of the rams between the flocks, inbreeding rates were about halfway (1.33%) between full and no exchange between flocks. Rotational mating reduced inbreeding rates from year 1 to year 2 to 0.45% for the breeding circle, and to 0% for MAI. In the latter case, inbreeding was not possible since relationships between flocks in the base generation were set to 0, and consequently inbreeding could not occur until ewes of each flock had been mated with rams from all other flocks.
Inbreeding rates (ΔF, in %) and long-term contribution of founder rams (in %) estimated by computer simulations for eight flocks

Evaluated are no exchange between flocks, 5% of rams exchanged, rams exchanged according a breeding circle, rams exchanged according to a maximum inbreeding avoidance (MIA) scheme and full exchange across all flocks (i.e. one population). Number of rams with contribution is the number out of 360 founder rams contributing to the population after 20 years of breeding.
*Mean and s.d. of 25 simulations.
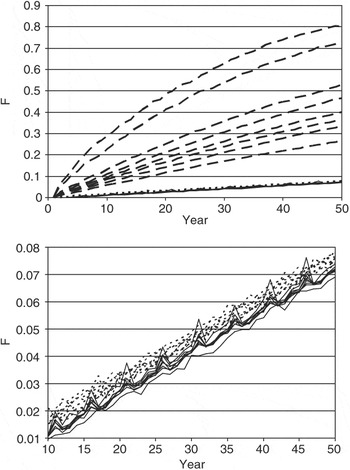
ΔF decreased in later years for all scenarios except for MAI. In the first years, selection for scrapie resistance was still strong; in later years it was absent after fixation of the ARR allele. From year 10 onwards, average ΔF was constant over years for all scenarios, except MIA and 5% exchange. Without rotational mating it varied from 0.13% (full exchange) to 0.96% (no exchange). For both rotational mating schemes, ΔF was 0.16%, slightly above the value for full exchange between flocks. For 5% exchange, mean ΔF after year 10 was on average 0.50%. It fluctuated, however, considerably in an irregular fashion from −0.41% to +1.01%. This was due to the random nature of the exchange of rams. When related rams were exchanged ΔF increased, and when unrelated rams were exchanged ΔF decreased. Under MAI, ΔF fluctuated in a regular fashion, with peaks every 5 years of about 0.40%, the next year followed by a ΔF of about −0.25%, and in between ranging from about 0.12% to 0.20% (Figure 3).
Predicted average inbreeding coefficients for all eight flocks of the Kempisch Heideschaap. Inbreeding coefficients were estimated with computer simulations. Each line is the average of 25 simulation runs. Dashed lines (top in top panel): no exchange of rams between flocks. Order of dashed lines from top to bottom is according to flock size, from smallest flock at top (flock no. 6) to largest flock at bottom (flock no. 1). Stippled lines: exchange of rams organised according to breeding circle. Solid lines: exchange organised according to maximum inbreeding avoidance scheme. Relatedness in first generation was set to 0. Lower panel is enlargement of section of the top panel to show pattern and variation in breeding circle and maximum inbreeding avoidance schemes.

Between simulations within scenarios ΔF varied considerably, especially in the first years, except for MAI where no inbreeding was possible in the first year. Standard deviations (Table 2) in the first year ranged from 0.31% (5% exchange) to 0.39% (full exchange). For the non-rotational scenarios, the maximum ΔF observed was more than twofold the minimum ΔF. For the breeding circle, ΔF ranged from almost 0% (0.03%) to 1.31%. In later years the differences between simulations decreased. The smallest differences occurred for the breeding circle (s.d. 0.011%), and the largest differences for the 5% exchange (s.d. 0.062%). In the latter case, ΔF between years within simulations varied from −4.0% to +4.0%. Variation was somewhat higher for MAI (range 0.11% to 0.20%) than for the breeding circle (range 0.15% to 0.18%).
Over flocks inbreeding rate varied, especially when no animals were exchanged between flocks (Figure 1). In that case, ΔF within flocks varied, depending on flock size from 1.84% (largest flock) to 4.27% (smallest flock). In later generations ΔF varied from 0.84% to 3.19% within flocks. With 5% exchange between flocks, ΔF within flocks varied from 0.28% for the largest flock to 1.99% for the smallest flock. There was slightly more variation under MAI than under the breeding circle scheme. For MAI the inbreeding rates varied between years within flocks in a regular 5-year pattern similar to the overall pattern for the whole population. For the smallest flock this pattern ranged from −0.92% to +0.98%, while for the largest flock it ranged from −0.20% to 0.30%. When inbreeding rates are calculated over a 5-year period they ranged over flocks from 0.17% to 0.60%. When exchange was organised following a breeding circle, variation in ΔF across flocks reduced considerably. ΔF within flocks varied from 0.21% to 0.51% in the first generation. In later generations ΔF hardly varied over flocks (0.16% to 0.18%). The breeding circle thus seems an efficient way not only to reduce inbreeding rates, but also to equalise variation in inbreeding rates across flocks.
The contribution of founder rams to later generations stabilised after 20 years. The largest number of contributing founder rams was 36 for no exchange (Table 2). For all other scenarios the number of contributing founder rams was 31 or 32. The 10 rams with the highest contributions contributed 20.9% (no exchange) to 23.3% (5% exchange). Thus, slightly less than half of the total contribution of 50% of all rams was contributed by 10 rams under all scenarios. Under all scenarios contributions varied across simulations, with the largest variation observed for 5% exchange, e.g. top 10 rams contribution varied from 12.6% to 32.3% under 5% exchange. Apart from 5% exchange the distribution was remarkably similar under different scenarios. For 5% exchange more rams with contributions between 0% and 1% were observed, and less rams with contributions between 1% and 2%, than for the other scenarios.
Marker-estimated relationships
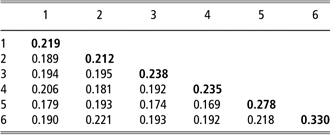
Estimated coancestries in the founder generation were on average 0.199, with an s.d. of 0.063 and varying from 0 to 0.553. Average inbreeding coefficients of flocks varied from 0.158 to 0.272 (Table 3). If within-individual relationships are included in the average relationship coefficients of flocks (Table 4), the smallest flocks have the highest average relationship. This indicates that with random breeding within flocks, inbreeding rate will be highest in these flocks. Relationships tended to be higher within flocks than across flocks (Table 4), indicating that exchanging animals between flocks will reduce inbreeding. Average relationship coefficients between flocks ranged from 0.17 to 0.22. This relatively small variation indicates that in the first generation of a breeding circle the inbreeding rates will depend to a limited extent only on which flock provides rams for each flock.
Flocks participating in the breeding circle and DNA typing

Size is total of breeding males and females, typed animals include all rams available for breeding. Average F is the average inbreeding coefficient (self-coancestry) of typed individuals, average f is the average kinship (coancestry) between typed individuals. F and f are marker-based estimates.
Average estimated kinships within and across flocks
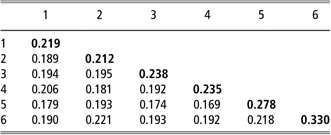
Within flock estimates (in bold on diagonal) include self-coancestries.
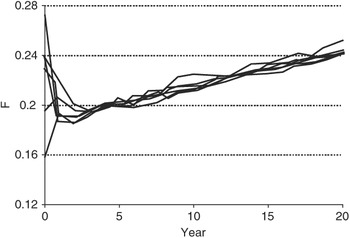
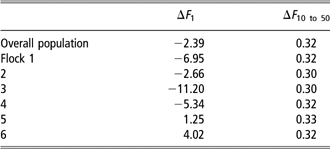
A breeding circle had the effect that in the first years average inbreeding coefficients of flocks converged (Figure 4). Average inbreeding coefficients increased for the two flocks with the lowest initial inbreeding, and decreased for the four flocks with the highest inbreeding. Consequently, inbreeding rates within flocks in the initial generation ranged from −11.7% to +4.0% (Table 5), resulting in an overall ΔF in the first generation of −2.39%. Inbreeding rates stabilised after a few generations around 0.31%, with hardly any variation across flocks.
Effect of breeding circle with six flocks. Inbreeding coefficients and relationship coefficients are estimated in generation 0 with the help of markers. Each line represents the average of a single flock over 25 simulations.

Inbreeding rates (ΔF) estimated by computer simulations
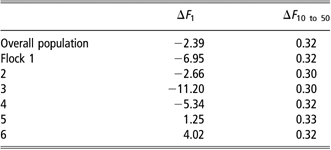
Each estimate is the average of 25 simulations. Scenario evaluated is a breeding circle with six participating flocks. ΔF 1: inbreeding rate in first year, based on marker-estimated relatedness of existing parental generation. ΔF 10 to 50: inbreeding rate from 10th to 50th year.
Discussion
Rotational mating schemes, and breeding circles in particular, proved to be an efficient way to reduce inbreeding rates. The advantage of rotational mating schemes is that inbreeding restriction can be achieved in a relatively simple way. There is no pedigree needed as in, for example, the method of Goyache et al. (Reference Goyache, Gutierrez, Fernandez, Gomez, Alvarez, Diez and Royo2003), nor estimation of relatedness using molecular markers. Utilisation of animals from outside the subpopulation will generally reduce inbreeding rates but the advantage of rotational mating schemes is that this is done in a systematic way so that in the long run low inbreeding rates are assured. Two steps involved in inbreeding are selection of the parents and mating of the selected parents. The first step is the most important in determining rates of inbreeding in the long run, the second may prevent excessive inbreeding by avoiding the mating of closely related individuals but does not influence long-term inbreeding rates (Falconer and Mackay, Reference Falconer and Mackay1996; Woolliams, Reference Woolliams2007). Rotational mating is involved in both steps. Selection of parents is restricted because each unit has to provide sires preventing the selection of a few highly related sires. The selected sires are mated to ewes from different units preventing the mating of highly related parents.
Several interesting points can be concluded from the simulations. The difference in inbreeding rates across flocks reduces for the maximal inbreeding avoidance scheme and almost disappears for the breeding circle. This means that the smallest flocks benefit more than the larger flocks. However, all flocks benefit and in the schemes provided here, small flocks also contribute to inbreeding restriction. The number of founder rams contributing to later generations is maximised when there is no exchange between flocks. Rotational mating schemes are very similar in this respect to complete exchange between flocks. Another effect of breeding circles is that for flock owners inbreeding rates are more predictable, because they are the same over the whole population and less dependent on flock size and irregular import of animals from outside the flock. In the initial generations when selection for scrapie resistance was strong, the inbreeding rate with a breeding circle was even lower than inbreeding in a completely random mating population without flocks. Apparently, the breeding circle prevents mating of related animals with the desired genotypes, by keeping them separate in flocks. The maximum inbreeding avoidance scheme works even better in this respect. At least in the initial generations inbreeding is completely avoided by using each year a different herd. However, in reality, animals of different flock are somewhat related (e.g. Table 4) so that even with maximum inbreeding avoidance some inbreeding will occur at the start of the scheme.
The difference between breeding circles and MAI with respect to average inbreeding coefficients was investigated for different numbers and sizes of breeding units and different relationships between them, by De Rochambeau and Chevalet (Reference De Rochambeau and Chevalet1985). With few (e.g. 5) breeding units, breeding circles performed better than MAI. However, average inbreeding coefficients were lowest under MAI when the population was split into more (e.g. >10) breeding units. Unfortunately, the effect on inbreeding rates was not investigated, nor the effects after 20 generations. MAI avoids inbreeding as long as possible by mating different breeding units each year (or generation). Thus, initially MAI is the best possible solution. After all units have been crossed, however, inbreeding also increases under MAI. Since breeding structures are set up to conserve diversity for the long term, it is more important to monitor inbreeding rates in later generations. The success of a breeding programme aimed at conserving diversity, however, depends not only on its ability to reduce inbreeding but also on its usefulness in practice.
A breeding circle has several practical advantages over a maximum inbreeding avoidance scheme. An important advantage is that inbreeding rates are less variable, both between years and between flocks. This makes the inbreeding rates more predictable, and reduces the probability of a flock having in a particular year a too high inbreeding rate. Another practical advantage of breeding circles is that addition of a subpopulation can easily be incorporated in the scheme, contrary to the maximum inbreeding avoidance scheme. Moreover, because subpopulations always receive males from the same donor subpopulation, the breeding circle can be designed in such a way that, for example, the geographical distance between subpopulations exchanging animals is minimised. Also, if an owner of a population does not wish to have contact with a particular other owner, for personal reasons or other, the owners can be placed at opposite ends of the circle so that inbreeding restriction does not suffer from incompatibility between two owners. In a maximal inbreeding avoidance scheme, all owners will have to exchange individuals at some point with each other.
Breeding circles have some similarities with sire reference schemes. In sire reference schemes, teams of rams (reference sires) are formed that are to be used in different flocks to increase genetic connectedness between flocks. This enables more reliable breeding value estimation and more efficient selection. As a side-effect, inbreeding may be reduced when using a sire reference scheme, because reference sires are used outside their native flock (Roden, Reference Roden1996; Lewis and Simm, Reference Lewis and Simm2000). A difference with breeding circles is that rams may be used in more than one flock and that reference sires can be used next to rams born in the flock itself. Breeding circles are designed to decrease inbreeding levels, but as a side-effect will increase genetic connectedness.
Breeding circles will be effective for other species as well. This extends not only to agricultural species, but also, for example, to zoo species. The attractiveness of a breeding circle is that the existing population structure is kept intact. For example, if zoos on two different continents contain populations of a threatened species, transcontinental transport is needed for only two donor–recipient combinations, while the remaining part of the breeding circle can be implemented within continents. This may be especially efficient if some zoos have facilities for artificial inseminations while others have not. Another great advantage is that even if a zoo can house only a single family of a particular species, they can still contribute to and benefit from the inbreeding restriction scheme of the whole population. Even for species distributed over a large number of zoos, a breeding circle is relatively easy to manage, since for each zoo only two contacts, the donor and the recipient zoo, are needed.
For non-captive wild species, rotational mating schemes are less interesting, since it is generally not possible to catch all males and release them in another subpopulation. However, a reduced breeding circle where instead of all males a few males are exchanged following the scheme of a breeding circle may provide an alternative. Intuitively, the effect must be similar to the breeding circles described here, since in a breeding circle females already remain in the same population. Simulations are however needed to determine what the effect is if (some) males remain as well in the same subpopulation. Interestingly, in natural populations such as deer, a kind of rotational mating occurs naturally because males leave the herd in which they were born before reaching adulthood.
Breeding schemes within flocks that reduce inbreeding were already investigated by Wright (Reference Wright1921 and Reference Wright1938). Kimura and Crow (Reference Kimura and Crow1963) suggested MAI. It is interesting that MAI within flocks is proven not to be always the most efficient way to reduce inbreeding (Montgomery et al., Reference Montgomery, Ballou, Nurthen, England, Briscoe and Frankham1997). Sanchez et al. (Reference Sanchez, Bijma and Woolliams2003) investigated a number of schemes whereby each animal is replaced in the next generation by one offspring only. They concluded that a so-called round robin scheme was the most effective in reducing inbreeding rates. Here, animals are split over breeding groups and each breeding group provides the dam for the next breeding group, except in two cases. One breeding group consists of entirely males and provides sires for all other breeding groups, and one breeding group provides the dam for its own group and the next group as well. There is thus some similarity with a breeding circle where each breeding group provides sires for the next breeding group.
After the publication of de Rochambeau and Chevalet (Reference De Rochambeau and Chevalet1985), breeding circles are conspicuously absent in the conservation genetics literature. There is some literature on rotational mating schemes with a central group of females mated rotationally to different inbred sire lines (Figure 1a). Whether such schemes are more, equally or less efficient than breeding circles is not clear. Honda et al. (Reference Honda, Nomura and Mukai2004) analysed such schemes theoretically, thus enabling to establish without simulations the effect of varying flock sizes or number of participating flocks. A similar undertaking will be needed for breeding circles. Currently, it is not clear what the answer is to questions like how many flocks is optimal, is pairing of small flocks with larger ones such as done in this study the best way, is it better to split a large flock into two flocks, etc. Moreover, one cannot predict in advance what the inbreeding level will be with a breeding circle and simulations have to be set up to determine this. Prediction of inbreeding levels will be easier if an analytical approach is available.
It is also not clear in what cases MAI, breeding circles or inbred sire lines are the most efficient way to reduce inbreeding. The results of de Rochambeau and Chevalet (Reference De Rochambeau and Chevalet1985) suggest that with less breeding units (e.g. <6) breeding circles may be more efficient than MAI. Populations can always be split into more breeding units so that MAI may be more efficient than a breeding circle. The question is whether this holds in the long run, and whether splitting into more units is always practicable. Part of the advantage of MAI is caused by the delaying the use of the same donor–recipient combination of flocks as long as possible. With stronger relationships between flocks this advantage is smaller, and in the long run this advantage disappears. Although it is not clear under which circumstances MAI or breeding circles are the most efficient, it is clear that both breeding circles and MAI are an efficient way to reduce inbreeding.
Optimal contribution is in theory the most efficient way to reduce inbreeding. It has the advantage that it takes all relationships in the population into account and therefore finds the optimal solution. In practice, however, several difficulties arise when trying to implement optimal contribution. First of all relationships of animals need to be known. In case of unknown or unreliable pedigree records, this means that marker-estimated kinships are needed, which can be quite costly. In this paper, we estimated relationships for all the rams and a few ewes only. Such relationships in the initial generation enables the combination of optimal contribution in the initial generation followed by a breeding circle in later generations. Or one may decide to estimate relationships with markers, once every 10 generations or so, or, for example, every n generations if there are n subpopulations, and combine optimal contributions with a breeding circle. Another disadvantage of optimal contribution is that contributions can be hard to realise. With artificial insemination it is easier to vary the contributions of potential fathers, but most rare breeds rely on natural inseminations. Breeding circles, although less efficient than optimal contribution, are more practical in use. In practice, the choice of an inbreeding reduction scheme will also be guided by the ease of implementation. Optimal contribution has probably the greatest advantage in a population with a reliable pedigree that is structured in different units (Oliehoek et al., Reference Oliehoek, Windig, van Arendonk and Bijma2006). The attractiveness of a breeding circle is that the existing breed structure of flocks is kept intact. In dairy cattle a scheme with a central nucleus of commercial females that is rotationally mated with inbreeding lines may be more appropriate.
Inbreeding rates in the Kempisch Heideschaap will be high in the coming generations without special measures. The simulations indicated that inbreeding rates will be over 1.33% under the scenario of 5% exchange of rams, which probably matches the current situation the closest. This is well above the limit of 1% above which the population status is considered critical (Food and Agriculture Organization (FAO), 1998). Breeding circles are a practical and efficient way to reduce inbreeding and the flock book decided to implement a breeding circle for six flocks starting in the breeding season of 2006.
Acknowledgements
We are grateful to the following persons and institutions for help and support in this study. The stichting Kempisch Heideschaap provided data of the breed and helped with selecting animals and sampling their blood for DNA typing. Marinus te Pas helped in selecting the microsatellites. Hanneke Meuleman and Henk Sulkers coordinated and helped with sampling animals for DNA typing. Dr van Haeringen laboratorium (Leanne Goor) provided the typing of the microsatellites. The Animal Health Service provided data on scrapie genotypes. The scrapie stuurgroep and the ministry agriculture and food helped to finance this study.