INTRODUCTION
Competition and predation are the two most widely studied ecological interactions between species. However, the body of literature on the intra- and inter-specific interactions between parasites pales in comparison with that for free-living eukaryotes, despite parasitic organisms outnumbering the latter (May, Reference May1992; Windsor, Reference Windsor1998). Host-parasite interactions generally involve communities of parasites (Lello et al. Reference Lello, Boag, Fenton, Stevenson and Hudson2004; Graham, Reference Graham2008). However, due to the aggregated nature of parasites, not all combinations of species will be encountered in each host individual (Poulin, Reference Poulin2001). When co-occurring, species can co-exist and/or interact to benefit both parasites or be detrimental to one of the species. For instance, in wild rabbits, the strongyloid nematode Graphidium strigosum is able to modulate host immunity, thus its presence could have a positive effect on the numbers of another strongyloid, Trichostrongylus retortaeformis (Lello et al. Reference Lello, Boag, Fenton, Stevenson and Hudson2004). Conversely, in laboratory mice, replication of microparasites requiring red blood cells is reduced in the presence of helminths inducing anaemia (Graham, Reference Graham2008). Evidence for intra- and inter-specific competition in parasites includes numerical and/or functional responses (Thomson, Reference Thomson1980). Numerical responses are those that regulate parasite intensity of infection at the infrapopulation (conspecific parasites within each host individual) level (Poulin, Reference Poulin2001), such as a decrease in numbers (e.g., Dobson, Reference Dobson1985), size and hence fecundity (e.g., Keymer, Reference Keymer1982), whereas functional responses are modifications to the realised niche of infrapopulations in response to competitors (Poulin, Reference Poulin2001), such as interactive site segregation (e.g., Stock and Holmes, Reference Stock and Holmes1988).
In intra-specific interactions, numerical responses in helminth infections are generally density dependent and can prevent the exponential growth of parasite populations (Keymer, Reference Keymer1982; Shostak and Scott, Reference Shostak and Scott1993). Furthermore, the size of the realised niche of an infrapopulation is by and large correlated with intensity of infection (Bush and Holmes, Reference Bush and Holmes1986; Alarcos et al. Reference Alarcos, Ivanov and Sardella2006; Pie et al. Reference Pie, Engers and Boeger2006). Similarly, in inter-specific interactions, the relative intensities of infection can affect the survival, fecundity, and establishment (Silver et al. Reference Silver, Dick and Welch1980; Holland, Reference Holland1984; Dobson, Reference Dobson1985) of individuals in an infrapopulation, resulting in a possible reduction in recruitment and influencing transmission patterns of entire populations (Poulin, Reference Poulin2007). On the other hand, functional responses are generally observed in inter-specific scenarios and can be independent from numerical responses (Poulin, Reference Poulin2001). Interactive site segregation (Holmes, Reference Holmes1973) can be defined as the overlap in realised niches being less than that of the fundamental niche within species-pairs (Poulin, Reference Poulin2001). For instance, inter-specific interactions leading to niche shifts of one species have been observed in gastro-intestinal helminth communities from a wide range of hosts, such as amphibians (Hamann et al. Reference Hamann, Kehr and Gonzalez2009), birds (Bush and Holmes, Reference Bush and Holmes1986; Stock and Holmes, Reference Stock and Holmes1988), insects (Adamson and Noble, Reference Adamson and Noble1993), fish (Friggens and Brown, Reference Friggens and Brown2005; Hassanine and Al-Jahdali, Reference Hassanine and Al-Jahdali2007) and mammals (Ehman, Reference Ehman2001).
The spiral intestine in skates is relatively short. In these animals, increased surface area is achieved by the presence of intestinal mucosa of the intestine coiled along a central axis forming a descending spiral (anterior to posterior), hence its name: spiral intestine. When opened along the ventral blood vessel, the spiral opens up exposing mucosal flaps likened to the pages of a book and providing a discrete area from which attachment sites of helminths can be recorded. For a more detailed description, see Parker (Reference Parker1879) or McVicar (Reference McVicar1979). The attachment sites of tapeworms within the spiral intestine have been studied in several elasmobranch species (Euzet, Reference Euzet1959; Williams, Reference Williams1961, Reference Williams1968; Rees and Williams, Reference Rees and Williams1965; Carvajal and Dailey, Reference Carvajal and Dailey1975; McVicar, Reference McVicar1979; Borucinska and Caira, Reference Borucinska and Caira1993; Cislo and Caira, Reference Cislo and Caira1993; Curran and Caira, Reference Curran and Caira1995; Friggens and Brown, Reference Friggens and Brown2005; Alarcos et al. Reference Alarcos, Ivanov and Sardella2006; Randhawa and Burt, Reference Randhawa and Burt2008; Twohig et al. Reference Twohig, Caira and Fyler2008) and seem to be determined by: (1) adaptations of the bothridia to the mucosal topography of the spiral intestine (Williams, Reference Williams1961, Reference Williams1968; Rees and Williams, Reference Rees and Williams1965; Carvajal and Dailey, Reference Carvajal and Dailey1975; McVicar, Reference McVicar1979; Borucinska and Caira, Reference Borucinska and Caira1993; Randhawa and Burt, Reference Randhawa and Burt2008); (2) resource availability (Williams, Reference Williams1961; McVicar, Reference McVicar1979; Cislo and Caira, Reference Cislo and Caira1993; Curran and Caira, Reference Curran and Caira1995); (3) physicochemical variables (McVicar, Reference McVicar1979); (4) scolex size (Borucinska and Caira, Reference Borucinska and Caira1993); (5) parasite phylogenetics (Cislo and Caira, Reference Cislo and Caira1993; Alarcos et al. Reference Alarcos, Ivanov and Sardella2006; Randhawa and Burt, Reference Randhawa and Burt2008); and (6) competitive interactions (Friggens and Brown, Reference Friggens and Brown2005). Recently, the tapeworm fauna of 4 sympatric skate species in the northwest Atlantic were described (Randhawa et al. Reference Randhawa, Saunders and Burt2007, Reference Randhawa, Saunders, Scott and Burt2008; Randhawa and Burt, Reference Randhawa and Burt2008) and the attachment site of each individual worm was noted (Randhawa and Burt, Reference Randhawa and Burt2008). Furthermore, the spatial distribution patterns for each tapeworm population was reported and their niche breadth and the overlap between each helminth species-pair quantified (Randhawa and Burt, Reference Randhawa and Burt2008). However, specific hypotheses of intra- and inter-specific interactions within these assemblages were not tested. The objectives of this study are to assess, using general linear models (GLM), the numerical and functional responses of intra- and inter-specific interactions within each helminth infracommunity from 3 skate species: little skate Leucoraja erinacea (Mitchill), smooth skate Malacoraja senta (Garman), and thorny skate Amblyraja radiata (Donovan). In addition to data presented by Randhawa and Burt (Reference Randhawa and Burt2008), I describe the distribution patterns of a nematode recovered from all 3 skates and include this nematode in my analyses and include new data on the parasites from A. radiata.
MATERIALS AND METHODS
Sampling
From May to August 1997 and from June 2002 to September 2004, 31 Amblyraja radiata, 208 Leucoraja erinacea, and 33 Malacoraja senta were collected from Passamaquoddy Bay and waters surrounding the West Isles of the Bay of Fundy, New Brunswick, Canada (see Randhawa et al. Reference Randhawa, Saunders and Burt2007, Reference Randhawa, Saunders, Scott and Burt2008; Randhawa and Burt, Reference Randhawa and Burt2008 for details). Additionally, 61 A. radiata were collected from the North Sea in July and August 2005 by otter trawl on board the FRV Scotia. Material from the North Sea was examined fresh as described in Randhawa et al. (Reference Randhawa, Saunders and Burt2007), the number of scoleces was used to determine the number of parasites and the site of attachment (whorl number) of each worm was noted.
Parasite distributions
Previously, tapeworm spatial distribution patterns, niche breadth and overlap between each species-pairs were assessed for each host population (Randhawa and Burt, Reference Randhawa and Burt2008). For the purposes of this study, site of attachment and niche breadth were calculated for each infrapopulation. Site of attachment, expressed as the average for the infrapopulation, was obtained for attached worms, using the following formula: (∑ Wi)/N; where Wi corresponds to the attachment site (whorl number) for individual i and N corresponds to the total number of individuals in the infrapopulation. Niche breadth of each infrapopulation was calculated using Levin's niche breadth (LNB) according to the formula 1/∑ (p i)2 (Simkovà et al. Reference Simkova, Desdevises, Gelnar and Morand2000); where p i corresponds to the proportion of the infrapopulation exploiting whorl i. Values for LNB range from 1 to the maximum number of whorls in a species, which corresponds to niche size, with greater values representing wider niches. Unattached worms were excluded from these calculations, as their site of attachment could not be determined.
For each infracommunity the following information was collected: (1) average position of each infrapopulation; (2) niche breadth of each infrapopulation; (3) abundance of each infrapopulation; (4) abundance of all parasites; (5) host total length; (6) host sex; (7) month of collection (host); and (8) locality.
Statistics
All continuous variables were log-transformed. No difference in average position and niche breadth were attributable to sex or month of collection (results not shown), therefore these variables were removed from the set of predictors. Numerical responses were assessed using GLM with the intensity of infection (number of parasites per infected individual host) of each infrapopulation as dependent variables and abundance (mean number of parasites in all individual hosts) of each infrapopulation(s), intensity of infection of each infracommunity, and host total length as predictor variables. Functional responses were assessed using GLM with the average position and niche breadth of each infrapopulation as dependent variables and abundance of each infrapopulation(s), intensity of infection of each infracommunity, and host total length as predictor variables. Since A. radiata was the only skate recovered from both sides of the Atlantic, locality was included as a predictor variable in analyses including this species. Analyses were repeated for each helminth species-pair with intensity of infection of each infrapopulation, intensity of infection of both infrapopulations and host total length as predictor variables.
All possible combinations of main effects linear regression models were computed and ranked according to their corrected Akaike information criterion values (AICc) obtained from the residual sum of squares for each model using the method outlined by Anderson (Reference Anderson2008). The differences in AICc (Δ AICc) and model weights (wi) were computed to determine the relative importance and rank of each variable (see Anderson, Reference Anderson2008). The latter approach provides insights into the importance of each variable, taking into account the possible multicollinearity between predictor variables (Anderson, Reference Anderson2008). When no single model was overwhelmingly supported, the multi-model inference approach was used (Burnham and Anderson, Reference Burnham and Anderson2002). Model-averaged parameter estimates were obtained by weighting parameter estimates according to model probabilities (see Anderson, Reference Anderson2008). The unconditional variances were obtained in order to calculate a 95% confidence interval for each predictor, taking into account the sampling variance and the variance component for model selection uncertainty (Burnham and Anderson, Reference Burnham and Anderson2002; Anderson, Reference Anderson2008). This approach provides an estimate of the ‘slope’ for each parameter, independent from others present in the model (Anderson, Reference Anderson2008). A priori, sets of potentially biologically significant second-degree interactions between predictor variables were selected and compared to models incorporating main effects included in the interaction. The evidence ratio, between the model including the interaction term and the ‘best’ model from each set (based on AICc), was used to determine whether the inclusion of the interaction term improved the model significantly.
RESULTS
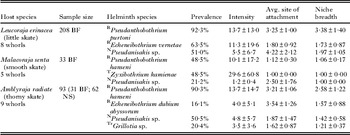
The sampling site, prevalence (proportion of infected individuals in a population), average intensity of infection, average site of attachment and average niche breadth data for each species included in these analyses are presented in Table 1 and include prevalence and intensity data reported by Randhawa and Burt (Reference Randhawa and Burt2008). Additionally, several parasite infrapopulations were excluded from this study due to their low prevalence (<10%): Grillotia sp. recovered from the little skate and the smooth skate, an unidentified acanthocephalan from the little skate, Echeneibothrium canadensis Keeling and Burt, Reference Keeling and Burt1996 and Phyllobothrium piriei Williams, Reference Williams1968 from the thorny skate.
Summary of the host distribution, prevalence, intensity of infection, average site of attachment, and niche breadth for helminths included in this study

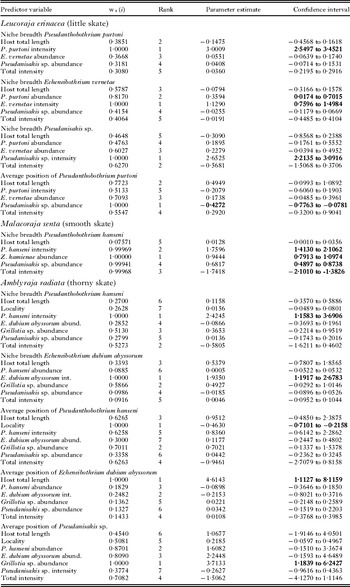
With the exception of P. hanseni niche breadth in M. senta, no results yielded a well-supported model, and as such, a model-averaging approach was conducted for all other analyses (summarized in Table 2). Furthermore, in all GLM analyses, no main effects models were improved significantly by the inclusion of their respective interaction terms (results not shown), no numerical responses were detected (results not shown), and no functional responses were identified in double or triple infections (results not shown).
Predictor variable relative importance weights [w+(i)], ranks, weighted model average parameter estimates, and 95% confidence interval for Niche breadth and Average position

Leucoraja erinacea
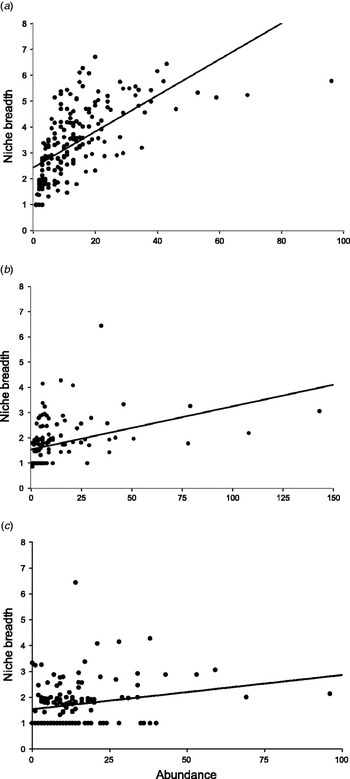
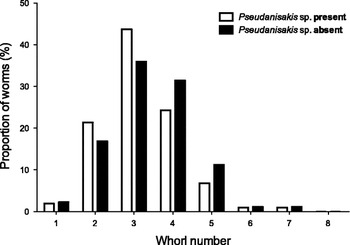
This skate species was infected with 2 cestodes (Pseudanthobothrium purtoni Randhawa, Saunders, Scott and Burt, Reference Randhawa, Saunders, Scott and Burt2008 and Echeneibothrium vernetae Euzet, 1956) and 1 nematode (Pseudanisakis sp.) present in sufficient numbers to be included in subsequent analyses (Table 1). The GLM analyses included 192, 133 and 106 hosts infected with P. purtoni, E. vernetae, and Pseudanisakis sp., respectively (Table 1). Results indicate a niche extension of P. purtoni, E. vernetae and Pseudanisakis sp. in the presence of increasing numbers of conspecifics (Fig. 1a, b and Table 2). Furthermore, evidence for niche extension of E. vernetae in the presence of increasing numbers of P. purtoni was also observed (Fig. 1c), albeit a weaker predictor than the presence of conspecifics (Table 2). Lastly, the niche of P. purtoni in the presence of the nematode shifted anteriorly (Fig. 2 and Table 2). No evidence for niche shift was observed for other helminths infecting L. erinacea.
Relationships between niche breadth and the abundance of helminths in the little skate (Leucoraja erinacea): (a) Pseudanthobothrium purtoni, (b) Echeneibothrium vernetae (intensity of infection for E. vernetae), and (c) E. vernetae (abundance of P. purtoni). The lines represent the best fit from simple linear regressions: (a) r = 0·6461, P < 0·0001; (b) r = 0·3859, P < 0·0001; and (c) r = 0·2137, P = 0·0135.

Frequency distribution of the average position (whorl number) of Pseudanthobothrium purtoni infecting the little skate (Leucoraja erinacea) in the presence (open bars) or absence (full bars) of the nematode Pseudanisakis sp., expressed as the proportion (percentage) of the infrapopulations occupying each whorl. The preferred site of attachment of Pseudanisakis sp. is whorl 4.

Malacoraja senta
This skate species was infected with 2 cestodes (P. hanseni Baer, 1956 and Zyxibothrium kamienae Hayden and Campbell, 1981) and 1 nematode (Pseudanisakis sp.) present in sufficient numbers to be included in subsequent analyses (Table 1). No GLM analyses were performed on the average site of attachment and niche breadth for Z. kamienae and Pseudanisakis sp. since both species were confined solely to the anterior-most whorl. The GLM analyses included 15 hosts infected with P. hanseni. In descending order of relative effect size, the numbers of P. hanseni per infrapopulation, total number of helminths per infracommunity, numbers of Z. kamienae per infrapopulation, and numbers of Pseudanisakis sp. per infrapopulation had 95% confidence intervals bound away from ‘0’ (Table 2), an indication of niche extension of P. hanseni in the presence of increasing numbers of conspecifics and of other helminths. Furthermore, there was no evidence that the average site of attachment for P. hanseni is affected by the presence of other helminths.
Amblyraja radiata
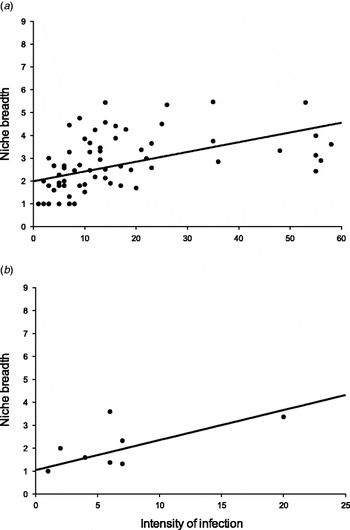
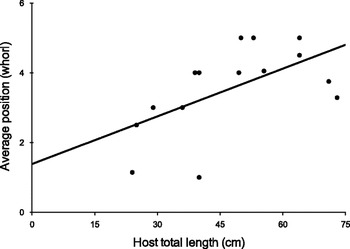
This skate species was infected with 3 cestodes (P. hanseni, E. dubium abyssorum Campbell, 1977 and Grillotia sp.) and 1 nematode (Pseudanisakis sp.) present in sufficient numbers to be included in subsequent analyses (Table 1). The GLM analyses included 84, 15, 19, and 47 hosts infected with P. hanseni, E. dubium abyssorum, Grillotia sp., and Pseudanisakis sp., respectively (Table 1). Results indicate a niche expansion only in P. hanseni and E. dubium abyssorum in the presence of increasing numbers of conspecifics (Fig. 3 and Table 2). Niche shifts were observed for P. hanseni, E. dubium abyssorum, and Pseudanisakis sp. and attributable to locality, host total length (Fig. 4), and abundance of Grillotia sp., respectively (Table 2). Therefore, Pseudanisakis sp. is the only species whose niche shifted in the presence of another helminth in the infrapopulation.
Relationships between the intensity of infection of helminths and their niche breadth in the thorny skate (Amblyraja radiata): (a) Pseudanthobothrium hanseni and (b) Echeneibothrium dubium abyssorum. The lines represent the best fit from simple linear regressions: (a) r = 0·5148, P < 0·0001 and (b) r = 0·7524, P = 0·0012.

Relationship between the average position (whorl number) of Echeneibothrium dubium abyssorum infrapopulations in the thorny skate (Amblyraja radiata) and host total length (cm). The line represents the best fit from a simple linear regression: r = 0·5782, P = 0·0240).

DISCUSSION
Evidence presented herein demonstrates that intra- and inter-specific competition is common in helminth infracommunities of the skate species included in this study. In fact, despite the lack of numerical responses, functional responses to intra- and inter-specific interactions were observed in helminth communities of all 3, and 2, skate species examined, respectively. No interactive site segregation was observed in the helminth community of the smooth skate and thus was not considered a universal phenomenon. Niche shifts in the tapeworm Pseudanthobothrium purtoni and the nematode Pseudanisakis sp. occurred in both the little skate and the thorny skate, respectively, in response to the presence of a competing species. However, interactions between the different helminths infecting the smooth skate provided no evidence for niche shifts. Randhawa and Burt (Reference Randhawa and Burt2008) showed that of the 5 whorls in the spiral intestine of the smooth skate, the posterior 3 were devoid of P. hanseni due to the incompatibility of intestinal villi and parasite bothridia. Furthermore, the compatibility between villi and bothridia in the second whorl was only possible between worms with the largest bothridia attaching to the smallest villi (Randhawa and Burt, Reference Randhawa and Burt2008). As such, any niche shift caused by the presence of Z. kamienae or Pseudanisakis sp. may result in interactive exclusion, where inter-specific interactions leading to a shift in realised niche may cause the exclusion of a species from the infracommunity (Holmes, Reference Holmes1973; Poulin, Reference Poulin2001).
A positive correlation between the number of individuals in an infrapopulation and its niche breadth (functional response) was observed for Pseudanthobothrium spp. and Echeneibothrium spp. in all their respective hosts and for Pseudanisakis sp. in the little skate. This is consistent with most other studies of helminth communities (e.g., Bush and Holmes, Reference Bush and Holmes1986; Alarcos et al. Reference Alarcos, Ivanov and Sardella2006). However, regardless of the abundance of P. purtoni in the little skate, the niche breadth never exceeded 7 out of 8 whorls. This is likely due to the posterior whorl of the spiral valve generally being devoid of worms; an observation consistent with other studies on the attachment site of tapeworms in skates (Williams, Reference Williams1961; Carvajal and Dailey, Reference Carvajal and Dailey1975; McVicar, Reference McVicar1979). Additionally, tapeworms and nematodes are trophically transmitted, thus it is expected that these will accumulate over time and that larger (older) hosts will harbour higher intensities of infection occupying wider niches than smaller (younger) host individuals. Positive correlations between host size and parasite burden have been observed in some helminths infecting elasmobranchs (Tanzola et al. Reference Tanzola, Guagliardo, Brizzola, Arias and Botte1998; Sanmartin et al. Reference Sanmartin, Alvarez, Peris, Iglesias and Leiro2000; Friggens and Brown, Reference Friggens and Brown2005), but not in others (Cislo and Caira, Reference Cislo and Caira1993; Curran and Caira, Reference Curran and Caira1995; Alarcos et al. Reference Alarcos, Ivanov and Sardella2006). In this study, no evidence was found of host size affecting parasite burden (results not shown) or niche breadth. Contrary to the null model analysis approach used by Friggens and Brown (Reference Friggens and Brown2005), the model-averaging method used in this study takes into account the possible multi-collinearity between predictors and may explain why host length seems to have negligible effects on the response variables under scrutiny.
There is other evidence for intra-specific competition, which cannot be assessed with the data in hand. For instance, crowding effect, a numerical response, is described as a negative correlation between intensity of infection and the size of the worms (Read, Reference Read1951). Although the exact mechanisms remain enigmatic, causes may be exploitative competition, interference competition, and/or host immune response (Andreassen et al. Reference Andreassen, Bennet-Jenkins and Bryant1999; Roberts, Reference Roberts2000; Bush and Lotz, Reference Bush and Lotz2000). A reduction in size, influenced by density-dependent mechanisms such as crowding, has also been associated with decreased fecundity (Szalai and Dick, Reference Szalai and Dick1989; Irvine et al. Reference Irvine, Stien, Dallas, Halvorsen, Langvatn and Albon2001; Richards and Lewis, Reference Richards and Lewis2001), but so has competition (Moqbel and Wakelin, Reference Moqbel and Wakelin1979; Silver et al. Reference Silver, Dick and Welch1980; Holland, Reference Holland1984). The outcome of competition can also be affected by the order of establishment (Poulin, Reference Poulin2007), although this can only be assessed in experimental infections. Although numerical responses were not observed on the scale examined, it is possible that a relationship exists between worm burden, worm size and individual fecundity at the level of infra-populations, but these data are not available. Biomass may have been a more appropriate measure than intensity of infection to uncover underlying patterns of competition. Parasite volume, a good correlate of biomass, has been used as an indicator of competition (Poulin et al. Reference Poulin, Nichol and Latham2003; Rauque and Semenas, Reference Rauque and Semenas2011) and may be a more representative measurement of biomass than worm length. However, in tapeworms, width generally increases posteriorly (immature proglottides are narrower than mature or gravid ones) and thickness measurements are rarely reported (Randhawa and Poulin, Reference Randhawa and Poulin2009), thus parasite volume would have been difficult to estimate accurately. Nonetheless, in this study, the range in lengths for all species excepting Grillotia sp., overlapped and their sizes were similar (Randhawa, Reference Randhawa2000); therefore it is plausible that Grillotia sp. can outcompete other helminths in skates due to the size differential. This trypanorhynch caused the nematode Pseudanisakis sp. to shift distributions in the thorny skate, yet the nematode influenced the tapeworm P. purtoni to shift niches in the little skate, albeit the effect of size is relatively small in the latter. Although further sampling is necessary, it may be that trypanorhynchs are the strongest competitors in rajid skates, followed by nematodes and other cestodes, respectively.
Differences in functional responses, or average site of attachment, in P. hanseni and E. dubium abyssorum are attributable to locality and host total length, respectively. In the case of P. hanseni, differences in average site of attachment of infrapopulations may be attributable to differences in helminth communities. Amblyraja radiata from the Bay of Fundy is infected with E. dubium abyssorum, a tapeworm absent from populations in the North Sea. Conversely, P. piriei is a tapeworm only recovered from the North Sea population. Both populations are also infected with E. canadensis, although this tapeworm is more prevalent in the North Sea population. The latter 2 parasite populations were not abundant enough to include in these analyses, but E. canadensis is a tapeworm whose preferred site of attachment is the anterior half of the spiral intestine (Keeling and Burt, Reference Keeling and Burt1996; observations herein), whereas P. piriei attaches preferentially in the posterior half of the spiral intestine (Williams, Reference Williams1968; observations herein). It is possible that the presence of E. canadensis may cause a posterior niche shift in P. hanseni. A larger sample size of individuals infected with this species may allow us to address this question using the approach described herein. Echeneibothrium dubium abyssorum is generally found in larger individuals. Although no elasmobranch tapeworm life cycle has been described to date, we can assume that E. dubium abyssorum is acquired following an ontogenetic shift in diet, possibly occurring at approximately 20–25 cm in total length. Furthermore, the average position of this tapeworm is positively correlated with size of its host. From these data, it can be inferred that P. hanseni may establish first and that with increasing numbers of P. hanseni over time (age and/or size) being correlated with niche breadth, it may outcompete E. dubium abyssorum and push it further back.
Putting these results in the context of helminth interactions in elasmobranch fishes, an interesting pattern emerges: evidence for competition is only apparent in batoids, not in sharks. Three earlier studies have examined the attachment sites of helminths in sharks and found no evidence of interaction or competition between species (Cislo and Caira, Reference Cislo and Caira1993; Curran and Caira, Reference Curran and Caira1995; Alarcos et al. Reference Alarcos, Ivanov and Sardella2006), whereas 2 previous studies of helminths in batoids have (McVicar, Reference McVicar1979; Friggens and Brown, Reference Friggens and Brown2005). Twohig et al. (Reference Twohig, Caira and Fyler2008) also suggested competition as an explanation for differences in attachment sites for 2 helminth species in the whipray Himantura walga (Müller and Henle), but did so cautiously in the absence of data on other helminth species comprising the infracommunity. Sharks are generally larger than batoids, but correcting for host body size, there are no differences in tapeworm size between those infecting sharks and batoids, respectively (Randhawa and Poulin, Reference Randhawa and Poulin2009). Although not enough data are available on the relationship between elasmobranch length or weight and size of their spiral intestine, it is likely to be strongly positive (Randhawa personal observations). However, assuming that the length and width of the spiral intestine are proportional to body size, spiral valve volume would have a greater scaling exponent than either length or width. Therefore, sharks likely provide much larger habitats to helminths than batoids and this may explain why no competitive interactions have been observed between helminths of sharks. However, this hypothesis needs to be tested by including both linear and 3-dimensional size measurements for spiral intestines, relative to fish length, in future analyses when and if these data become available.
In summary, this study suggests that the spatial distribution of helminths in skates is not random and is determined by the functional responses stemming from both the intra- and inter-specific interactions between parasites. Further work is needed to understand the role played by these interactions in the evolutionary processes shaping the adaptations of helminths to specific niches.
ACKNOWLEDGEMENTS
I am grateful to staff of the Huntsman Marine Science Centre (HMSC): F. Purton and D. Parker for their technical assistance; and M. Burgess, E. Carter, T. Hurley, J. Markey and P. Rose for assistance with collection of specimens on-board the R/V W. B. Scott. The help of D. Loveless and W. Minor of the CCGS Pandalus III is also gratefully acknowledged. My participation on a research cruise in the North Sea on-board the FRV Scotia was facilitated by K. MacKenzie and J. Morrison and I am thankful to staff of the FRS Marine Laboratory in Aberdeen (K. Coull, S. Davis, M. Gault, J. Mair, M. Mathewson, J. Mills, I. Penny, and A. Tait) for their assistance with collections in the North Sea and to the FRV Scotia staff for their hospitality on-board the vessel. Special thanks are due to K. MacKenzie for his hospitality, assistance, generosity and kindness during my visits to Aberdeen. This work was conducted during my graduate studies at the University of New Brunswick (UNB) and I appreciatively acknowledge the mentorship and support of M. D. B. Burt and G. W. Saunders. I thank R. Poulin and members of the Parasite Ecology Research Group at the University of Otago for comments on an earlier version of this manuscript.
FINANCIAL SUPPORT
The following financial assistance is gratefully acknowledged: Graduate Teaching and Research Assistantships at UNB, a UNB R. C. Frazee Research Scholarship at HMSC, a W. B. Scott Graduate Research Scholarship in Ichthyology, 2 Marguerite and Murray Vaughan Graduate Fellowships, and 1 UNB Alumni Student Merit Award. My travels to the UK were supported by 2 John S. Little International Study Fellowships (UNB). Additionally, the Natural Sciences and Engineering Research Council of Canada provided assistance through discovery and operating grants to M. D. B. Burt and a Major Facilities Access Grant to HMSC.