Implications
Recently, several documented cases of kidney stones, renal failure and deaths due to the ingestion of feed or food contaminated by melamine were reported. Further, a direct deliberate adulteration of food with melamine to increase nitrogen level was suspected. The experiment was conducted to study melamine transfer from feed to eggs and tissues by laying hens fed diets with a wide range in melamine contamination. Conclusions indicated the presence of an indirect contamination of melamine in poultry products through contaminated feed. However, eggs and tissues could represent a health hazard for consumers if hens consumed diets with melamine level higher than the maximum allowed limit.
Introduction
Melamine (1,3,5-triazine-2,4,6-triamine) is a stable substance largely used in resin and plastic manufacture, including melaware. Melamine is also a minor metabolite of pesticide cyromazine, approved for use in many countries. Owing to its widespread distribution in food packaging, industrial products and links with pesticides and fertilizers, the US Food and Drug Administration (FDA) included melamine in the ‘list of indirect additives used in food contact substances’ (code number 000108-78-1). However, migration from food contact materials is low because melamine is hydrolyzed only in strong alkaline or acidic solutions. Recently, the European Food Safety Authority (EFSA, 2010) estimated that the average typical migration (trial with hot foodstuffs using typical contact conditions of time and temperature) are 1.0, 0.6, 0.2 and 0.05 mg melamine/kg acidic, aqueous, fatty and dry food, respectively.
Consequently, a very high level of melamine in food and feeds is seen mainly as a deliberate adulteration to increase nitrogen content. Effectively, melamine is a high source of nitrogen, containing 66.7% nitrogen by weight, higher than urea (46.6%) and biuret (40.8%). For this reason, some experiments were conducted to verify whether melamine could be used in ruminant nutrition as nonprotein nitrogen (Newton and Utley, Reference Newton and Utley1978); however, the authors concluded that melamine was poorly hydrolyzed by rumen microorganisms and its use for this specific purpose was not suggested. Moreover, a high amount of melamine (i.e. 90%) was excreted within 24 h after the administration of a single oral dose in rats, confirming that melamine was poorly metabolized (Mast et al., Reference Mast, Jeffcoat, Sadler, Kraska and Friedman1983).
More recently, melamine has been banned as feed or food additive because of its toxic and carcinogenic effects on the renal system. Melamine forms crystals in renal tubular and kidney tissues, and the contemporary presence of cyanuric acid in the diet increases the dimension and consistency of the crystals (Dobson et al., Reference Dobson, Motlagh, Quijano, Cambron, Baker, Pullen, Regg, Bigalow-Kern, Vennard, Fix, Reimschuessel, Overmann, Shan and Daston2008). The FDA (2007) reported cases of renal diseases in dogs and cats fed melamine-contaminated pet food, with the deaths of some subjects. One year later, the Chinese authority reported ∼54 000 cases of kidney stones in infants, including four deaths related to the consumption of melamine-contaminated powdered infant formula (World Health Organization (WHO), 2008; Lam et al., Reference Lam, Lan, Che, Tam, Wong, Chen, Jin, Tao, Tang, Yuen and Tam2009). The WHO (2008) reported that melamine was deliberately added to raw milk to boost the nitrogen content. Further, the FDA and EFSA authorities updated the maximum melamine tolerable daily intake to levels of 0.63 and 0.50 mg/kg body weight (BW), respectively (EFSA, 2008; FDA, 2008).
Some authors have recently suggested that melamine contamination in milk could be not only related to direct adulteration but also to the presence of melamine in feeds for lactating dairy cows, because of the fact that a passage of melamine from feed to milk and milk products was reported (Cruywagen et al., Reference Cruywagen, Stander, Adonis and Calitz2009; Battaglia et al., Reference Battaglia, Cruywagen, Bertuzzi, Gallo, Moschini, Piva and Masoero2010; Shen et al., Reference Shen, Wang, Wei, Bu, Sun and Zhou2010; Sun et al., Reference Sun, Wang, Shen and Wei2011; Zheng et al., Reference Zheng, Li, He, Jin and Wang2011). In addition, a carryover of melamine from feed to egg and body tissues of laying hens has been reported by different authors (Bai et al., Reference Bai, Bai, Zhang, Lv, Qin, Li, Bai and Lin2010; Chen et al., Reference Chen, Yang, Wang, Peng, Li, Zhang and Gong2010; Dong et al., Reference Dong, Liu, Tong and Zhang2010; Valat et al., Reference Valat, Marchand, Veyrand, Amelot, Burel, Eteradossi and Postollec2011; Yang et al., Reference Yang, Huangfu and Wu2011). Recently, a pathway of melamine accumulation in various tissues (i.e. muscle, kidney, liver and abdominal fat) was reported in sheep, with a reported efficiency of melamine deposition in meat equal to ∼3.5% (Cruywagen et al., Reference Cruywagen, van de Vyver and Stander2011).
Taking into account the maximum permitted level of melamine in feed and food (2.5 mg/kg) set by the FDA and the European Union, the objective of this study was to evaluate the excretion pattern of melamine in eggs produced by laying hens exposed to a wide range of melamine concentration in the diet. In particular, the animals were fed three different levels: equal to the permitted limit and 10- and 100-fold higher. The melamine concentration in plasma, kidney, liver and muscle were also evaluated.
Material and methods
Animal housing, diets and sampling
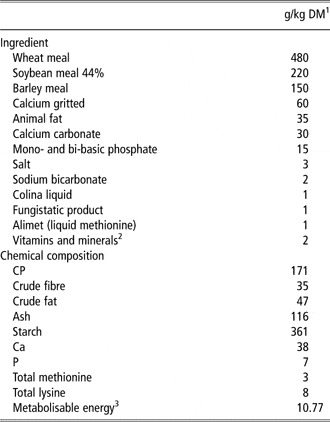
A total of 90 laying hens (Isa Brown), aged 20 weeks, were randomly allocated to 18 groups (5 hens/group) and then associated with three dietary treatments (T1, T2 and T3; six groups for each treatments). The animals were housed in boxes (100 × 100 × 100 cm in width, length and height), equipped with a free-access feeding and water cups, in a light- and temperature-controlled house. The experiment was conducted at the CeRZOO (Research and Experimental Centre, San Bonico, Piacenza, Italy) in accordance with the Italian regulation legislative decree 116/92 and the study was approved by the Veterinary local service. The room temperature was set at 24.5°C and the relative humidity at 55%; the illumination cycle was 16 h light : 8 h dark. Before the experimental period, all the hens were fed the same melamine-free basal diet (Table 1) for 14 adaptation days.
Ingredients and chemical composition of the basal diet used in the trial

1DM = dry matter.
2The premix contains (as on the label): vit. A, 5 000 000 UI; vit. D3, 1 200 000 UI, vit. E, 18 000 mg; vit. B1, 700 mg; vit. B2, 3200 mg; vit. B6, 17 600 mg; vit. B12, 10 mg; D pantotenic acid, 5000 mg; vit. H, 80 mg; vit. K3, 1400 mg; vit. PP, 20 000 mg; Co, 80 mg; Fe, 16 000 mg; I, 400 mg; Mn, 40 000 mg; Cu, 3000 mg; Se, 60 mg; Zn, 40 000 mg. Excipient at 1000 g: limestone 226 882 mg, grape pulp 194 000 mg.
3Calculated and expressed as MJ/kg.
After the adaptation period, each group was fed one of the three melamine-contaminated diets. In particular, pure melamine (99%; Sigma-Aldrich, St Louis, MO, USA) was added to the basal diet and mixed for 3 min in a 150 kg experimental mixer to obtain melamine concentrations in the diets of 2.5, 25 and 250 mg/kg for T1, T2 and T3 groups, respectively. The experimental period lasted 13 days, during which each box was given (mean ± s.d.) 10.1 ± 0.6 kg of contaminated diets. For each box, an aliquot of the diet (200 g) was collected before the beginning of the experimental period for the analysis of chemical composition (The Association of Official Analytical Chemistry (AOAC), 2000), methionine, lysine and melamine contents. The amino acids were quantified chromatographically (Jasco PU-2089; Jasco International Co., Hachigi, Tokyo, Japan) after a 24 h hydrolysis in HCl (Moore et al., Reference Moore, Spackman and Stein1958).
The BW was measured on days 1 and 13 of the experimental period. The daily feed intake and egg production were measured on days 0, 1, 3, 6, 9 and 13 for each group. Eggs were collected on days 0, 1, 3, 6, 9 and 13, weighed, grouped per box and stored at 4°C before being analyzed for melamine content. At the end of the experimental period, one hen from each box was randomly selected and slaughtered to collect blood (5 ml), kidney (whole), liver (whole) and breast muscles (50 g). Blood was transferred to Li-heparinized (17 U of heparin/ml of blood) test tubes (B.D. Vacutainer System; Becton, Dickinson and Co., Plymouth, UK) and immediately centrifuged (15 min at 4°C for 3500 × g) to obtain plasma. All tissue samples were kept at −20°C until the time of analysis.
Preparation of standard solution
Melamine was purchased from Sigma-Aldrich. A stock melamine standard solution (400 mg/l) was prepared by dissolving 20 mg of melamine into 50 ml of a 2% aqueous formic acid : methanol (50 + 50 v/v) solution. Working standard solutions (from 0.2 to 10 mg/l) were prepared by further dilutions with 25 mM ammonium formate (pH 3.2) : methanol (10 + 90 v/v, HPLC mobile phase). Aliquots of these standards were diluted with a purified extract of melamine-free egg, as well as plasma, kidney, liver and muscle, to obtain solutions for calibration curve at a concentration of melamine ranging from 0.005 to 2.0 mg/l.
Analysis of melamine
Feeds
To extract melamine from the experimental diets, 10 g of ground feed was mixed with 100 ml 0.2 M HCl : methanol (75 + 25 v/v) using a rotary-shaking stirrer for 45 min. After filtration through a folded filter paper, 5 ml of the filtrate was mixed with 5 ml dichloromethane and centrifuged at 4500 × g for 5 min. Further, 2 ml of the upper layer was purified through an Oasis MCX cartridge (6 cc 500 mg; Waters Corporation, Milford, MA, USA), previously conditioned with 5% NH4OH in methanol and 1% HCl in methanol (3 ml of each) and equilibrated with methanol and distilled water (3 ml of each). After washing the column with distilled water and methanol (3 ml of each), melamine was slowly eluted (0.5 ml/min) with 5% NH4OH in methanol (4 ml) into a graduated glass vial; subsequently, the eluate was concentrated to 2 ml under a gentle stream of nitrogen.
Eggs
For each box, three eggs were crushed (eggshells were removed and weighed) in a 50 ml polyethylene tube, and the content was homogenized using Ultra Turrax homogeneizer (Janke and Kunkel, IKA Labortechnik, Staufen, Germany) for 2 min at 9000 × g. Subsequently, an aliquot of 10 ml homogenized eggs was diluted with 10 ml 0.4 M HClO4 and centrifuged (11 000 × g for 10 min at 4°C). A volume of 5 ml of the supernatant solution was transferred to a glass vial, mixed with 5 ml dichloromethane and purified through an Oasis MCX cartridge as described for feed.
Plasma, kidney, liver and muscle
The melamine extraction and purification from plasma (2 ml) was carried out as described for eggs, whereas the extraction from kidney (2 g), liver (2 g) and breast muscles (5 g) was carried out as described above for feed analysis.
HPLC–mass spectrometry/mass spectrometry (MS/MS) analysis
Analysis was carried out using a liquid chromatography (LC)–MS/MS system, consisting of a LC 1.4 Surveyor pump (Thermo-Fisher Scientific, San Jose, CA, USA), a PAL 1.3.1 sampling system (CTC Analytics AG, Zwingen, Switzerland) and a Quantum Discovery Max triple-quadrupole mass spectrometer; the system was controlled by an Excalibur 1.4 software (Thermo-Fisher Scientific). Melamine was separated on a Luna HILIC column (3 μm particle size, 150 × 2.0 mm; Phenomenex, Torrance, CA, USA) with mobile phase 25 mM ammonium formate (pH 3.2) : methanol (10 + 90 v/v); the flow rate was 0.15 ml/min. Ionization was carried out with an ESI interface (Thermo-Fisher Scientific) in positive mode as follows: spray capillary voltage 4.0 kV, sheath and auxiliary gas 8 and 1 psi, respectively, and temperature of the heated capillary 270°C. The mass spectrometric analysis was operated in selected reaction monitoring. For fragmentation of [M + H]+ ion 127 m/z, the argon collision pressure was set to 1.3 mTorr; the selected fragment ions were 85 and 68 m/z with collision energy of 19 and 32 V, respectively. Before analysis, the purified extract of the sample was diluted (0.200 + 0.400 ml) with the mobile phase. The calibrant standards were diluted with the melamine-free extracts as for the samples. Quantitative determination was carried out using LC-Quan 2.0 software (Thermo-Fisher Scientific).
Carryover calculation
The carryover of melamine from feed to eggs was calculated on a 24 h basis by box at steady-state condition (Littell et al., Reference Littell, Henry and Ammerman1998) as follows:

Statistical analysis
Data were tested for normality with the Shapiro–Wilk test and when indication of no normal data was significant, data were log-normal transformed before statistical analysis. Data measured one time, at the end of experimental period (i.e. level of melamine in plasma, kidney, liver and muscle), were analyzed as a completely randomized design using the GLM procedure of SAS (2003), according to the model described below:

where Yij is the dependent variable on the jth box assigned to treatment i, μ is the overall mean, αi is the fixed effect of melamine log dose (i = 1 to 3) and eij is the residual error.
Data measured over time, both during the entire experimental period (i.e. BW, daily feed intake, egg production, egg weight, melamine ingestion) and at steady-state condition (from days 6 to 13; i.e. melamine egg concentration, carryover), were analyzed as repeated measurements in a completely randomized design using the MIXED procedure of SAS (2003), according to the model described below:

where Yijk is the dependent variable at time k on the jth box assigned to treatment i; μ is the overall mean; αi is the fixed effect of melamine log dose (i = 1 to 3); βij is the random effect for the box j assigned to treatment i; γk is the fixed effect of time; (α × γ)ik is the interaction between melamine log dose and time; and eijk is the residual error. The experimental unit was the box. Each variable was subjected to two covariance structures: compound symmetry and unstructured. Using the Akaike information criterion and the Schwarz Bayesian criterion, compound symmetry was the covariance structure that best fitted the model. The linear effect (Lowry, Reference Lowry1992) of melamine ingestion on a logarithmic scale was evaluated and significance was declared at P < 0.05.
Results and discussion
Performances of the method
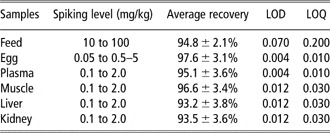
The recovery percentages were evaluated by spiking known blank samples at different levels for each matrix. The limits of detection and quantification were determined by the signal-to-noise approach, defined as those levels resulting in signal-to-noise ratios of 3 and 10, respectively. The analytical response and the chromatographic noise were both measured from the chromatogram of a blank sample extract to which an appropriate volume of standard solution had been added. The data are shown in Table 2.
Spiking level, average recovery, LOD and LOQ of melamine in different samples

LOD = limit of detection; LOQ = limit of quantification.
Melamine in feed and animal performances
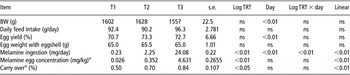
As previously reported, the European Union and FDA (EU, 2008; FDA, 2008) fixed the maximum allowable limit of melamine in food and feeds at a level of 2.5 mg/kg in order to ensure a low risk for humans. The lowest level of melamine in the diet (T1) was chosen in agreement with this limit and had a melamine diet concentration of 2.39 ± 0.05 mg/kg. Other tested diets showed a concentration ∼10- to 100-fold higher than T1, the levels of melamine being equal to 24.76 ± 0.29 and 256.37 ± 4.92 mg/kg in T2 and T3, respectively. Bai et al. (Reference Bai, Bai, Zhang, Lv, Qin, Li, Bai and Lin2010) fed hens with melamine diet concentrations from 125 to 2000 mg/kg of feed (i.e. approximately from 8.6 to 140.9 mg/kg BW, respectively). Chen et al. (Reference Chen, Yang, Wang, Peng, Li, Zhang and Gong2010) and Dong et al. (Reference Dong, Liu, Tong and Zhang2010) conducted experiments with laying hens exposed to low diet melamine contamination, from 0 to 100 mg of melamine/kg of diet. A wide range of melamine diet concentrations, ranging from 0 to 1000 mg/kg were tested by Lü et al. (Reference Lü, Yan, Guo, Li, Li and Ravindran2009) to evaluate the tissue residual melamine of broilers. Recently, Yang et al. (Reference Yang, Huangfu and Wu2011) used similar melamine concentrations by feeding laying hens with 200 or 1000 mg of melamine/kg of diet, whereas Valat et al. (Reference Valat, Marchand, Veyrand, Amelot, Burel, Eteradossi and Postollec2011) exposed animals to two melamine-contaminated diets with 50 and 500 mg of melamine/kg of diet, respectively. In our condition, no illness and death cases were recorded during the experimental period. Moreover, the ingestion of melamine-contaminated diets did not affect the BW, daily feed intake, egg weight and production (P > 0.05; Table 3). Lü et al. (Reference Lü, Yan, Guo, Li, Li and Ravindran2009) observed that feeding diet with a melamine concentration of 1 g/kg did not influence either broiler growing performance or feeding behavior. Similarly, Valat et al. (Reference Valat, Marchand, Veyrand, Amelot, Burel, Eteradossi and Postollec2011) did not observe differences in feed consumption and egg production among control and melamine-treated groups. As discussed by these authors, different reasons could be addressed for no effect on feeding behavior, yield performance and health status in hens following melamine ingestion. First, the doses tested in our work could be considered low when compared with documented cases of illness due to melamine (WHO, 2008). Second, the melamine used in this experiment was the pure form and reasonably different from what produced industrially. Lastly, even if it was considered that the absence of cyanuric acid does not minimize the toxic effect of melamine (Battaglia et al., Reference Battaglia, Cruywagen, Bertuzzi, Gallo, Moschini, Piva and Masoero2010), it can be assumed that the concomitant assumption of these two compounds could facilitate the formation of nephrotoxic crystals (Dobson et al., Reference Dobson, Motlagh, Quijano, Cambron, Baker, Pullen, Regg, Bigalow-Kern, Vennard, Fix, Reimschuessel, Overmann, Shan and Daston2008).
BW, feed consumption, egg productivity, melamine egg concentration and melamine carryover from feed to egg of laying hens fed diets contaminated at different melamine concentrations (2.39 ± 0.05, 24.76 ± 0.29 and 256.37 ± 4.92 mg/kg, respectively, for T1, T2 and T3)

aEvaluated at steady-state condition (from days 6 to 13).
Melamine in eggs
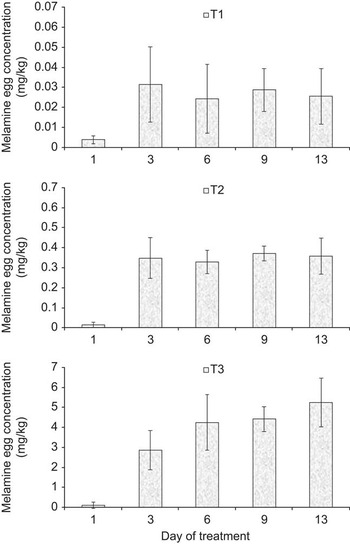
Different authors reported an indirect melamine contamination of animal products, such as milk, cheese, meat and eggs, when animals were exposed to melamine-contaminated diets (Cruywagen et al., Reference Cruywagen, Stander, Adonis and Calitz2009; Dong et al., Reference Dong, Liu, Tong and Zhang2010; Cruywagen et al., Reference Cruywagen, van de Vyver and Stander2011; Sun et al., Reference Sun, Wang, Shen and Wei2011). The existence of an excretion pattern from feed to eggs was also reported (Bai et al., Reference Bai, Bai, Zhang, Lv, Qin, Li, Bai and Lin2010; Chen et al., Reference Chen, Yang, Wang, Peng, Li, Zhang and Gong2010; Dong et al., Reference Dong, Liu, Tong and Zhang2010; Valat et al., Reference Valat, Marchand, Veyrand, Amelot, Burel, Eteradossi and Postollec2011; Yang et al., Reference Yang, Huangfu and Wu2011). Our results confirmed that melamine could be found in eggs from hens ingesting melamine-contaminated diets, also at a low-level of melamine concentration (i.e. 2.39 ± 0.05 mg/kg). The excretion pattern of melamine in eggs is shown in Figure 1. No melamine was detected in eggs of each group the day before melamine-contaminated diet administration. The melamine egg concentrations (data corrected for the recoveries percentages) increased rapidly, with melamine being detected in eggs produced on day 1 in all groups. Other authors suggested that melamine was rapidly distributed to egg (Chen et al., Reference Chen, Yang, Wang, Peng, Li, Zhang and Gong2010; Dong et al., Reference Dong, Liu, Tong and Zhang2010; Valat et al., Reference Valat, Marchand, Veyrand, Amelot, Burel, Eteradossi and Postollec2011; Yang et al., Reference Yang, Huangfu and Wu2011). On the contrary, Bai et al. (Reference Bai, Bai, Zhang, Lv, Qin, Li, Bai and Lin2010) did not detect melamine on the first day of melamine ingestion, reporting that melamine egg concentration peaked on day 2 when hens were fed diet from 8.6 to 140.9 mg of melamine/kg of BW.
Melamine excretion patterns via egg of laying hens fed diets contaminated at different melamine concentrations (2.39 ± 0.05, 24.76 ± 0.29 and 256.37 ± 4.92 mg/kg, respectively, for T1, T2 and T3).

After the first appearance, the melamine reached a steady-state condition from days 6 to 13 of the experimental period. Similar findings were observed referring to the graph data reported by Dong et al. (Reference Dong, Liu, Tong and Zhang2010), from which a day effect of melamine excretion pattern could be observed. Valat et al. (Reference Valat, Marchand, Veyrand, Amelot, Burel, Eteradossi and Postollec2011) reported that the melamine egg concentration reached a steady-state condition earlier, after 3 days of melamine ingestion, and then remained stable up to end of the experiment. On the contrary, Chen et al. (Reference Chen, Yang, Wang, Peng, Li, Zhang and Gong2010) did not report a day effect on melamine excretion pattern, suggesting that there is no accumulation for a later deposition in eggs. However, referring to tabular data reported by Chen et al. (Reference Chen, Yang, Wang, Peng, Li, Zhang and Gong2010), a similar melamine egg excretion pattern could be observed. A different trend in melamine excretion pattern was reported by Yang et al. (Reference Yang, Huangfu and Wu2011). The authors observed that the melamine in egg tended to increase from day 1 to days 18 and 19 for groups fed 200 and 1000 mg of melamine/kg of diet, respectively. Further, the melamine content of eggs decreased until the end of the melamine exposition period (day 28) by 31% and 13% (calculated on maximum melamine egg concentration) in the two groups, respectively.
The concentration of melamine at steady-state condition increased linearly (P < 0.01) with log dose (Table 3). However, only the value observed in T3 exceeded the allowed limit of melamine in food and feeds. The three levels of melamine (log dose) allow for a treatment evaluation up to a quadratic component. However, it was not considered as the number of tested treatments could lead to an expected quadratic effect.
Chen et al. (Reference Chen, Yang, Wang, Peng, Li, Zhang and Gong2010), by feeding hens at five different levels (from 0 to 100 mg/kg) for 15 days, reported that none of the tested diets caused a melamine egg concentration over the allowed limit. Moreover, the authors suggested that the melamine content of egg linearly increased with melamine diet concentration and proposed an equation to estimate egg melamine concentration starting from the diet contamination level. The proposed equation is:

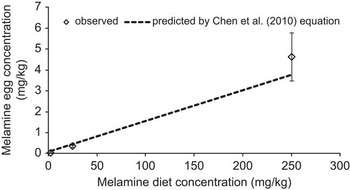
As shown in Figure 2, by applying the Chen et al. (Reference Chen, Yang, Wang, Peng, Li, Zhang and Gong2010) equation to predict melamine egg concentration (mg/kg) from tested diet contamination levels, slight overestimation and underestimation (ranging from +22.4% to −22.9% for T1 and T3, respectively) were observed when compared with values higher and lower than ∼50 mg of melamine/kg of diet. Despite the different experimental conditions, the equation proposed by Chen et al. (Reference Chen, Yang, Wang, Peng, Li, Zhang and Gong2010) could be considered to correctly predict melamine egg concentration starting from the melamine level in the diet.
Observed v. predicted by Chen et al. (Reference Chen, Yang, Wang, Peng, Li, Zhang and Gong2010) equation melamine egg concentration values.

A similar approach was used to compare data of melamine egg concentrations measured by Dong et al. (Reference Dong, Liu, Tong and Zhang2010) on day 17. Taking into account that the authors reported only the maximum level of melamine in eggs, a constant overestimation (∼35%) was observed. This suggested that the melamine excretion pattern varied among experiments and this could be because of the specific experimental conditions in which they were conducted (species, age of animals, diet composition, group composition, environmental factors, etc.).
Considering the number of eggs collected for each box, the average egg weight without the eggshell (57.9, 58.3 and 57.8 g for T1, T2 and T3; respectively) and the feed ingestion at the observed steady-state condition, it was possible to calculate the carryover of melamine from feed into egg for each box (Table 3). The log dose linearly (P < 0.05) increased the carryovers of melamine with values of 0.50, 0.70 and 0.84 for T1, T2 and T3 groups, respectively. Higher carryover values (from 1.21% to 1.41%) were reported by Dong et al. (Reference Dong, Liu, Tong and Zhang2010). The different carryover rates could be related to the different approaches used: in the present work, the carryover was evaluated at steady-state condition, whereas Dong et al. (Reference Dong, Liu, Tong and Zhang2010) measured the carryover on day 17, when the highest level of melamine in eggs occurred.
Melamine in plasma, muscle, liver and kidney
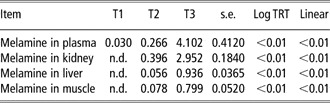
The concentrations of melamine in plasma, muscle and organs are shown in Table 4. The melamine was measured in plasma of all tested groups and increased with log dose, being 0.030, 0.266 and 4.102 mg/l, respectively, in T1, T2 and T3 (P < 0.05). No melamine was detected in kidney, liver and muscle samples from hens fed the T1 diet.
Melamine concentrations (mg/l or mg/kg) in plasma, organs and muscle of hens fed diets contaminated at different melamine concentrations (2.39 ± 0.05, 24.76 ± 0.29 and 256 ± 4.92 mg/kg, respectively, for T1, T2 and T3)

n.d., not detected (limit of detection as reported in Table 2).
For T2, the values of plasma and kidney were similar and higher than those of muscle and liver. In T3, the plasma showed the highest melamine concentration (i.e. 4.102 mg/l). As reported in Table 3, no samples of liver and breast muscles exceeded the maximum allowed limit of 2.5 mg/kg. It could be considered that the tissue concentration distributions of T2 follows the pattern: kidney > plasma > liver ⩾ muscle, and appeared similar to that reported by Bai et al. (Reference Bai, Bai, Zhang, Lv, Qin, Li, Bai and Lin2010). On the contrary, Dong et al. (Reference Dong, Liu, Tong and Zhang2010) reported lower levels in blood serum than in other tissues, whereas Valat et al. (Reference Valat, Marchand, Veyrand, Amelot, Burel, Eteradossi and Postollec2011) confirmed that the melamine content seemed to be higher in kidneys than in the liver and muscle. The tissue concentration distributions slightly differed for T3, that is, plasma > kidney > liver > muscle. This suggested that melamine absorption and metabolization could be affected by the amount of melamine ingested by animals, besides other factors, such as animals or species used in the experiment, health status and management of animals, length of melamine exposure period, source (i.e. pure or industrial) of melamine.
Lastly, our results showed that melamine concentration measured in eggs at steady-state condition could be considered similar to levels observed in plasma, being on average 0.026 v. 0.030, 0.352 v. 0.266 and 4.631 v. 4.102 mg/kg, respectively, for egg and plasma in T1, T2 and T3. Therefore, also supported by the observation reported by Dong et al. (Reference Dong, Liu, Tong and Zhang2010), the direct analysis of egg for melamine content could be useful to monitor melamine in laying hen, being a rapid way to obtain a good prediction of melamine exposure of animals and easier sampled than blood or other tissues.
Conclusions
A melamine excretion pattern from feed into egg and tissues was confirmed in laying hens, suggesting that the melamine contamination of these products should not only be related to intentional external contamination but also to the ingestion of melamine-contaminated diet. The rate of deposition in eggs was low and only the eggs from hens fed very high contaminated diet (i.e. 256 mg/kg of melamine) showed concentrations higher than 2.5 mg/kg, the upper limit currently allowed by the US FDA and the European Union in food. Thus, on the basis of our data, the risk for human health due to melamine-contaminated egg ingestion could be considered relevant only if the animals are given diets that are highly contaminated. In this study, the levels of melamine measured in plasma were similar or slightly lower than those in eggs.
Acknowledgments
The authors thank Mauro Morlacchini and Giorgio Fusconi of CeRZOO (Research and Experimental Centre) for their important assistance and advices. The study was supported by the Ce.Si.A.A. (Centro per la qualità e la sicurezza del sistema agro-alimetare), the Italian province of Lodi and the municipality of Casalpusterlengo.