




No CrossRef data available.
Mapping language changes in real time: A panel study on Finnish
Published online by Cambridge University Press: 01 July 2004
Abstract
This article is based on an extensive panel study wherein the real-time progress of several language changes was mapped over a period of ten years. Our study suggests that categorical linguistic features are inclined to remain categorical in the idiolect. If a speaker, as a child, “learns” a feature with little or no variation in it, no major changes are likely to take place during the speaker's lifetime. In other words, new changes rarely commence in an idiolect later in life. If, however, a speaker adopts a feature as a variable one, with two or more truly competing variants, it is possible that the balance of the variants will shift during the speaker's lifetime. The more equal the proportions of the rivalling variants are, the more likely it is that one of the variants will gain dominancy during the speaker's lifetime.The present study has been partially funded by the Academy of Finland. For assistance we thank the staff of the Virrat Project at the University of Tampere, Finland.
Information
- Type
- Research Article
- Information
- Copyright
- © 2004 Cambridge University Press
METHODOLOGY
Ever since the 1970's, using the apparent-time (AT) method has been a standard practice whenever ongoing language changes have been studied. The attractiveness of this method is based on the fact that the AT method enables us to make predictions of the future phases of the language change we are studying. An AT study is a synchronic comparison of different age-groups within the speech community. The resulting synchronic cross-age variation pattern is then projected into the future, thus creating a dimension of apparent diachrony. As real diachrony involves a link from the present to the past, apparent diachrony tries to reach from the present to the future (See, e.g., Labov, 1995:43–72).
So far, real-time (RT) studies on language changes have been rare. Previous RT studies on different languages have also given partly conflicting results. Most often, however, the results have supported the idea that predictions can indeed be made on the basis of AT observations. This support is evident even in the early classic by Hermann (1929), based on an earlier study by Gauchat (1905). More recent support for the AT method has been given, for example, by Cedergren (1987), Trudgill (1988), as well as Thibault and Daveluy (1989) and Thibault and Vincent (1990), the last one being based on the AT findings by D. Sankoff and G. Sankoff (1973). Previous studies on Finnish have also generally given corroboration to AT predictions (e.g., Paunonen, 1996).
One of the first RT studies was made by Brink and Lund (1979) on Danish; it was also one of the first panel studies. After that, most RT studies have been trend studies, which is why we still do not know very much about the stability of the idiolect over time. This is because, unlike in a panel study, the same informants are not recorded twice in a trend study, only the same age-groups are observed twice.
DATA
Obviously, the only way to test the credibility of AT predictions is to make observations of the same speech community at least twice, at two different points in time. If this is done by means of a panel study, it is also possible to see whether the changes have continued to advance at the individual level in the idiolects. We carried out a panel study, wherein the interval between the two points of time was 10 years. The speech community is Virrat, a small rural town in southern Finland. We gathered two corpora, the first in 1986, the second in 1996. Originally, the first corpus consisted of tape-recorded interviews of 46 informants who were divided into five age-groups (A through E). As many informants as possible in the three youngest age-groups (C, D, and E) were recorded again for the second corpus; 24 of the total 30 informants in these groups were reached. Only these 24 who we were able to record twice were included in the two corpora to represent these three age-groups, because we wanted these groups to include exactly the same informants in both corpora. For the second corpus, we also recorded 10 informants belonging to the next generation of speakers, this being the sixth age-group (F) involved in our study. In brief, the material used in our panel study is the following:1
Data from the oldest speakers (group A) will be shown with the 1986 corpus, although these informants have been recorded in the 1960's and 1970's.

The total time-span within our two corpora is 100 years (from group A to group F); this gives us a solid base to find out which variants are advancing in the community and which are regressing. By comparing the variation patterns of groups A to E in the 1986 corpus to the corresponding patterns of group F in the 1996 corpus, we can determine whether the AT predictions given by the cross-age patterning in the 1986 corpus turn out to be right or wrong in 1996. At the same time, the twice-recorded informants in groups C, D, and E shed light on the question of the stability of the idiolect over time.
The linguistic data include information on the RT developments in 10 ongoing changes. Four of these are complex changes that can be divided into several separate variables, and each of these four changes are represented by two independent variables in this study. Thus, the number of variables observed is 14.
In six variables (numbers 1–6), a new nonstandard variant is being introduced; in every case, the old variant is the same as that used in standard Finnish (StFi). In eight variables, a standard Finnish variant is advancing and trying to oust the dialectal variant. In five of these changes, an old dialectal change is being cancelled; from a diachronic point of view, an “original” variant is thus being restored (variables 7–11). In three cases, a completely new variant is arriving to the dialect from standard Finnish (variables 12–14); these variants have never been used in the dialect before.
In the following discussion, all 14 variables will be studied from the viewpoint of the StFi variant. We see this variant regressing in variables 1–6 and progressing in variables 7–14. The 14 variables are:
- The (PRON) variable. Shortening of 1st and 2nd person singular personal pronouns in the nominative case, e.g., minä > mää ‘I’, sinä > sää ‘You’.
- The (COP) variable. Shortening of the verb olla ‘to be (the copula)’ in the present tense forms of 1st and 2nd person singular, e.g., olen > oon ‘I am’, olet > oot ‘You are’.
- The (VSEQ) variable. Transformation of vowel sequences where a mid vowel (e, o, ö) is followed by a low vowel (a, ä) into long mid vowels, e.g., oikea > oikee ‘right’, ainoa > ainoo ‘only’, pimeässä > pimeessä ‘in darkness’.
- The (siCOND) variable. Loss of final -i from the conditional mode verb forms ending in -si (these are 3rd person singular forms, where -isi is the conditional mode morpheme), e.g., tulisi > tulis ‘(he) would come’, menisi > menis ‘(he) would go’.
- The (siPAST) variable. Loss of final -i from the past
tense verb forms ending in -si (these are 3rd person singular
forms, where -i is the past tense morpheme2
), e.g., pakkasi > pakkas ‘(he) packed’, tykkäsi > tykkäs ‘(he) liked’.
Even without the past tense morpheme -i, these forms do not become identical with the corresponding present tense forms.
- The (3INF) variable. Loss of the infinitive morpheme (-ma-/-mä-) from the 3rd infinitive verb forms in the illative case (infinitive morphemes are used as a link, when case endings are attached to verbal stems), e.g., juoksemaan > juokseen ‘running’, kysymään > kysyyn ‘asking’.
- The (SCHWA1) variable. Cancelling primary schwa (primary schwa brought extra vowels inside several consonant clusters), e.g., (kylmä>) kylymä > kylmä ‘cold’, (vanha>) vanaha > vanha ‘old’.
- The (SCHWA2) variable. Cancelling secondary schwa (secondary schwa was a later extension of primary schwa, inserting extra vowels within some consonant clusters that had remained intact this far), e.g., (kirja>) kirija > kirja ‘book’, (hirvi) > hirivi > hirvi ‘moose’.
- The (GEM) variable. Cancelling primary gemination (primary gemination doubled all single consonants that were preceded by a short stressed vowel and followed by a long vowel or a diphthong), e.g., (samaan>) sammaan > samaan ‘to the same’, (rakentelee>) rakentellee > rakentelee ‘(he) builds’.
- The (DIPH) variable. Cancelling the shortening of unstressed diphthongs in conditional mode verb forms (these diphthongs always end in the vowel -i, which begins the conditional mode morpheme -isi; in shortening, it was this vowel that was omitted), e.g., (antaisin>) antasin > antaisin ‘I would give’, (pyytäisit) > pyytäsit > pyytäisit ‘You would ask’.
- The (tk) variable. Cancelling the assimilation tk > kk (the assimilation was morphologically conditioned, it concerned only clusters which contained a morpheme boundary), e.g., (talotkin>) talokkin > talotkin ‘the houses, too’, (kuuletko>) kuulekko > kuuletko ‘do You hear’.
- The (Vd) variable. Substituting d for r or zero as the weak grade alternant of t after a vowel (a weak grade alternant is used if the syllable ends in a consonant), e.g., meirän or meiän > meidän ‘our’, eres or ees > edes ‘at least’.
- The (hd) variable. Substituting d for r or zero as the weak grade alternant of t after h, e.g., kahresta or kahesta > kahdesta ‘from two’, lähretään or lähetään > lähdetään ‘let's go’.
- The (ts) variable. Substituting ts for tt in certain morphemes (i.e., in morphemes where tt is diachronically derived from a voiceless dental spirant geminate), e.g., (*meθθä>) mettä > metsä ‘forest’, (*kaθθoo>) kattoo > katsoo ‘(he) looks’.
DIFFUSION IN THE SPEECH COMMUNITY
The RT diffusion of the changes within the speech community was studied in the following way. We checked whether the variation patterns of the new generation, the teen-agers of the 1996 corpus (group F), would have the structure predicted by the 1986 corpus. The prediction was considered to be “right” if group F in 1996 has a higher proportion of a variant than group E had in 1986, in a variable in which group E in 1986 had a higher proportion of that variant than group D (respectively lower proportion for group F in 1996, if E had a lower proportion than D in 1986). We used this principle mechanically, even if the differences in group averages were small.
Apparent-time prediction successful
In 10 cases out of 14, group F has a variation pattern that was predicted by the 1986 corpus. The advancing variants are more frequent in the speech of 1996 teen-agers (group F) than they were among the 1986 teenagers (group E). These variables are presented in Tables 1–10.3
Note that the numbering of the tables does not correspond directly with the numbering used in listing the variables.
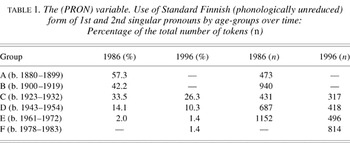
In Table 1, the StFi variant steadily regresses in the 1986 corpus. Technically, group F in the 1996 corpus meets the AT prediction, because with them the proportion of the StFi variant is even smaller than in group E 10 years earlier. In the twice-recorded idiolects, there have been, on the average, slight movements to this same direction.
The (PRON) variable. Use of Standard Finnish (phonologically unreduced) form of 1st and 2nd singular pronouns by age-groups over time: Percentage of the total number of tokens (n)

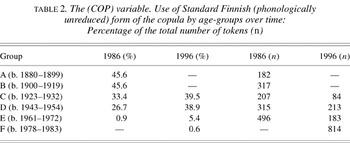
In Table 2, the StFi variant slowly declines in the 1986 corpus from group A to group D. Group E has all but rejected this variant. Technically, group F meets the AT prediction, because the proportion of this variant has continued to shrink. Somewhat suprisingly, the twice-recorded idiolects have, on the average, moved in the opposite direction, and in groups C to E the proportion of the StFi variant is slightly higher in 1996 than in 1986.
The (COP) variable. Use of Standard Finnish (phonologically unreduced) form of the copula by age-groups over time: Percentage of the total number of tokens (n)

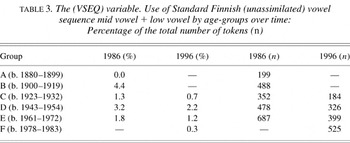
In Table 3, we see that the StFi variant is already rare in all age-groups in the 1986 corpus. Technically, group F meets the AT prediction in the 1996 corpus, wherein the twice-recorded idiolects have, on the average, also slightly moved in the same direction as group F.
The (VSEQ) variable. Use of Standard Finnish (unassimilated) vowel sequence mid vowel + low vowel by age-groups over time: Percentage of the total number of tokens (n)

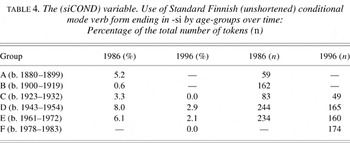
In Table 4, the StFi variant is rare in all age-groups in the 1986 corpus. Technically, group F in the 1996 corpus meets the AT prediction; in their speech there were no occurrences of the StFi variant. On the average, this same trend has continued in the twice-recorded idiolects, although the shifts have naturally been minor.
The (siCOND) variable. Use of Standard Finnish (unshortened) conditional mode verb form ending in -si by age-groups over time: Percentage of the total number of tokens (n)

In Table 5, the proportion of the StFi variant is rather small in all age-groups in the 1986 corpus. In the 1996 corpus, group F meets the AT prediction; they do not use the StFi variant at all. In the twice-recorded idiolects, too, the proportion of this variant has, on the average, become smaller.
The (siPAST) variable. Use of Standard Finnish (unshortened) past tense verb form ending in -si by age-groups over time: Percentage of the total number of tokens (n)

In Table 6, we see the StFi variant advancing in the 1986 corpus. The rate of change seems to be accelerating from group D on. Group F in the 1996 corpus has continued to take the change in the predicted direction. Idiolects in all twice-recorded groups, especially in group E, have also, on the average, moved in this direction during the 10-year period.
The (SCHWA1) variable. Use of Standard Finnish word form containing (schwaless) consonant cluster by age-groups over time: Percentage of the total number of tokens (n)

Table 7 shows that, in the 1986 corpus, the StFi variant has been declining among the three oldest age-groups (A to C), but then makes a comeback in groups D and E. In the 1996 corpus, group F has retained this direction for the change, as predicted by the AT method. The twice-recorded idiolects have, on the average, kept on moving in the direction that their age-group was going in the 1986 corpus. In group C the StFi variant has declined further, in groups D and E it has slightly advanced.
The (SCHWA2) variable. Use of Standard Finnish word forms containing (schwaless) consonant cluster by age-groups over time: Percentage of the total number of tokens (n)

Table 8 shows the phases of an exceptionally rapid language change. In the 1986 corpus, the StFi variant is almost nonexistant in group A, but then starts advancing at an increasingly rapid rate and is nearly categorical in group E. Group F in the 1996 corpus technically meets the AT prediction, because in this group the proportion of the StFi variant is even greater than in group E. The change has also, on the average, slightly advanced in the twice-recorded idiolects in groups D and E, but in group C the StFi variant has, surprisingly, declined a little.
The (GEM) variable. Use of Standard Finnish word form containing (ungeminated) single consonant by age-groups over time: Percentage of the total number of tokens (n)

Table 9 shows how the StFi variant has begun its advance toward the dialect after the oldest age-group of the 1986 corpus. The rate of change is accelerating. In the 1996 corpus, group F fulfills the AT prediction, and with this group the StFi variant is already a bit more frequent than the old dialectal variant. The twice-recorded idiolects in groups D and E have also, on the average, continued moving in this direction.
The (DIPH) variable. Use of Standard Finnish conditional mode verb form containing (unshortened) diphthong by age-groups over time: Percentage of the total number of tokens (n)

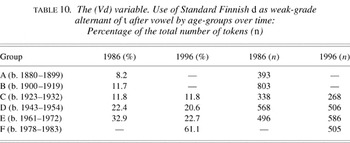
In Table 10 the StFi variant is slowly progressing in the 1986 corpus. As predicted by the AT method, group F in the 1996 corpus has taken the change further. At the same time, the rate of change has sped up considerably. In the twice-recorded idiolects, however, the change has not continued its advance. In group E it has even considerably regressed.
The (Vd) variable. Use of Standard Finnish d as weak-grade alternant of t after vowel by age-groups over time: Percentage of the total number of tokens (n)

Apparent-time prediction not successful
In four variables, the AT prediction failed (Tables 11, 12, 13, and 14). The change seems to have reversed its direction between groups E and F.
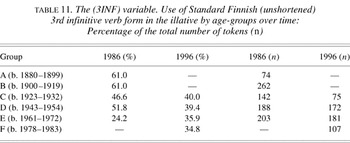
As Table 11 shows, the popularity of variants in the (3INF) variable varies considerably among the age-groups in both corpora. In the 1986 corpus, group E seems to have taken a decisive step toward ousting the StFi variant from the dialect, but in the 1996 corpus, group F has increased the proportion of that variant, thus failing to fulfill the AT prediction. This same trend can be seen in the twice-recorded idiolects of group E, as well. On the other hand, the informants of groups C and D use the StFi variant, on the average, slightly less in 1996 than they did in 1986. The progress of this change seems exceptionally complicated.
The (3INF) variable. Use of Standard Finnish (unshortened) 3rd infinitive verb form in the illative by age-groups over time: Percentage of the total number of tokens (n)

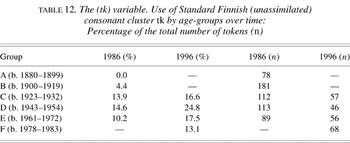
In Table 12, we see that the StFi variant has gained some foothold in groups B to E in the 1986 corpus. Technically, group F in the 1996 corpus goes against the AT prediction, because they have a slightly larger share of the StFi variant than group E in 1986. In the twice-recorded idiolects, too, the StFi variant has, on the average, become slightly more common during the 10 years. Group D is ahead of others in both corpora.
The (tk) variable. Use of Standard Finnish (unassimilated) consonant cluster tk by age-groups over time: Percentage of the total number of tokens (n)

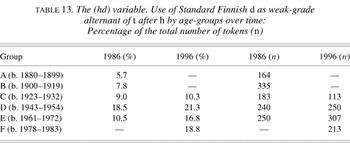
In Table 13, the StFi variant is relatively rare in all age-groups. Its proportion is highest in group D. Group F in the 1996 corpus must be interpreted as going against the AT prediction, because the StFi variant is more common in group F than it was in group E in the 1986 corpus. In spite of this unpredicted representation, we find a similar trend in the twice-recorded idiolects, which have, on the average, slightly moved in this same direction during the 10 years. As in Table 12, group D spearheads the change in both corpora, but the differences between groups are small.
The (hd) variable. Use of Standard Finnish d as weak-grade alternant of t after h by age-groups over time: Percentage of the total number of tokens (n)

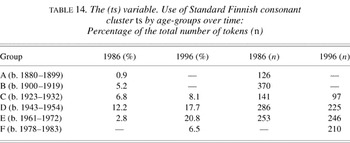
Table 14 shows a situation very similar to the phases of the (tk) variable in Table 12 and the (hd) variable in Table 13. During the 10 years separating the corpora, the StFi variant has been able to advance in the community (group F) and in the idiolects (especially in group E). This means that, technically, group F fails to meet the AT prediction, because they have a slightly higher proportion of the StFi variant than group E had in 1986. Yet the StFi variant remains rare among the youngest generation.
The (ts) variable. Use of Standard Finnish consonant cluster ts by age-groups over time: Percentage of the total number of tokens (n)

Comparison of the variables
If we look at the age-differentiation in the variables in 1986, we can divide the changes into two categories: (1) in seven cases, group E is taking the change in the same direction as group D (if we compare the proportion of the variant in groups D and C) and (2) in seven others, group E has reversed the direction of the change and is taking it in the opposite direction than group D. We call these two types “steadily advancing” and “unsteadily advancing” changes, respectively. In the first category, we place the variables in Tables 1–2 and 6, 7, 8, 9, and 10, in the second category, we place the variables in Tables 3, 4, and 5 and 11–14.
The real-time progress of changes has been very different within the two categories. All seven steadily advancing changes have kept on advancing. Group F meets the AT prediction in all of them. Of the seven unsteadily advancing changes, in only three has group F maintained the direction of the change (i.e., the variation pattern of group F fulfills the AT prediction). In four other unsteadily advanced changes, group F has reversed the direction of the change again, thus failing to meet the AT prediction. In other words, all four cases in which the prediction fails, unsteadily progressing changes are found, where we can see in the 1986 corpus group E has reversed the direction of the change (as compared with group D), and in the 1996 corpus group F has changed the direction again (as compared with group E).
Thus, we may conclude that a synchronic variation pattern, based on the differential age-distribution of the competing variants, seems to be a reliable base for an AT prediction, if the change is of the type we have here termed “steadily advancing.” So, if we find a cross-generational pattern where the change is moving in the same direction among the middle-aged and the young (here groups D and E), the AT prediction is reliable. If, on the other hand, a synchronic analysis reveals previous alterations in the direction of the change, the AT prediction is less reliable. Especially if the middle-aged and the young are taking the change in opposite directions, the AT prediction will be basically no more than a guess.
Of the four variables where the AT prediction was not met, in three cases the StFi variant had failed to advance, and in one case there was a nonstandard variant. From the (3INF) variable, we can see (Table 11) that there have been several alterations of direction, and now group F seems to have done this again. The progress of this nonstandard variant has been exceptionally unsteady in the speech community. The remaining three variables in which the AT prediction failed are more complicated cases. In variables (tk), (hd), and (ts) (Tables 12, 13, and 14) the StFi variant seemed to be advancing in 1986, but in these variables the StFi variant was most popular among the middle-aged speakers, not the young. In these, we see that the curvilinear pattern of age distribution in 1986 is repeated in 1996. In both corpora, middle-aged speakers use the new variant more than older and younger speakers.
It is possible that, in these three cases, there are no “real” changes going on at all. These may be some kind of pseudochanges, variables which have a relatively stable variation pattern, with the middle-aged speakers always having the greatest amount of the standard variant in their speech, and the variant failing to advance in the community even over time (on this subject see, e.g., Labov, 1966). In these cases, the use of standard variants could be some kind of an age-related feature for middle-aged speakers.4
A pseudochange may be transformed to a “real” change if the young start favoring this variant at some point.
It is true that the StFi variant has advanced in these three variables between the corpora, but it is still considerably less common than the rivalling nonstandard variant. Basically, it is the exceptional age-distribution of variants that raises the possibility of these being something else than normal ongoing language changes. Yet, it must be noted, that there are some reports of changes wherein a standard variant starts its infiltration into a dialect from middle-aged speakers (see Labov, 1995). The next phase of our real-time project (in 2006) will give us more information on what is really happening in these three variables.
If we interpret these three to be pseudochanges, it follows that the AT prediction based on the 1986 corpus meets 10 out of 11 variables. The only definite failure in an AT prediction comes from an unsteadily advancing nonstandard variant in the (3INF) variable.
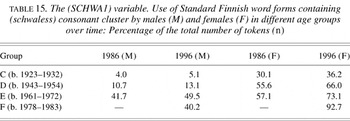
Most of the ongoing changes that we have studied here are led by women. Usually men do not lag very far behind, but the tendency is clear. Women are ahead of men in all eight changes where the StFi variant is advancing in the dialect. From the six variables in which a nonstandard variant is advancing, two changes are spearheaded by women and only one by men; in three cases, there is practically no difference between men and women. The difference between male and female speakers is greatest in two of the changes in which the StFi variant is ousting old dialectal variants: variables (SCHWA1) and (SCHWA2). Table 15 shows the variation patterns in the (SCHWA1) variable separately for male and female informants.
The (SCHWA1) variable. Use of Standard Finnish word forms containing (schwaless) consonant cluster by males (M) and females (F) in different age groups over time: Percentage of the total number of tokens (n)

DIFFUSION IN THE IDIOLECT
For each informant who was recorded twice, the variation patterns of some variables had remained stable during the 10-year interval, but some variation patterns had changed. In cases in which changes have taken place, we find an expected tendency. In 11 variables out of 14 the idiolectal patterns have, on the average, shifted in the same direction as the change has moved at the community level, that is, the same variant has advanced in the idiolects (groups C, D, and E) and in the community (group F in 1996 as compared with group E in 1986). This is generally true both in cases where group F fulfills the AT prediction and in cases where the prediction fails. In variables of the former type, the change has moved in the same direction in the idiolects and in the community in eight cases out of ten (Tables 1 and 3–9); these changes are obviously moving on fine. In the latter type, the direction has been the same in three variables out of four (Tables 12, 13, and 14); these changes seem to have confronted serious trouble.
The three exceptions are variables (COP) and (Vd), in which the advancing variant has lost its momentum—and even regressed—in the twice-recorded idiolects as a whole, although this variant has progressed as predicted in the community (see Tables 2 and 10), and the variable (3INF), in which the change has kept on advancing in many idiolects in groups C, D and E, but has unexpectedly been halted in group F.
Next, we take a general look at the amount of transitions in the idiolects of the twice-recorded informants. This concerns 24 informants, who in all had a total of 326 separate variation patterns (each pattern representing the use of one linguistic variable in one idiolect in 1986). During the 10-year period, many variation patterns remained stable. The proportion of variants was practically the same—or even identical—in both corpora. In some cases, though, the variation pattern had changed during the decade.5
As mentioned previously, generally these transitions have followed the same path that the change had taken at the community level during that period.
We do not yet have information on the limits of synchronic variation within an idiolect, that is, how different the variation pattern would possibly be between two observation sessions that were conducted, say, on consecutive days. Obviously, there is no reason to expect that the patterns would turn out completely identical every time.
Using this criterion for a noteworthy transition in a variation pattern, we find that 38.7% of all variation patterns (126 of 326) had changed during the 10-year period. This is an unexpectedly high number. What was even more surprising for us was the fact that these transitions were as common with the middle-aged informants (group D) as with the young (group E). We were prepared to see idiolectal changes with informants who were teenagers in 1986. In 1996, these speakers are adults, many with a family of their own. The relative instability of middle-aged idiolects was not actually to be expected. On the basis of these results, it seems that language changes are quite able to continue their advance even in post-adolescence, in the idiolects of middle-aged speakers. On the other hand, the idiolects of older informants (group C) turned out to be fairly stable, which was to be expected.
All in all, these results suggest that there is a point in time in which the idiolect is likely to stabilize, so that changes going on in the community are not generally able to keep on advancing in the idiolect, and the variation pattern becomes fixed. It seems, though, that this point tends to come relatively late in the speaker's life, in the later years of middle-age rather than in early post-adolescence. According to our findings, the sex of the speaker does not seem relevant in this.
It must be pointed out, however, that the criterion used for a transition in a pattern to be relevant was quantitatively rather low in our study (10% change in the proportion of a variant between the two corpora). If this limit is set higher, the idiolects obviously “become more stable.” If the quantitative limit for a major transition is 20% per variant, then only 18.4% of all variation patterns in our corpora (60 of 326) have undergone a major transition. If the limit is 30%, no more than 8.6% have changed (28 of 326). It is, of course, extremely hard to decide what would be the right quantitative criterion, because the proportion of a variant changes in a continuum from 0% to 100%. There are no cuts or markers in the continuum to indicate a transfer point from one variation pattern to another pattern in which the distribution of variants is relevantly different from the first one.
Most of the shifts that have been considered here as major shifts are cases in which either variant has increased its proportion by 10–20%. There are only a few individual variation patterns which have changed radically during the 10-year period. The nonstandard variant has managed to advance considerably in two idiolects in the (3INF) variable: by 62.5% for one middle-aged male and by 38.9% for one middle-aged female. In the (SCHWA2) variable, the StFi variant has advanced by 52.6% for one middle-aged male informant and by 37.2% for one middle-aged female informant.
DIFFUSION IN LANGUAGE
In our study, we found that between different variables there were large differences in the degree of idiolectal stability of the variation patterns. The patterns of some variables had shifted in many idiolects over the 10 years, the patterns of other variables had experienced only a few transitions. We were interested to find out what kind of variation patterns are most susceptible to change in the idiolect over the years, and what kind of patterns are most likely to remain stable. In short, we were looking for a correlation between the structure of a variation pattern and its stability in the idiolect.
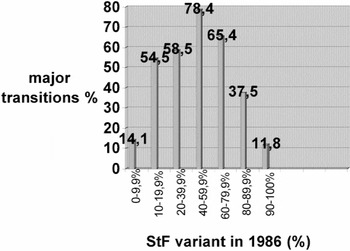
Figure 1 shows that there is at least one factor that has a considerable effect on the stability of a variation pattern in an idiolect: the amount of variation. Figure 1 presents a variation scale onto which every single variation pattern of the twice-recorded informants has been placed. The scale is constructed according to the frequency of the StFi variant in the variation patterns of the 1986 corpus. In the middle of the scale are patterns in which the StFi variant and the rivalling nonstandard variant were (almost) equally common. Variation is at its maximum here, because the two variants have equal proportions, equal frequencies in the speech of the informant (or, more precisely, that which they had in 1986). The further we move toward the right end of the scale, the more dominant the StFi variant is in the variation pattern—and the less variation there is between the variants. Toward the left end of the scale are the patterns in which the nonstandard variant becomes increasingly common. As its domination grows toward the left end of the scale, the amount of variation goes down, because now the StFi variant becomes rarer and rarer. In Figure 1, the percentages at different points in the scale show the amount of variation patterns that have undergone a major transition in 10 years. It is immediately clear that major transitions have been most common at the center of the scale, at the maximum variation zone. Almost 80% of this type of variation pattern has changed considerably between the two corpora. Moving toward both ends of the scale, we can see that of those variation patterns in which the dominant variant had a 60–80% proportion in 1986, more than 60% have changed in 10 years. If either variant was very dominant or categorical in 1986 (with a 90–100% proportion), less than 15% of the variation patterns have changed.

The amount (%) of major transitions in variation patterns of different structural types.
CONCLUSIONS
Our study suggests that categorical linguistic features are inclined to remain categorical in the idiolect. Variation patterns in which one variant is clearly dominant are also stable. If a speaker acquires a feature with little or no variation in it, no major changes are likely to take place during the speaker's lifetime. In other words, new changes rarely commence in an idiolect later in life. This gives support to the idea of generational change, that is, that language changes start when a new generation learns the language, and rarely later in the speaker's lifetime (see Labov, 1995:83–84). If, however, a speaker acquires a feature as a variable one with two (or more) truly competing variants, it is possible—even likely—that the balance of the variants will change during the speaker's lifetime. The more equal the proportions of the rivalling variants are, the more likely it is that one of the variants will increase its proportion and gain dominancy during the speaker's life. Thus, it seems that from the viewpoint of the idiolect, categorical features, as well as features with only a small amount of variation, are stable, whereas features with abundant variation are unstable. All this also gives support to the idea that the rate of a language change follows the shape of the S-curve: the phase of maximal variation is passed quickly.
As for the reliability of AT predictions, it seems that the more we know about the past phases of the change, the easier it is to determine how likely it is that the AT prediction will be fulfilled by the next generation of speakers. In some types of change the likelihood is high, in some others, the likelihood is low. (See the Appendix for a synopsis of the real-time developments for our 14 variables.)
APPENDIX

References
REFERENCES
Brink, Lars, &
Lund, Jørn.
(1979).
Social factors in the sound changes of modern Danish. In
E. Fischer-Jørgensen
et al. (eds.),
Proceedings of the 9th International Congress of Phonetic Sciences.
Copenhagen:
University of Copenhagen.
196–203.
Cedergren, Henrietta.
(1987).
The spread of language change: Verifying inferences of linguistic
diffusion. In
P. H. Lowenberg (ed.),
Language spread and language policy: Issues, implications, and case
studies.
Washington, DC:
Georgetown University Press.
45–60.
Gauchat, Louis.
(1905).
L'unité phonétique dans le patois d'une
commune. In
Festschrif Henrich Morf.
Halle:
Niemeyer.
175–232.
Hermann, E.
(1929).
Lautveränderungen in den
Individualsprachen einer Mundart.
Nachrichten der Gesellschaft der Wissenschaften zu Göttingen
phil.-hist. Klasse:
195–214.
Labov, William.
(1966).
The social stratification of English in New York City.
Washington DC:
Center for Applied Linguistics.
Labov, William.
(1995).
Principles of linguistic change. Volume 1: Internal factors.
Language in Society
20.
Oxford:
Blackwell.
Paunonen, Heikki.
(1996).
Language change in apparent time and in real time: Possessive
constructions in Helsinki colloquial Finnish. In
Samspel och variation. Språkliga studier tillägnade
Bengt Nordberg på 60-årsdagen.
Uppsala:
Uppsala Universitet.
375–386.
Sankoff, David, &
Sankoff, Gillian.
(1973).
Sample survey methods and computer assisted analysis in the study
of grammatical variation. In
R. Darnell (ed.),
Canadian languages in their social context.
Edmonton:
Linguistic Research Inc.
7–64.
Thibault, Pierrette, &
Daveluy, Michelle.
(1989).
Quelques traces du passage du temps dans le parler des
Montréalais 1971–1984.
Language Variation and Change
1:19–46.Google Scholar
Thibault, Pierrette, &
Vincent, Diane.
(1990).
Un corpus de francais parlé.
Montréal:
Recherches Sociolinguistiques.
Trudgill, Peter.
(1988).
Norwich revisited: Recent linguistic changes in an English urban
dialect.
English World-Wide
9:33–49.Google Scholar
The (PRON) variable. Use of Standard Finnish (phonologically unreduced) form of 1st and 2nd singular pronouns by age-groups over time: Percentage of the total number of tokens (n)
The (COP) variable. Use of Standard Finnish (phonologically unreduced) form of the copula by age-groups over time: Percentage of the total number of tokens (n)
The (VSEQ) variable. Use of Standard Finnish (unassimilated) vowel sequence mid vowel + low vowel by age-groups over time: Percentage of the total number of tokens (n)
The (siCOND) variable. Use of Standard Finnish (unshortened) conditional mode verb form ending in -si by age-groups over time: Percentage of the total number of tokens (n)
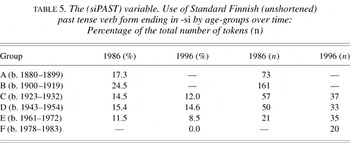
The (siPAST) variable. Use of Standard Finnish (unshortened) past tense verb form ending in -si by age-groups over time: Percentage of the total number of tokens (n)
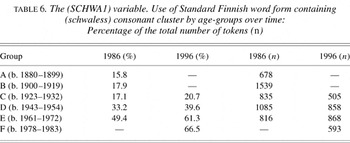
The (SCHWA1) variable. Use of Standard Finnish word form containing (schwaless) consonant cluster by age-groups over time: Percentage of the total number of tokens (n)
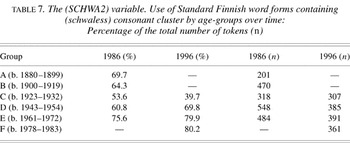
The (SCHWA2) variable. Use of Standard Finnish word forms containing (schwaless) consonant cluster by age-groups over time: Percentage of the total number of tokens (n)
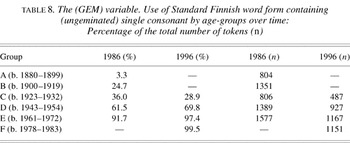
The (GEM) variable. Use of Standard Finnish word form containing (ungeminated) single consonant by age-groups over time: Percentage of the total number of tokens (n)
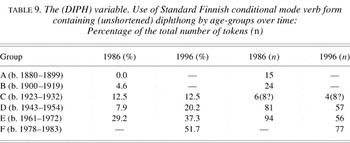
The (DIPH) variable. Use of Standard Finnish conditional mode verb form containing (unshortened) diphthong by age-groups over time: Percentage of the total number of tokens (n)
The (Vd) variable. Use of Standard Finnish d as weak-grade alternant of t after vowel by age-groups over time: Percentage of the total number of tokens (n)
The (3INF) variable. Use of Standard Finnish (unshortened) 3rd infinitive verb form in the illative by age-groups over time: Percentage of the total number of tokens (n)
The (tk) variable. Use of Standard Finnish (unassimilated) consonant cluster tk by age-groups over time: Percentage of the total number of tokens (n)
The (hd) variable. Use of Standard Finnish d as weak-grade alternant of t after h by age-groups over time: Percentage of the total number of tokens (n)
The (ts) variable. Use of Standard Finnish consonant cluster ts by age-groups over time: Percentage of the total number of tokens (n)
The (SCHWA1) variable. Use of Standard Finnish word forms containing (schwaless) consonant cluster by males (M) and females (F) in different age groups over time: Percentage of the total number of tokens (n)
The amount (%) of major transitions in variation patterns of different structural types.
 You have
Access
- 38
- Cited by