INTRODUCTION
A large number of studies have revealed that exotic species can negatively impact native species via interference or resource-driven competitive interactions (Clavero & Garcia-Berthou Reference CLAVERO and GARCIA-BERTHOU2005, Stein et al. Reference STEIN, KUTNER and ADAMS2000, reviewed in Vitousek et al. Reference VITOUSEK, DANTONIO, LOOPE and WESTBROOKS1996, Wilcove et al. Reference WILCOVE, ROTHSTEIN, DUBOW, PHILLIPS and LOSOS1998). However, if the native species are inherently sensitive to environmental factors, such as food resource levels, temperature and seasonality, as seen in many bees (Ackerman Reference ACKERMAN1983, Hingston Reference HINGSTON1998, Stone Reference STONE1994, Wolda & Roubik Reference WOLDA and ROUBIK1986), the impact of an introduced species upon native species may be difficult to characterize (Tepedino & Stanton Reference TEPEDINO and STANTON1981). One exotic species widely debated as having a negative impact on native bees and wasps is the Africanized honeybee, a hybrid between the African honeybee, Apis mellifera scutellata (Lepeletier), and the European honeybee Apis mellifera mellifera. The success of the Africanized honeybee is largely attributed to its large colony size, long-range foraging and aggressive behaviour (Kerr Reference KERR1967, Kerr et al. Reference KERR, DELRIO and BARRIONUEVO1982, Roubik Reference ROUBIK1978, Reference ROUBIK1980; Schneider et al. Reference SCHNEIDER, HOFFMAN and SMITH2004). While most studies agree that aggressive physical interactions (i.e. interference competition) do not frequently take place between Africanized honeybees and native insects during foraging (Butz-Huryn Reference BUTZ-HURYN1997, Schaffer et al. Reference SCHAFFER, ZEH, BUCHMANN, KLEINHANS, SCHAFFER and ANTRIM1983, Thorp Reference THORP and Blyth1987), much debate remains about whether Africanized honeybees negatively affect native insects via resource-driven competitive interactions (i.e. exploitation competition)(Butz-Huryn Reference BUTZ-HURYN1997, Goulson Reference GOULSON2003, Roubik & Wolda Reference ROUBIK and WOLDA2001, Schaffer et al. Reference SCHAFFER, ZEH, BUCHMANN, KLEINHANS, SCHAFFER and ANTRIM1983, Thomson Reference THOMSON2004, Reference THOMSON2006; Thorp Reference THORP and Blyth1987).
Ultimately, understanding interactions between Africanized honeybees, native bees and wasps also requires an examination of the ecological factors which mediate their foraging. Bees vary widely in their ecology (Michener Reference MICHENER1979, Reference MICHENER2000) and nest-site preferences (Potts et al. Reference POTTS, VULLIAMY, ROBERTS, O'TOOLE, DAFNI, NE'EMAN and WILLMER2005), as do wasps (Evans & West-Eberhard Reference EVANS and WEST-EBERHARD1970, Richter Reference RICHTER2000, Ross & Matthews Reference ROSS and MATTHEWS1991); thus their foraging patterns are dependent on important ecological and behavioural characteristics, including colony size and recruitment strategy. Africanized honeybees are extremely effective at recruiting colony mates to forage at high-quality resource sites (Roubik Reference ROUBIK, Spivak, Fletcher and Breed1991, Schaffer et al. Reference SCHAFFER, JENSEN, HOBBS, GUREVITCH, TODD and SCHAFFER1979). Though social bees also use recruitment strategies, they may avoid foraging at sites that are occupied by another species (i.e. meliponine bees, Johnson & Hubbell Reference JOHNSON and HUBBELL1974, Nagamitsu & Inoue Reference NAGAMITSU and INOUE1997), as may wasp species (Richter Reference RICHTER1990, Richter & Tisch Reference RICHTER and TISCH1999). Native bees and wasps that cannot tolerate intense recruitment by other species, like Africanized honeybees, may not be able to forage extensively at sites of high quality resources.
Local land management directly affects floral and nest-site availability, and a number of studies have documented decreases in native bee abundance and increases in Africanized honeybees abundance in less-forested habitats (Aizen & Feinsinger Reference AIZEN and FEINSINGER1994, Brosi et al. Reference BROSI, DAILY and EHRLICH2007, Cairns et al. Reference CAIRNS, VILLANUEVA-GUTIERREZ, KOPTUR and BRAY2005). However, few studies have attempted to quantify how local habitat composition influences bee foraging patterns. Shade-coffee agroforestry systems provide an ideal system in which to examine the impact of local habitat on native and exotic bee foraging, since coffee flowers are predominantly pollinated by both native and exotic bees (Klein et al. Reference KLEIN, STEFFAN-DEWENTER and TSCHARNTKE2003a, Reference KLEIN, CUNNINGHAM, BOS and STEFFAN-DEWENTER2008; Ricketts Reference RICKETTS2004, Roubik Reference ROUBIK2002). Additionally, shade-coffee agroforestry systems are widespread in the tropics, vary widely in their vegetation management styles, and have gained recent attention for their potential role as biodiversity refuges (Donald Reference DONALD2004, Moguel & Toledo Reference MOGUEL and TOLEDO1999, Perfecto et al. Reference PERFECTO, RICE, GREENBERG and VANDERVOORT1996). In southern Mexico, a number of coffee agroforestry regions are uniquely suited for the study of Africanized honeybee and native insect foraging. In these regions, farmers trap and manage feral Africanized honeybees and therefore maintain a controlled number of Africanized honeybee colonies within a region. In this study, we investigate the influence of a number of environmental factors on the foraging patterns of Africanized honeybees and native bees and wasps. Specifically, we examine the hypothesis that differences in vegetation management, floral resource levels and species recruiting ability, will contribute to contrasting habitat preferences and foraging patterns for native bees and wasps and exotic honeybees.
METHODS
Study site
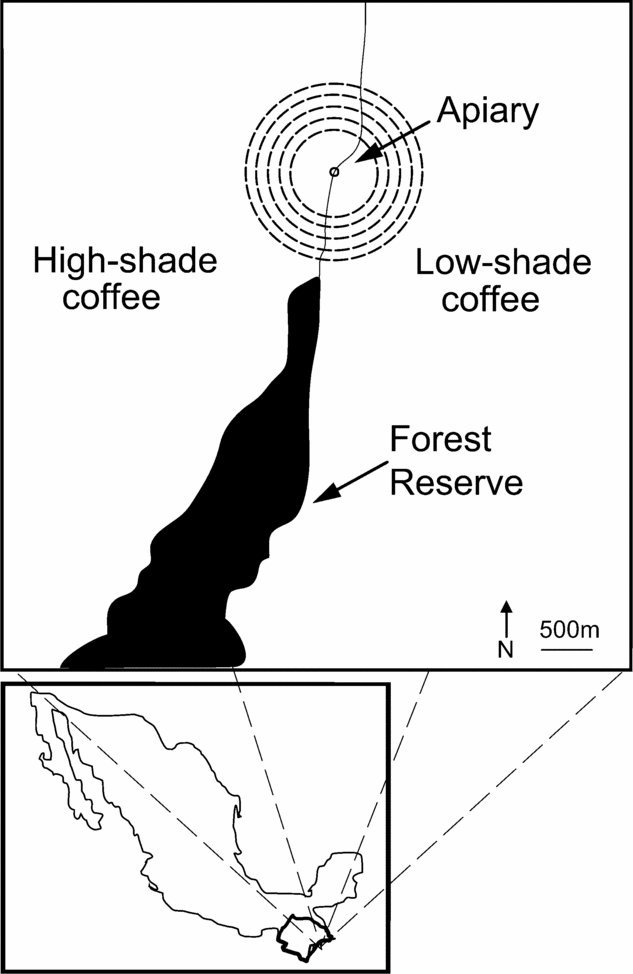
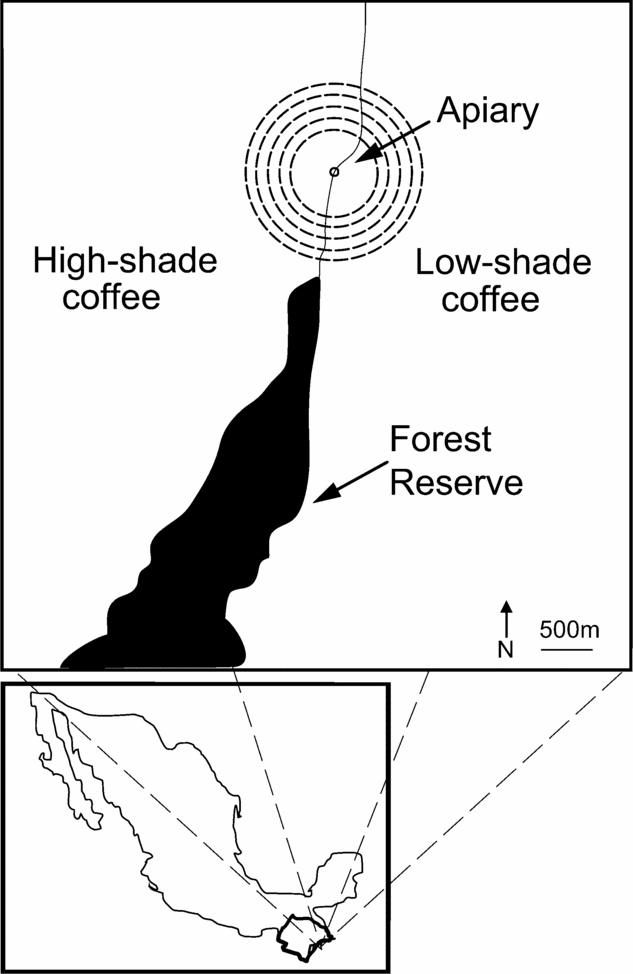
The study was conducted between 4 May and 22 June 2006, in the highlands of the Soconusco, in the state of Chiapas, Mexico (92°18′55″–92°20′24″W, 15°09′38″–15°10′48″N) at an altitude ranging between 1125 and 1300 m. The study site is composed of a low-shade coffee region, which has an average of 16.1 trees ha−1, resulting in 20–30% canopy cover, and a high-shade coffee region, which has an average of 42.3 trees ha−1, resulting in 55–65% canopy cover, and a small uncut forest reserve, La Montañita, located between the two regions (Figure 1). The two coffee regions investigated are extremely large; each is greater than 300 ha, and each equal in size to a dozen or more coffee farms typical of the Soconusco area. Also located between the two coffee regions is an Africanized honeybee apiary, which was constructed in November 2004. The apiary contains an average of 70–100 colonies and had 83 colonies at the time of the study. All nests in the apiary were obtained by trapping for feral Africanized honeybees within the two neighbouring coffee regions consistently for 3 y before this study. Throughout the 2006 experimental season, nests found within the two coffee regions were continuously trapped and added to the apiary. Few feral nests (2) were found in the coffee fields after the intensive collection between 2002 and 2005.
Map of the study region with concentric circles indicating feeder locations at 400 m, 500 m, 600 m and 800 m from the apiary, upon which nectar feeders were randomly placed in each habitat.
Bee visitation at nectar feeders
Bee foraging rates were measured for two consecutive days at high-quality-resource ‘nectar feeders’. Each nectar feeder was composed of a small 12-cm diameter dish with a 6-cm diameter foam landing platform and an inexhaustible supply of a 1:1 honey:water solution, a standard bee attractant and feeder (Johnson & Hubbell Reference JOHNSON and HUBBELL1974, Roubik Reference ROUBIK1980, Slaa Reference SLAA2003). Nectar feeders were placed in groups of three, representing a nectar-feeder site. The three feeders within a site were hung 1m off the ground in the outer branches of coffee bushes, forming a line of three dishes separated from one another by 1 m. Nectar feeder sites were selected by randomly choosing a location along a series of concentric circles located around the managed Africanized honeybee apiary at 400 m, 500 m, 600 m and 800 m away from the apiary, in both the low-shade and high-shade coffee habitats (Figure 1). Because many of the insects studied are social and employ recruitment strategies which can only be observed after an extended time period, nectar feeders were monitored for two consecutive days during peak bee and wasp foraging hours, between 08h00 and 10h00. These observations were repeated fortnightly for a total of 8 wk (four replicates per habitat). Because individual bees and wasps did not forage at the bait for more than 10–15 s (initial trials involved documentation of visit duration), the number of bees and wasps visiting each of the three nectar feeders was recorded every minute for a 10-min period. The visitation at the three nectar feeders was then averaged and summed across the 10 min. Field identifications of bees were made with reference to voucher specimens, which were identified and stored at El Colegio de la Frontera Sur, Tapachula, Mexico and the USDA bee laboratory in Logan, Utah, USA. To minimize field identification errors, morphologically similar species were grouped into single morphospecies in the field (e.g. Ceratina sp. refers to C. trimaculata, C. ignara and C. sps.).
Coffee plants were not blooming during the study season, and very few understorey herbs were in bloom over the 8-wk period. The species richness of the understorey plants located within a 10-m radius were recorded for each nectar-feeder site, and light readings were taken at the height of each feeder across the sampling dates using a digital light meter to measure incident light at 633 nm (Pocket Light Meter 840010, Technika Inc) and to assess potential effects of local vegetation and light on visitation levels. In order to measure the abundance of plants flowering for each coffee region at the beginning of the experimental season, we randomly placed six 1 × 50-m transects in each habitat, low-shade and high-shade coffee, and recorded the proportion of each transect which contained at least five flowering inflorescences per 10-m2 section (proportion with ≥ 0.5 flowering plants m−2).
Statistical analyses
To meet conditions of normality, all count data were square root-transformed and all proportions were arcsine-square root-transformed. All statistical analyses were conducted with the software R (R Development Core Team, URL http://www.r-project.org, Vienna, Austria). Visiting insects were grouped into ‘foraging group’ based on foraging strategies and origin; these foraging groups include Africanized honeybees, native social bees, native solitary bees and native solitary wasps.
To test the effect of the wet season's progression on light and flowering levels, we used a standard Analysis of Variance, ANOVA. To examine the influence of all factors on the number of visiting insects for each foraging group, we utilized an Analysis of Covariance, ANCOVA, using a non-sequential test for examining individual coefficients (also known as a Type III sum of squares test). The covariates include (1) distance from Africanized honeybee apiary, (2) local light conditions, (3) species richness of local plants in flower and (4) the week of the experiment. The fixed factors include (5) habitat (low-shade vs. high-shade coffee), (6) foraging group and (7) day of visitation (day one or day two). In this case, the ANCOVA method is the most suitable because it provides a descriptive comparison between the visitation levels in different habitats, on the different days and between foraging groups, so it can test hypotheses concerning the significant differences between these categorical variables. Also, the ANCOVA, unlike the Analysis of Variance (ANOVA), disentangles differences in the effects of the fixed factors from the covariates which change in value and unlike the analyses of deviance, the ANCOVA is based on exact F and t distributions for testing the significance of factors and covariates, also yielding measures of R2 that can be interpreted as the percentage of variance explained (Faraway Reference FARAWAY2005). The model error was independent and normally distributed.
RESULTS
Flowering plants and light levels
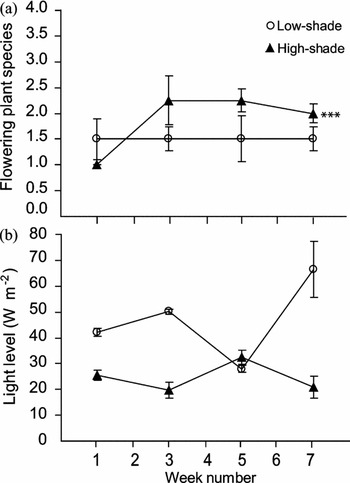
During the study, less than 2% of the understorey plant species were in flower, therefore few flowering species were recorded and most species counts represent single plants with few flowering heads. In both systems we found, Borreria laevis Lamk. (Rubiaceae), Desmodium sp. (Fabaceae), Cyperus ferax Rich. (Cyperaceae), Impatiens walleriana Hook. (Balsaminaceae), Solanum nigrum L. (Solanaceae) and Lantana camara L. (Verbenaceae) in very low abundances. The flowering plant Ipomoea sp. (Convolvulaceae) was only found in the high-shade coffee system, while Commelina diffusa Burm. (Commelinaceae) was only found in the low-shade coffee system, though both were rare. The proportion of transects with flowering plants was not significantly different between low-shade and high-shade coffee habitats (paired t-test, t10 = 10.8, P = 0.581).
Across the eight experimental weeks, there was no significant difference between the average number of plant species flowering in the low-shade coffee habitats (1.5 species per site) and the high-shade coffee habitats (1.9 species per site) (t-test, t30 = 0.53, P = 0.087). However, the average number of flowering plant species remained relatively constant over the eight experimental weeks in the low-shade coffee habitats (ANOVA, F1,30 = 0.076, P = 0.78), while the number increased between week 1 and week 3 and then remained very consistent in shade coffee habitats (ANOVA, F1,30 = 14.2, P = 0.002, Figure 2a). Light levels were low in both habitats because readings were taken in the morning at the time of visitation and week 5 observations were lower than expected due to unusual weather conditions; however, across the eight experimental weeks, light levels were significantly lower in the high-shade coffee habitats, with an average of 24.6 W m−2, than in the low-shade coffee habitats, which had an average 46.6 W m−2 (t-test, t30 = 1.67, P < 0.0001). Increases or decreases in light level across the experimental season were not significant for either the high-shade coffee habitats (ANOVA, F1,30 = 1.76, P = 0.187) or the low-shade coffee habitats (ANOVA, F1,30 = 2.36, P = 0.127, Figure 2b) and probably reflected changes in light associated with the onset of the rainy season.
Species richness of plants flowering and light levels in each habitat and across the experimental season. Mean numbers of flowering plant species across the experimental season in the low-shade and high-shade coffee habitats (a). Mean light levels (W m−2) across the experimental season in the low-shade and the high-shade coffee habitats (b). Error bars represent SE. *P < 0.05, **P < 0.01, ***P < 0.001.

Environmental and temporal effects on visitation
Africanized honeybees, native social and solitary bees and native solitary wasps were observed visiting the nectar feeders. No aggressive physical interactions were observed between individuals at the nectar feeders. Native solitary bees mostly comprised bees within the tribe Ceratinini (Xylocopinae), predominantly Ceratina trimaculata Friese and Ceratina ignara Cresson. Social bees comprised of bees with the subfamily Meliponinae (Apidae), predominantly Trigona fulviventris Guerin, Trigonisca schulthessi Friese and Plebeia frontalis Friese. Native solitary wasps visiting the nectar feeders were within the family Vespidae.
Africanized honeybees
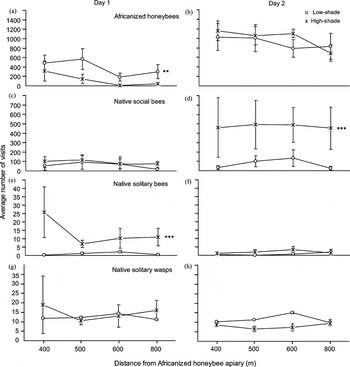
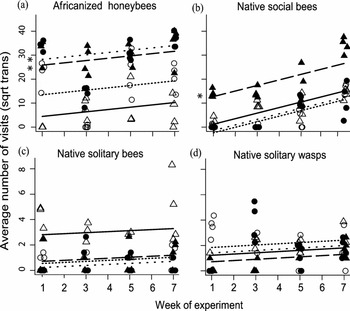
On the first day of the experiment, across all sites, Africanized honeybee visitation was significantly higher in the low-shade coffee habitats than in the high-shade coffee habitats (Figure 3a). From the first day to the second day of the experiment, Africanized honeybee visitation increased significantly in both coffee habitats (Figure 4a); however, on the second day, no significant difference in visitation was evident between coffee habitats, indicating that greater second day recruitment took place in the high-shade coffee system (Figure 3b).
Mean number of visits in the two coffee habitats on day one and day two for Africanized honeybees (a–b) native social bees (c–d) native solitary vespid wasps (e–f) and native solitary bees (g–h). Note the scale. Error bars represent SE. Codes for significant differences in between habitats: *P < 0.05, **P < 0.01, ***P < 0.001.

Bee visitation over the 8-wk experimental period for all visitor groups (a-d). Circle symbols are actual values for visitation on day one while triangle symbols are actual values for visitation on day two; unfilled symbols represent visitation in low-shade coffee, while filled symbols represent visitation in high-shade coffee. Lines are model-based regressions of visitation: solid lines represent visitation on the first day in high-shade coffee, widely dashed lines represent visitation on the second day in high-shade coffee, closely dotted lines represent visitation on the first day in low shade coffee, and widely dotted lines represent visitation on the second day in low-shade coffee. Codes for significant differences from day one to day two: *P < 0.05, **P < 0.01, ***P < 0.001.

Native social bees
On the first day of the experiment across all sites, native social bee visitation was not significantly different between high-shade and low-shade coffee habitats (Figure 3c). From the first day to the second day of the experiment, native social bee visitation increased significantly only in the high-shade coffee habitats (Figure 4b) and on the second day, visitation was also significantly higher in the high-shade coffee habitats than in the low-shade coffee habitats (Figure 3d).
Native solitary bees
On the first experimental day across all sites, native solitary bee visitation was significantly higher in the high-shade coffee habitats than the low-shade coffee habitats (Figure 3e); however, on the second day of the experiment, in the high-shade coffee habitats, native solitary bee visitation was significantly lower than the previous day (Figure 4c). On the second day of the experiment, there was also no significant difference in native solitary bee visitation between coffee habitats (Figure 3f).
Native solitary wasps
On the first day of the experiment, native solitary wasp visitation was not significantly different between the low-shade and high-shade coffee habitats across all sites (Figure 3g). Visitation did not change significantly from the first day to the second day in either coffee habitats (Figure 4d) and on the second day, native solitary wasp visitation was not significantly different between coffee habitats (Figure 3h).
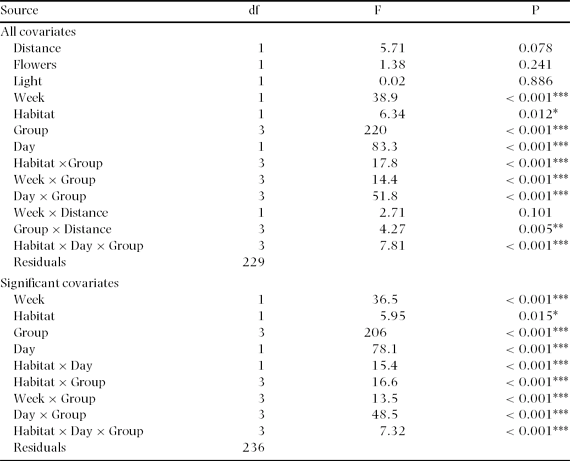
An ANCOVA revealed that foraging group type, distance from the apiary, the day of the experiment and the week of the experiment were significant variables, as were the interaction between these variables, and the adjusted R2 = 0.799 (Table 1). According to the ANCOVA, distance from the apiary significantly influenced visitation rates but the coefficient for this variable was very small (<–0.005), rendering it biologically insignificant. Backward elimination of factors within the model confirmed that light levels, flowering plants and distance from the apiary were not important variables for predicting visitation rates. The adjusted R2 = 0.796, indicating that the simplified model captures most of the variance and the most important predictor variables for visitation are habitat type, week of experiment, day of experiment and the foraging group type (Table 1). The final model is described below:

We utilized an Analysis of Covariance to measure the influence of all covariates and factors on the number of visiting insects for each foraging group. First listed are the model results for visitation rates using an ANCOVA where all relevant covariates have been included. Second listed are the model results where only significant covariates have been included. Covariates include (distance = distance to Africanized bee apiary; Flowers = species richness of blooming understorey plants; Light = light (W m−2), Week = sampling week) and all factors (Habitat = high-shade or low-shade coffee, Group = foraging group, Day = 1st or 2nd day) and relevant interaction terms.
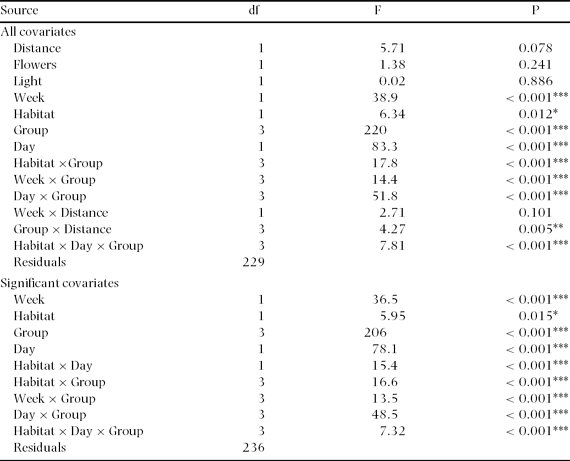
where α is habitat (i = 1, 2 for low-shade/high-shade coffee habitats), γ is visitor group (k = 1, 2, 3, 4 for Africanized honeybees, native social bees, native solitary bees and native solitary wasps, respectively), β is the day of visitation (j = 1, 2 for day one or two, respectively) and δk is the species group specific coefficient for the effect of sampling at different times. In the model, ‘week’ represents the order of the experimental week, so that the value in the model for experimental week number is 1, 3, 5 and 7. For all groups of visitors, an increase in visitation at the feeders was observed across the experimental season (Table 1, Figure 4). Native social bees exhibited the greatest increase across the experimental season, followed by Africanized honeybees, native solitary wasps and native solitary bees (Figure 4).
DISCUSSION
The tropics are full of naturally occurring resource bursts, such as the sporadic mass flowering of tropical trees and the ephemeral coffee bloom. These large floral resource bursts can have major implications on the foraging behaviour of social bees, which may have evolved recruiting strategies specifically for the exploitation of mass-flowering patches (Dornhaus & Chittka Reference DORNHAUS and CHITTKA1999, Reference DORNHAUS and CHITTKA2004; Raine et al. Reference RAINE, INGS, DORNHAUS, SALEFL and CHITTKA2006). In this study, we used nectar feeders to examine foraging levels at a simulated resource burst, and we found marked differences in foraging levels for visiting species, across time and between habitats types.
Visitation: day 1
There was significantly higher Africanized honeybee visitation in low-shade coffee habitats than high-shade coffee habitats on the first day of the experiment. This finding is in accordance with previous studies which have documented greater abundances of foraging Africanized honeybees in less-forested landscapes (Aizen & Feinsinger Reference AIZEN and FEINSINGER1994, Brosi et al. Reference BROSI, DAILY and EHRLICH2007, Cairns et al. Reference CAIRNS, VILLANUEVA-GUTIERREZ, KOPTUR and BRAY2005, Rincon et al. Reference RINCON, ROUBIK, FINEGAN, DELGADO and ZAMORA1999, Steffan-Dewenter et al. Reference STEFFAN-DEWENTER, MUNZENBERG, BURGER, THIES and TSCHARNTKE2002). Unlike Africanized honeybees, both native social and solitary bee visitation was high in high-shade coffee habitats on the first day of the experiment. In our study, most of the native solitary bees observed were in the Ceratinini, a wood-nesting tribe, thus solitary bee visitation to feeders is likely linked with wood-based nest-site availability, which is more abundant in the high-shade coffee system. Likewise, visitation of native social bees in high-shade coffee habitats is most likely due to greater nest-site availability, as many tropical social bees (especially within the Meliponinae) nest in old trees (Michener Reference MICHENER2000, Slaa Reference SLAA2003). Similar patterns of increased visitation with increased proximity to forested and semi-natural habitats have been documented in coffee agroforestry systems for native solitary and social bees in Costa Rica (Ricketts Reference RICKETTS2004), for native social bees in Indonesia (Klein et al. Reference KLEIN, STEFFAN-DEWENTER and TSCHARNTKE2003b, Reference KLEIN, STEFFAN-DEWENTER and TSCHARNTKE2006). This relationship also exists for social bees in less-forested agricultural ecosystems in Germany (Steffan-Dewenter et al. Reference STEFFAN-DEWENTER, MUNZENBERG, BURGER, THIES and TSCHARNTKE2002) and the western USA (Kim et al. Reference KIM, WILLIAMS and KREMEN2006, reviewed in Klein et al. Reference KLEIN, VAISSIERE, CANE, STEFFAN-DEWENTER, CUNNINGHAM, KREMEN and TSCHARNTKE2007, Kremen et al. Reference KREMEN, WILLIAMS and THORP2002, Reference KREMEN, WILLIAMS, BUGG, FAY and THORP2004, Reference KREMEN, WILLIAMS, AIZEN, GEMMILL-HERREN, LEBUHN, MINCKLEY, PACKER, POTTS, ROULSTON, STEFFAN-DEWENTER, VAZQUEZ, WINFREE, ADAMS, CRONE, GREENLEAF, KEITT, KLEIN, REGETZ and RICKETTS2007).
Native solitary vespid wasp visitation was not significantly influenced by habitat type. Previous studies within coffee regions have found that solitary vespid wasps in the family Eumenidae are in fact more often found nesting in the less-forested coffee plantations (Klein et al. Reference KLEIN, STEFFAN-DEWENTER and TSCHARNTKE2004, Reference KLEIN, STEFFAN-DEWENTER and TSCHARNTKE2006). These studies have suggested that wasp prey (i.e. caterpillars) is more abundant in less-forested coffee, and wasp nesting density responds strongly to prey availability. In Mexican coffee agroforestry systems, it is possible that wasp prey choice is unaffected by differing coffee management styles, but further study is necessary to examine this hypothesis.
Visitation: day 2
After 24 h had passed, Africanized honeybees and native social bees exhibited significantly higher visitation levels at the nectar feeders than the previous day. This is a reflection of the highly developed recruitment strategies utilized by honeybees (Roubik Reference ROUBIK1980, von Frisch et al. Reference VON FRISCH, WENNER and JOHNSON1967) and native social meliponine bees (Hubbell & Johnson Reference HUBBELL and JOHNSON1978, Lindauer Reference LINDAUER1971, Slaa Reference SLAA2003). Also, Africanized honeybees and meliponine bees both often support large brood sizes (Michener Reference MICHENER2000, Spivak et al. Reference SPIVAK, FLETCHER and BREED1991) and thus have greater colony-wide nectar demands. On the second day, Africanized honeybee visitation was equally high in both habitats, indicating that greater second day recruitment took place in the high-shade coffee system and that foragers had likely saturated all available sites. In contrast, for native social bees, increased visitation in later foraging bouts occurred only in high-shade habitats. Apparent habitat-mediated recruitment for native social bees may be due to greater ease in recruitment and foraging in high-shade habitats, or to greater nest site proximity. Many social bees, including Africanized honeybees and meliponines, also use scents to mark forage sites (Free & Williams Reference FREE and WILLIAMS1983, Nieh Reference NIEH2004), and more densely vegetated coffee habitats may allow for greater scent permanence.
Unlike social bees, visitation by solitary bees and wasps decreased on the second day of the experiment. Decreases in the number of foraging solitary bees and wasps are likely the result of resource competition, due to large numbers of foraging social bees. Solitary bees and wasps forage for more diverse resources (food and nest resources) and have smaller brood sizes (Michener Reference MICHENER2000, Richter & Tisch Reference RICHTER and TISCH1999), but their nectar demands cannot be satiated by a single day of foraging. Solitary bee and wasp species have high energetic needs, especially during warm wet-season months, and thus could be benefited by maintained foraging levels (Stone Reference STONE1994, Willmer & Stone Reference WILLMER and STONE2004). Intense foraging of Africanized honeybees and native social bees may prevent solitary bees from revisiting high-resource sites, leading to the significant declines in solitary bee visitation after 24 h of resource exposure.
Species richness and density of understorey plants flowering were not significantly different between habitat types and did not influence bee or wasp foraging at nectar feeders. However, we detected visitation increases for all foraging groups across the experimental period. The consistent increase in bee and wasp visitation is best explained by decreasing regional ambient floral resource availability during the late wet-season months. In the highlands of Mexico, there is a peak in native tree flowering from mid-April to early June, followed by a decline in floral resource availability (Bullock & Solis-Magallanes Reference BULLOCK and SOLIS-MAGALLANES1990, Croat Reference CROAT1978, Foster Reference FOSTER, Leigh, Rand and Windsor1982), which leads bees and wasps to forage more extensively at feeders during this time period.
CONCLUSIONS
Though we did not observe any physical competitive interactions between Africanized honeybees and native bees and wasps, our results suggest that marked decreases in native solitary bee visitation may be due to high numbers of Africanized honeybees foraging at resource sites. Previous studies have suggested that competitive interactions between bee foraging groups would be more common for similarly recruiting social bees (Schaffer et al. Reference SCHAFFER, JENSEN, HOBBS, GUREVITCH, TODD and SCHAFFER1979), and only social bees have been documented to exhibit foraging shifts in order to avoid competition with the Africanized honeybee (Roubik Reference ROUBIK1980, Reference ROUBIK1986). Alternatively, in our study, native social bees exhibited extensive recruitment-based foraging in high-shade habitats, undeterred by the presence of Africanized honeybees. Findings from this study reveal that visitation levels for bees and wasps depend both on habitat composition and the duration of resource availability, and both factors must be considered in the interpretation of native and exotic species' foraging.
ACKNOWLEDGEMENTS
We would like to thank Luis Fernando Chavez, Beverly Rathcke, Ivette Perfecto, Mike Reiskind, Exzequel Velasquez, the Vandermeer lab group, the Rathcke lab group and the Perfecto lab group at the University of Michigan. We would also like to thank Terry Griswold and Olivia Messenger at the USDA Bee Lab in Logan, Utah, for help with bee identifications. Finally, we would like to express our gratitude to the people of Finca Irlanda and Finca Hamburgo for their permission and assistance in conducting this study. All experiments conducted were in compliance with current laws governing biodiversity protection in Mexico.