

The growth of welfare spending has become one of the most controversial and criticized elements of Barack Obama’s presidency. Federal outlays for means-tested social programs increased 32% in Obama’s first term, from $563 billion in 2008 to $745 billion in 2012 (Congressional Research Service 2012). Despite the decline in the official unemployment rate from 9.6% in 2009 to 7.8% in 2013, the percentage of Americans participating in the US Department of Agriculture (USDA) Supplemental Nutritional Assistance Program (SNAP, formerly “food stamps”) grew from 10.9% to 15% during the same period. Former Speaker of the House and 2008 presidential candidate Newt Gingrich, echoing Republicans’ frustration with growing entitlement spending, quipped that Obama would be remembered as the “food-stamp president.”
To what degree does the significant growth of programs such as SNAP represent a transformation of welfare policy during Obama’s presidency? Several questions guide this research. First, how much of the expansion in the rolls of programs such as SNAP and cell-phone subsidies (i.e., the Federal Lifeline Program) is attributable to economic factors and the “snowball effect” of relaxation of eligibility criteria? Second, do empirical models of SNAP participation support the thesis that the drop in the labor-participation rate expands welfare participation? Third, which other socioeconomic factors (e.g., the poverty rate) explain the surge in SNAP recipients?
This analysis posits that the Obama administration did not create new welfare programs but rather expanded extant programs at the margins. The jettisoning of Clinton-era work requirements and the USDA’s outreach programs likely punctuated participation more dramatically than might otherwise have been the case. However, “categorical-eligibility” criteria that guide federal, state, and shared programs are at least equally responsible for the growth in some means-tested program participation after the passage of the economic stimulus package by Congress in 2009.
SNAP DURING THE OBAMA PRESIDENCY
President Obama’s stimulus package, the American Recovery and Reinvestment Act of 2009 (ARRA), significantly expanded SNAP spending. According to the USDA, ARRA increased benefits to participants by 15%, which “not only boosted the purchasing power of recipients for nutritious foods but also helped stimulate the economy” (Economic Research Service, USDA n.d.,). Passage of ARRA by the Democratic majority in Congress provided an additional $19.9 billion over five years for increased SNAP spending, doled out $295 million to the states for “administrative costs,” and suspended time limits on benefits for the unemployed. ARRA deferred the rule that able-bodied adults without dependents either seek or engage in work from April 2009 through September 2010; during the next three years, more than 40 states extended such waivers to these individuals for “lack of sufficient jobs” (Aussenberg Reference Aussenberg2014, 11). Furthermore, Falk and Aussenberg (Reference Falk and Aussenberg2014) contend that eligibility for SNAP has been expanded in other ways, as follows:
As of July 21, 2014, 43 jurisdictions have implemented what the U.S. Department of Agriculture has called “broad-based” categorical eligibility. These jurisdictions generally make all households with incomes below a state-determined income threshold eligible for SNAP. States do this by providing households with a low-cost TANF-funded benefit or service such as a brochure or referral to an “800” number telephone hotline.
The Carleson Center for Welfare Reform (n.d.) posits that SNAP is “now the fourth largest means-tested program for low-income individuals, just behind Medicaid, the Earned Income Tax Credit (EITC), and the Supplemental Security Income (SSI) program.”
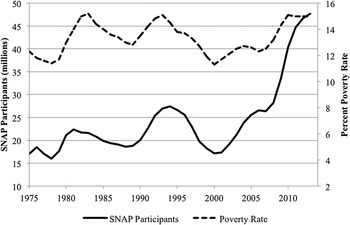
The sharp growth in the number of participants in SNAP during the Obama presidency is evident in figure 1. The data show the addition of 14 million new participants in SNAP from 2009 to 2013 (left y-axis). The poverty rate (right y-axis) correlates significantly with participation levels (r = 0.76) over time. The poverty rate in Obama’s presidency remained steady between 14.3% and 15.1% from 2009 to 2013, yet the percentage of the US population participating in SNAP grew by 5.74%. The data suggest that although poverty has become more deeply rooted in recent years, a growing proportion of those in poverty have availed themselves of this form of government assistance. Indeed, the Obama administration sought to maximize the number of Americans participating in SNAP, going so far as to “market” the program via radio advertisements targeted not only to those struggling in the middle class but also to “the elderly, working poor, the unemployed, and Hispanics” (Lubhy Reference Lubhy2012).
The poverty rate in Obama’s presidency remained steady between 14.3% and 15.1% from 2009 to 2013, yet the percentage of the US population participating in SNAP grew by 5.74%.
SNAP Participation and the Poverty Rate, 1975–2013

Some scholars contend that the significant uptick in SNAP participation is a vital instrument to aid those most affected by the state of the economy and a temporary phenomenon about which no one should be concerned. The Center for Budget and Policy Priorities (CBPP 2014) asserted that “Among SNAP households with at least one working-age, non-disabled adult, more than half work while receiving SNAP—and more than 80% work in the year prior to or the year after receiving SNAP.” Furthermore, CBPP claimed not only that those who have exhausted unemployment benefits have turned to SNAP but also that “The number of SNAP households that have earnings while participating in SNAP has more than tripled…[and] many people have turned to SNAP because of under-employment” when their hours were cut or one worker in a two-parent family lost a job (CBPP 2014).
CBPP cites a Congressional Budget Office forecast that maintains that federal spending for SNAP will diminish to 1996 levels—the year that President Clinton signed welfare reform—by 2019. CBPP’s projection of future decreases in SNAP participation is at odds with other official forecasts. Full-time job opportunities are scarce. Bureau of Labor Statistics (BLS 2014) data show that in November 2014, 6.9 million Americans “who would have preferred full-time employment were working part time because their hours had been cut back or because they were unable to find a full-time job.” Furthermore, BLS (2013) predicted that “during the 2012–2022 period, the growth of the labor force is anticipated to be due entirely to population growth, as the overall labor-force participation rate is expected to decrease from 63.7% in 2012 to 61.6% in 2022.” As the next section elucidates, labor-participation rates are intricately tied to SNAP participation.
MODELING SNAP PARTICIPATION ACROSS TIME
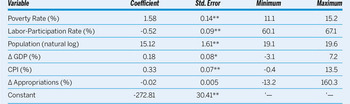
The construction of an econometric model to capture the parameters of growth and decline in SNAP participation over time is challenging due to serial correlation in time-series data and issues of endogeneity. The model presented in table 1 uses the percentage of the US population participating in the program as the dependent variable from 1970 to 2013. The model used is a two-stage least squares regression with two lags in which the poverty rate is instrumented by annual unemployment (%) and annual median-income change. The explanatory variables include the labor-participation rate, population (natural log), change in gross domestic product (GDP), Consumer Price Index (CPI, or inflation), and percent change in adjusted annual appropriations for SNAP (base = 2012). SNAP participation rates were obtained from the USDA Economic Research Division. Population data are from the US Census, including current population surveys. All other data were obtained from the BLS.
Two-Stage Least Squares Regression Analysis of SNAP Participation, 1970–2013

Notes: N = 43; R2 = 0.86; **p <0.001; *p <0.01.
Sargan statistic for overidentification of instruments = 1.55; p = 0.21.
Dependent variable is the percentage of the US population participating in SNAP.
Poverty rate instrumented = annual unemployment rate (%) and change in median income (%).
Other than the obvious impact of higher levels of poverty on SNAP recipients, the model results reported in table 1 place into sharp relief the impact of the labor-participation rate on the reach of this federal benefit. The negative slope for the labor-participation rate underscores that the percentage of Americans on SNAP drops as more able-bodied individuals are in the workforce. An increase of 1.92% in labor-force participation lowers the number of SNAP recipients by a full percentage point of the population. From 2009 to 2013, however, the labor-participation rate fell from 65.4% to 63.25%. The model predicts that this decline of 2.15% translates into approximately 6.8 million more Americans on SNAP by 2013.
For the Obama presidency thus far, the declining labor-participation rate has had the most profound effect in growing the SNAP rolls along with ARRA’s generous increase in benefits. As discussed previously, BLS estimates that the workforce will shrink nearly two more percentage points to 61.6% by 2022. The model forecasts that another two-percentage-point drop in the number of able-bodied workers who shun work or cannot find work—based on US Census population estimates during the next decade—alone will steadily drive up SNAP participation by 6.3 million in the coming years.
SNAP participation is highly sensitive to poverty rates. The model predicts that the growth in the poverty rate from 14.3% in 2009 to a steady, flat rate of 15% each following year through 2013 accounts for approximately 3.5 million more SNAP recipients. The model shows, counterintuitively, that higher GDP rates are positively related to SNAP participation, as is inflation. Fluctuations in congressional appropriations are insignificant.
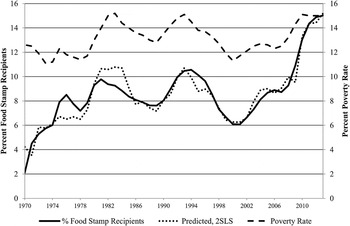
Figure 2 shows the percentage of the US population participating in SNAP, the model prediction, and the poverty rate. Two trends in the data are notable. First, the two-stage least squares model’s predictions closely track actual SNAP participation. Second, 2013 marks the approximate convergence of the percentage of Americans participating in SNAP and the poverty rate: one in six. The model error is slight for the final point in the time series, over-predicting by 0.17%. One straightforward interpretation is that broad-based categorical-eligibility requirements have dramatically increased the participation of Americans below the poverty line taking part in SNAP. That conclusion is borne out in county-level data from USDA, which showed that program participation in SNAP among those below the poverty line increased from a factor of 0.716 in 2007 to 0.933 in 2010 (i.e., the most recent data available).
Actual and Predicted SNAP Participation Rates versus Poverty Rate, 1970–2013

“OBAMA PHONES” AND CATEGORICAL ELIGIBILITY
The myth of “Obama phones” began circulating on the Internet during the 2012 election and persists today. An amateur video from a Cleveland political rally that went “viral” on social media (Youtube.com 2012) claimed that the president was handing out free cell phones. To this day, an Internet search of “Obama phone” and “free government cell phone” yields dozens of advertisements from a score of companies touting a free cell phone for qualified individuals, free minutes, and unlimited text messaging per month, with various attributions to the nation’s 44th chief executive.
However, President Obama did not start the program that subsidizes low-income individuals’ access to cell phones any more than he created SNAP. There is no governmental program called “Obama phone.” The program in question is Lifeline, a federal effort that began in 1985 to enhance access to telecommunications and was expanded in 1996 to ensure households’ access to emergency services. In 2005, the Federal Communications Commission (FCC) made discounts available to qualifying low-income consumers on prepaid wireless (i.e., mobile) telephones (FCC n.d.), and the program was expanded in 2008 to include subsidy amounts up to $9.25 per month. To qualify, people must be at or below 135% of the federal poverty line or they may automatically qualify by participating in any number of assistance programs, including SNAP, Medicaid, Temporary Assistance to Needy Families (TANF), SSI, and a panoply of other federal and state programs (FCC n.d.).
The participation rate skyrocketed from 2009 to 2012, almost doubling from 7.6 million to a high point of 13.3 million. Costs also increased twofold during the same period, from slightly less than $1 billion to more than $2.1 billion (nonadjusted dollars). The tailing off of 2.5 million subscribers in 2013 was related to FCC investigations into rampant fraud by cellular providers that contracted with subscribers without verifying eligibility as well as by recipients who violated the one-phone-per-household rule (Tumulty Reference Tumulty2013).
The relaxation of criteria for programs such as SNAP that qualifies individuals for one program has resulted in a dramatic increase in those taking advantage of other benefits for which they became eligible across the landscape of federal antipoverty programs.
The enlargement of the federal Lifeline program is an exemplar of the ways in which entitlement programs grew during the Obama presidency. The relaxation of criteria for programs such as SNAP that qualifies individuals for one program has resulted in a dramatic increase in those taking advantage of other benefits for which they became eligible across the landscape of federal antipoverty programs. This artifact of the increase in welfare participation was not always purposeful on the part of the Obama administration but rather was the result of “broad-based categorical eligibility” implemented by the states.
THE OBAMA PRESIDENCY AND THE WELFARE STATE: A MIXED LEGACY AND UNCERTAIN TRAJECTORY
Scholars, pundits, and voters disagree on the long-term implications of changes in the welfare state during the Obama presidency. This analysis emphasizes the intersection of the decline in the labor-participation rate, steady poverty levels, and broad-based categorical-eligibility criteria as central factors. It is impossible to measure empirically how Obama administration outreach increased participation in welfare programs, although such efforts indubitably played at least a marginal role.
Critics charge that expanded eligibility, increased benefits, and the elimination of work requirements (or the mandate to search for work) raise the specter, as Alabama Senator Jeff Sessions contended, of disincentives for welfare participants to reenter the job market (Reference SessionsSessions n.d.). The rosy picture of an unemployment rate that is currently below 5% contrasts significantly with the continuing and forecasted decline in the labor-participation rate, which plays an important role in SNAP participation. Conversely, ARRA shored up the states’ ability to provide crucial benefits during the worst economic calamity since the Great Depression. More than a third of SNAP beneficiaries are children.
Two debates that are likely to succeed the Obama presidency regard fraud and long-term dependency. A report by the Government Accountability Office in 2014 found evidence that 73% of households in 11 states abused SNAP, from illegally exchanging benefits for cash to nonfood purchases, including homes. States, which administer SNAP, have neither the budgets nor the enforcement mechanisms in place to combat fraud effectively. In terms of dependency, the US Department of Health and Human Services (DHHS 2013) reported to Congress in the latest Survey of Income and Program Participation (SIPP) that 36.8% of respondents participating in SNAP had received benefits for “greater than 20 months”; however, the survey noted that the “actual spell lengths for spells that lasted more than 20 months cannot be observed” (DHHS 2013, SIPP II-25).
The Obama presidency does not represent “runaway welfare-state–building” or a fundamental transformation of antipoverty programs. Rather, the spike in participation in programs such as SNAP represents a type of “punctuated equilibrium” (Baumgartner and Jones Reference Baumgartner and Jones1993) related to the economic downturn in 2008. The future trajectory of welfare spending and program participation likely will depend on whether President Obama’s successor can deliver a new economic prosperity sufficient to significantly increase the labor-participation rate. The success or failure of the next chief executive on that account in many ways will shape Obama’s legacy on the growth of entitlements as either a temporary and essential expediency or the foundation of a more permanent trend of heightened dependency on government assistance linked to changing social and economic forces.