





Food insecurity is a key indicator of well-being in the USA, affecting more than 47 million individuals in 2023(Reference Rabbitt, Reed-Jones and Hales1). It is commonly defined as a household-level economic and social condition of limited or uncertain access to adequate food, including limited or uncertain availability of nutritionally adequate and safe foods and/or limited ability to acquire acceptable foods in socially acceptable ways(Reference Gundersen and Ziliak2). Food insecurity is associated with worse physical and mental health outcomes, higher healthcare costs and increased risk of chronic disease(Reference Berkowitz, Seligman and Meigs3,Reference Gundersen and Ziliak4) .
An extensive body of literature has emerged detailing the determinants of food insecurity. A non-exhaustive set of factors associated with higher probabilities of food insecurity includes, for example, lower household income and poverty(Reference Rabbitt, Reed-Jones and Hales1), unemployment(Reference Berkowitz, Seligman and Palakshappa5), disability status(Reference Charnes6,Reference Henly, Brucker and Coleman-Jensen7) , autism(Reference Karpur, Vasudevan and Lello8), mental health challenges(Reference Jensen, Kreider and Pepper9), depression(Reference Meshkat, Pang and Tassone10), negative macroeconomic shocks(Reference Cho, Kreider and Winters11), lower levels of Medicaid eligibility(Reference Moellman and Vaughn12), receipt of social assistance as a child(Reference Corman, Dave and Schwartz-Soicher13), expansions in child tax credits(Reference Pilkauskas, Michelmore and Kovski14), lower financial management skills(Reference Białowolski, Cwynar and Weziak-Bialowolska15,Reference Millimet, McDonough and Fomby16) , lower executive functioning(Reference Skinner, Moore and Keller17), being a young adult not in college(Reference Gundersen18), seniors living with grandchildren(Reference Butcher, Schmidt and Shore-Sheppard19) and having a history of incarceration(Reference Jordan and Sneed20). Among these factors, poverty has been found to be the most consistently replicable correlative factor. Research has identified that food insecurity is predominantly experienced by households whose incomes are below or near the federal poverty threshold, and disparities by poverty status persist even after accounting for other household characteristics(Reference Gundersen and Ziliak2,Reference Berning, Bonanno and Cleary21,Reference Chen, Wu and Jin22) . This empirical regularity provides a natural bridge to the question of whether poverty should be conceptualised not only as a current snapshot but also as a cumulative, longer-run exposure.
The federal poverty level is the annual income threshold used by the federal government to determine whether a household is ‘in poverty’. The thresholds vary according to household size and, for official guidelines, state group (forty-eight contiguous states and the District of Columbia, Alaska and Hawaii). For context, the poverty line in 2025 was $15 650 for a one-person household(23), and the official poverty definition corresponded to an annual income of $32 150 for a family of four in 2025(23). Income is often expressed as a percentage of federal poverty level, and widely used cut points include 130 % and 185 % of federal poverty level, which align with eligibility and benefit tiers in major nutrition programmes such as school meals(Reference Poblacion, Cook and Ettinger de Cuba24,Reference Sharma and Sharma25) .
Recent longitudinal studies have begun to characterise how food insecurity and economic hardship evolve over time. Utilising repeated-measures data from the Panel Study of Income Dynamics (PSID) and the Current Population Survey Food Security Supplement, researchers have documented substantial churn, defined as the entry and exit of households from food insecurity. These studies further demonstrate that a non-trivial portion of households shared recurrent or chronic food insecurity, highlighting the persistent nature of economic hardship for some populations(Reference Keister, Gibson-Davis and Gennetian26–Reference Lee, Barrett and Hoddinott29). As indicated by related research, there is a stronger correlation between ongoing resource scarcity, characterised by persistent low income and limited assets/wealth, and food insecurity in comparison to transient economic decline(Reference Chen, Wu and Jin22,Reference Keister, Gibson-Davis and Gennetian26,Reference Lee, Barrett and Hoddinott29) . Concurrently, these studies predominantly conceptualise poverty duration as a household-level experience; they are not designed to identify whether the persistence of poverty as a place-based, neighbourhood condition shapes food insecurity risk beyond contemporaneous poverty rates.
From a theoretical standpoint, the duration of poverty at the neighbourhood scale may represent a distinct exposure from current poverty rates. The consequences of prolonged exposure to concentrated poverty can manifest as cumulative disadvantage, characterised by pervasive underinvestment in local infrastructure and commercial activity. This phenomenon, known as ‘retailer redlining’, entails a diminution in full-service grocery options, leading to an increased reliance on limited-service retailers(Reference Shannon30). The issue of Persistent Poverty is intricately linked to spatial segregation and historical disinvestment, both of which have the capacity to influence the contemporary neighbourhood opportunity structure. This encompasses the distribution of food retailers and the availability of services that serve to provide households with a degree of protection against short-term economic shocks(Reference Linde, Walker and Campbell31,Reference Yankey, Lee and Gardenhire32) . Importantly, these structural deficits may persist even after poverty rates decline, meaning that current poverty rates alone may systematically underestimate food insecurity risk in communities with long histories of economic hardship. Over time, these processes may erode local institutional capacity and social infrastructure, such as community organisations, informal support networks and municipal services, reduce resilience and increase the likelihood that households experience food insecurity even when their current poverty status is similar to households living in less persistently poor places(Reference Shannon30–Reference Yankey, Lee and Gardenhire32).
What has not been examined, however, is the relationship between long-term, place-based poverty and food insecurity at the census tract level across the USA. While prior work has largely focused on poverty spells experienced by individuals or households, communities facing Persistent Poverty, often defined as places where 20 % or more of residents have lived below the poverty line for roughly three decades(Reference Benson, Bishaw and Glassman33), have been linked to poorer population health, including higher mortality risk, lower life expectancy and worse cancer outcomes(Reference Benson, Bishaw and Glassman33–Reference Moss, Pinto and Srinivasan37). These patterns may suggest that long-run structural disadvantage may shape local conditions in ways that are relevant for understanding geographic variation in food insecurity. This study expands the literature on the determinants of food insecurity by considering whether long-term poverty exposure provides additional explanatory insight into food insecurity risk at the census tract level. We do so using census tract-level data from the US Department of Agriculture Economic Research Service’s (USDA ERS)(38) long-term poverty designations, which capture historical disadvantage and place-based deprivation that may confer additional risk not reflected in current poverty rates alone.
Understanding whether long-term poverty is associated with food insecurity has meaningful practical implications. In the event of communities experiencing prolonged periods of concentrated poverty being faced with a heightened food insecurity risk, which extends beyond that captured by prevailing poverty rates, a focus on contemporary economic indicators in the delivery of food assistance and nutrition interventions may prove inherently fallible in identifying the most at-risk areas. The employment of duration-sensitive poverty measures has the potential to provide federal, state and local policymakers with a more precise tool for identifying communities in need, directing resources towards areas where structural disadvantage has accumulated over generations rather than responding only to immediate economic conditions.
Methods
Study design
This cross-sectional study examines the association between long-term poverty and modelled food insecurity at the census tract level across the USA. Census tracts are small geographic units designated to contain approximately 1200–8000 residents. Although tract shapes and sizes vary, they provide a consistent unit for examining neighbourhood-level factors. Specifically, we assess the USDA’s tract-level designations of Persistent Poverty Since 1990, Enduring Poverty Since 1980 and Enduring Poverty Since 1970 in relation to tract-level food insecurity estimates, adjusting for rurality using USDA Rural-Urban Commuting Area (RUCA) codes. These poverty duration measures are analysed under two analytic frameworks, an inclusive framework and a mutually exclusive framework, as described below.
Data sources
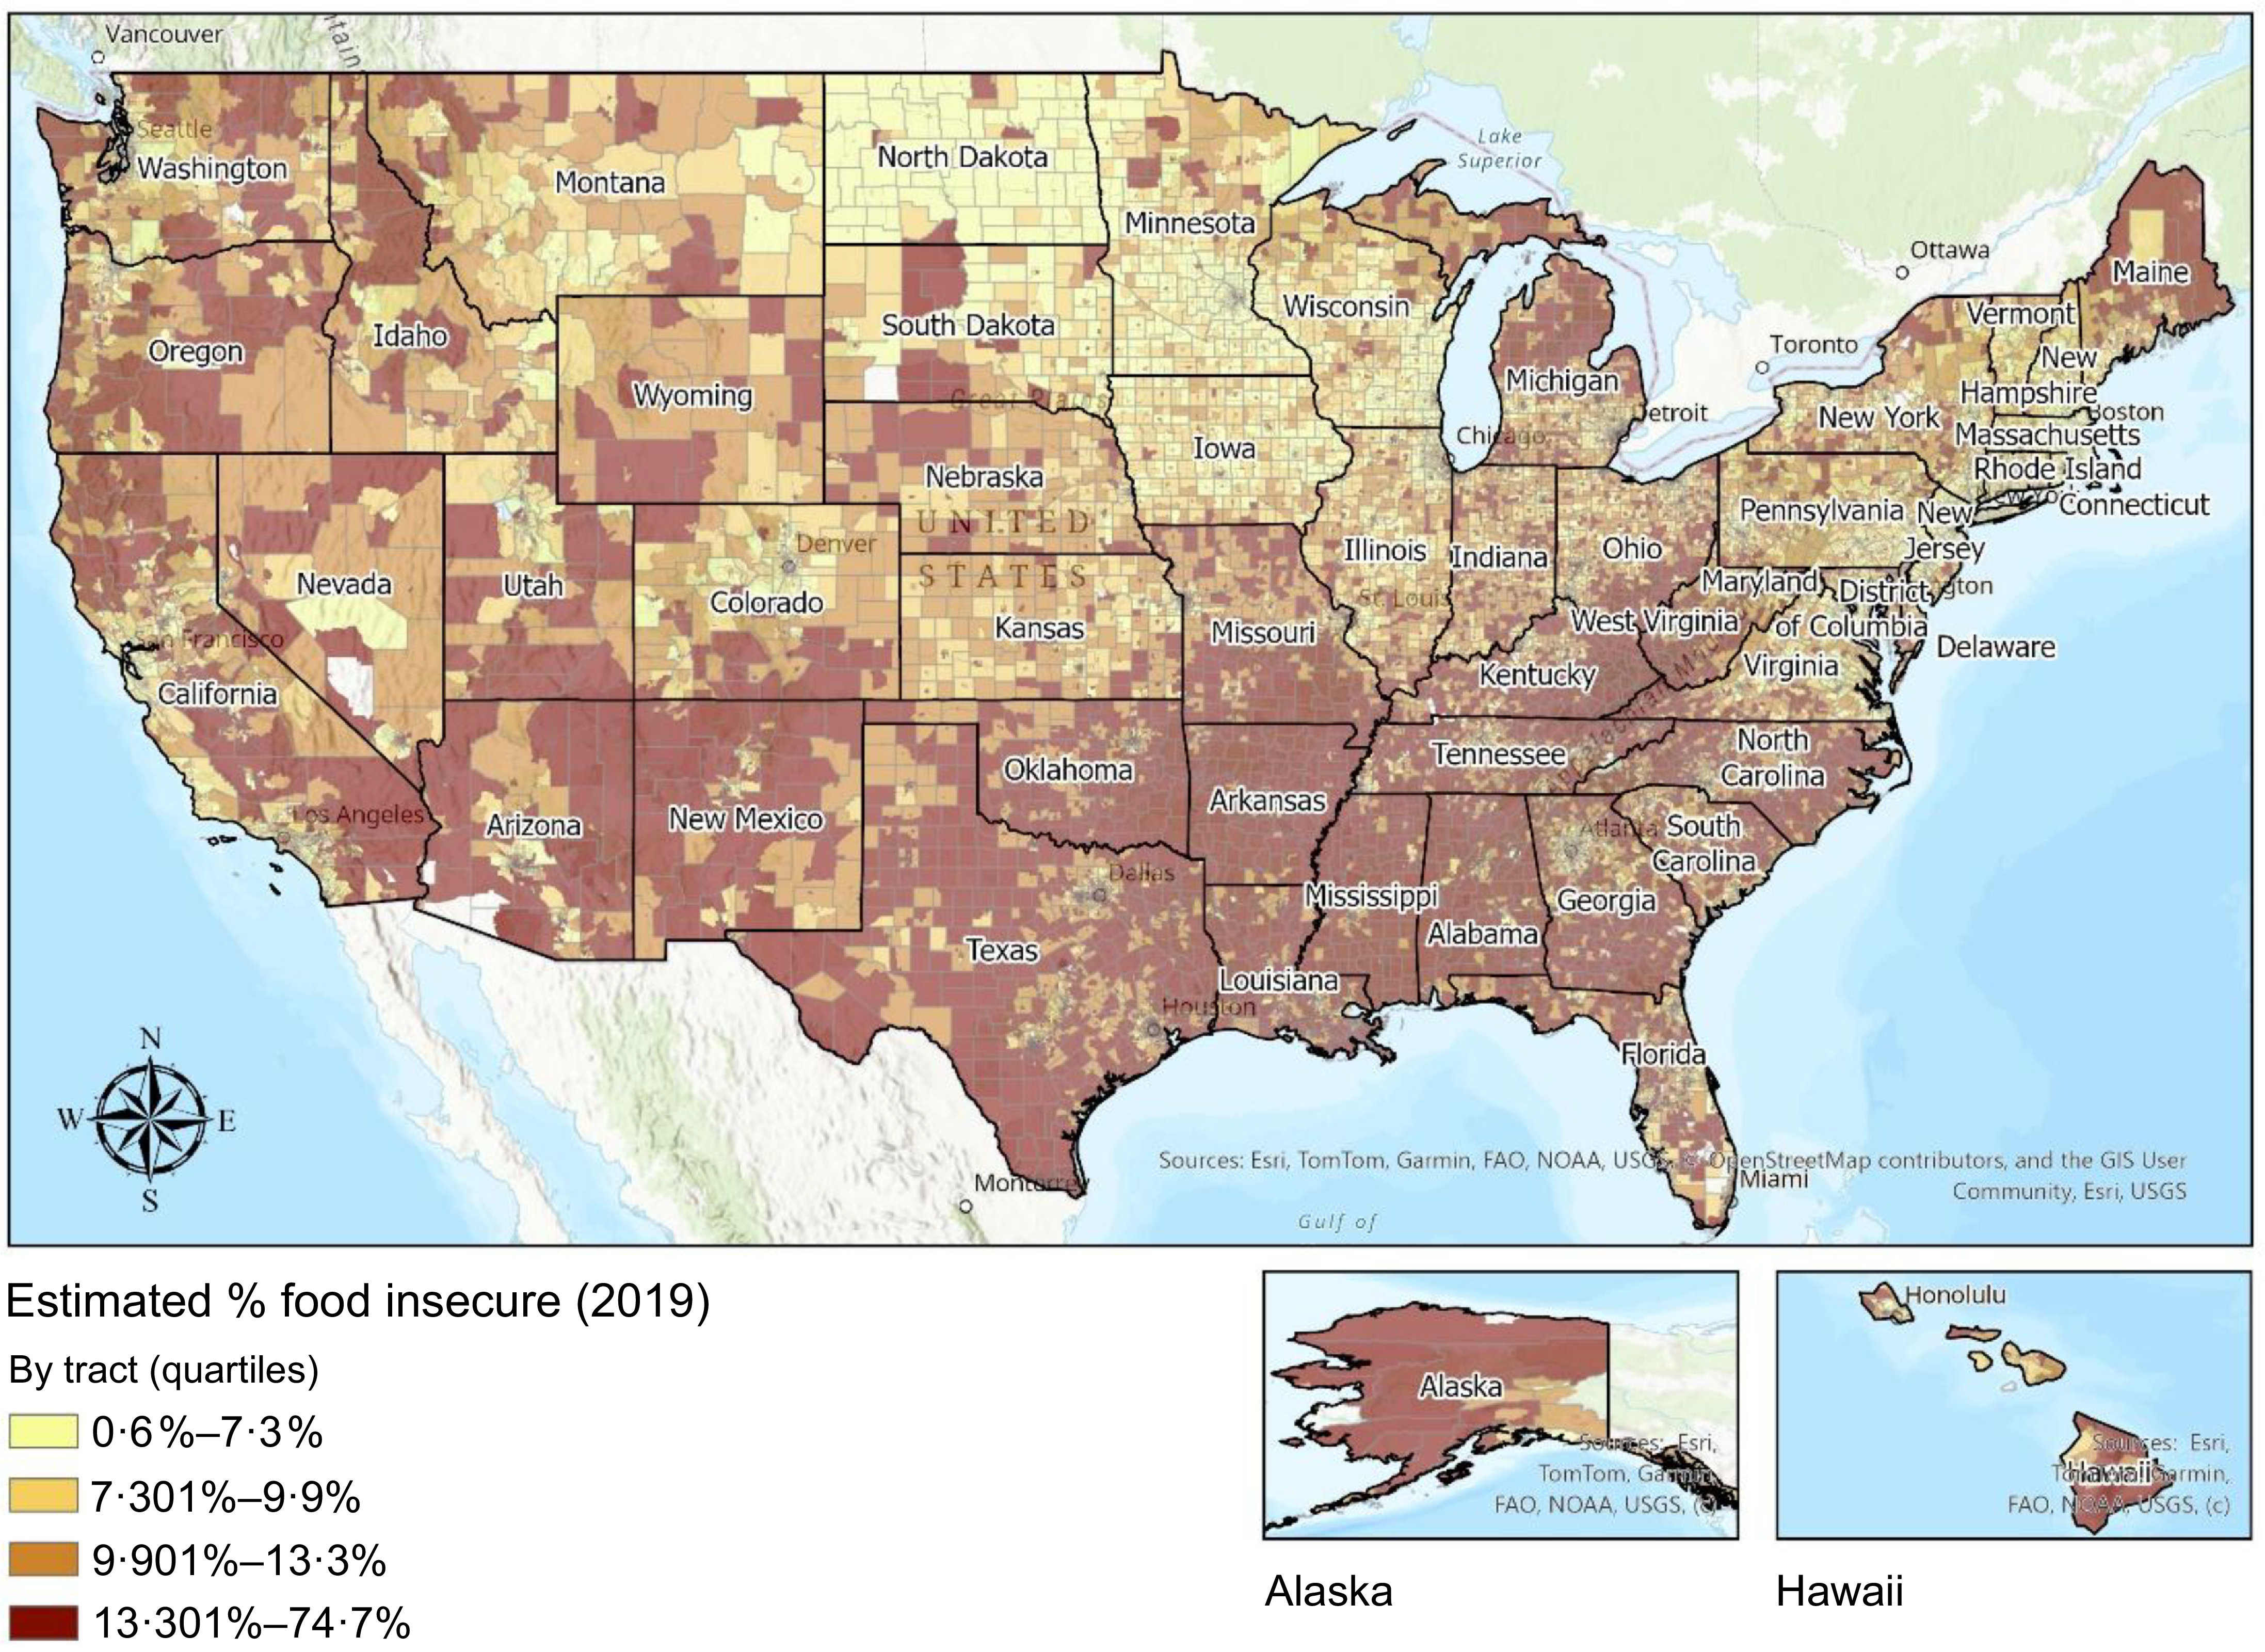
Census tract-level food insecurity estimates were derived using a methodology consistent with Feeding America’s Map the Meal Gap (MMG) framework, as described in Gundersen et al. (Reference Gundersen, Dewey and Engelhard39). In brief, the MMG approach uses a two-step imputation method. In Step 1, state-level food insecurity rates from the December supplement of the Current Population Survey (CPS) from 2009 to 2023 are regressed on a set of covariates including the unemployment rate, non-undergraduate student poverty rate, median income, percentage Hispanic, percentage African American, homeownership rate and percentage of individuals reporting a disability, along with year and state fixed effects. In Step 2, the resulting coefficient estimates are applied to tract-level data from the American Community Survey (ACS) to generate local food insecurity rate estimates. For this study, county- and tract-level ACS variables were drawn from the 2019 five-year estimates, and unemployment data were sourced from the Bureau of Labor Statistics (BLS)(Reference Gundersen and Ziliak2,Reference Gundersen, Hake and Dewey40,Reference Gundersen, Dewey and Hake41) . Figure 1 displays a national choropleth map of food insecurity rates at the census tract level, based on the MMG methodology. The map reveals substantial geographic disparities, with the highest rates concentrated in the rural South, parts of the Southwest and tribal regions. The population-weighted mean food insecurity rate is 12·46 %, with tract-level estimates ranging from 0·0 % to 83·6 %. The interquartile range spans 8·50 % to 16·40 %, illustrating the breadth of food insecurity across communities.
Food insecurity rates, by tract.

Figure 1. Long description
A map of the United States showing estimated percentages of food insecurity by tract in 2019. The map is color-coded to indicate different levels of food insecurity, with darker colors representing higher percentages. The legend at the bottom left indicates four quartiles: 0-6 percent, 7-301 percent, 9-901 percent, and 13-301 percent to 74-7 percent. Key locations such as major cities and states are labeled. Inset maps of Alaska and Hawaii are included to show food insecurity rates in those states. The map highlights areas with varying levels of food insecurity across the country.
To portray areas with consistently high levels of poverty over time, we used tract-level designations developed by the USDA ERS, specifically the Persistent Poverty and Enduring Poverty classifications(42). These measures draw upon decennial census and ACS data and are designed to reflect the depth and duration of economic hardship.
-
• Persistent Poverty Since 1990: Tracts with poverty rates ≥ 20·0 % in four census measurement periods (1990, 2000, 2011 and 2019), spanning approximately 30 years.
-
• Enduring Poverty Since 1980: Tracts with poverty rates ≥ 20·0 % in five census measurement periods (1980, 1990, 2000, 2011 and 2019), spanning approximately 40 years.
-
• Enduring Poverty Since 1970: Tracts with poverty rates ≥ 20·0 % in six census measurement periods (1970, 1980, 1990, 2000, 2011 and 2019), spanning approximately 50 years.
Of the 73 057 census tracts in the initial dataset, 4457 lacked information on Persistent Poverty Since 1990, and 17 917 were missing data on Enduring Poverty status. This missingness reflects two primary sources of exclusion, as described in USDA Technical Bulletin 1967(Reference Farrigan and Sanders35). First, some tracts were excluded due to inconsistent historical tract boundaries. Over time, census tract geographies have changed substantially due to population growth, redistricting and administrative restructuring. As a result, many modern tracts, especially in suburbanising or newly developed areas, did not exist in earlier decades, particularly prior to 1980. These gaps limit the ability to construct consistent long-term poverty histories. Second, the USDA ERS applies reliability screening criteria to all tract-level poverty estimates. Tracts are excluded from the long-term poverty classifications if they have populations under 500 or if the 90 % CI around the poverty estimate spans more than 20 percentage points. These exclusions disproportionately affect low-density and rural areas where small sample sizes lead to greater statistical uncertainty.
Urbanicity–rurality was assessed using the 2010 USDA RUCA codes, which assign each census tract a score from 1 (most urban) to 10 (most rural) based on population density, commuting flows and urbanisation patterns. RUCA codes offer higher geographic resolution than county-level classifications like Rural to Urban Continuum Codes (RUCC) by capturing variation within counties. We collapsed the RUCA codes into three widely used categories in the academic literature, Urban (RUCA 1–3), Micropolitan (RUCA 4–6) and Rural (RUCA 7–10), to improve interpretability and align with common practices in rural health and geographic research(Reference Caldwell, Ford and Wallace43,Reference Hart, Larson and Lishner44) .
We included rurality as a covariate in our models to account for geographic variation in infrastructure, access to services and economic conditions that may be associated with food insecurity and also correlated with poverty and long-term poverty designations. Prior research has shown that rural and micropolitan areas often face distinct challenges, including limited transportation, fewer food retail options and constrained healthcare access, that could otherwise bias the observed associations if left unadjusted(Reference Hart, Larson and Lishner44,Reference Piontak and Schulman45) .
Statistical analysis
After merging at the tract level, we employed two complementary modelling strategies to assess whether longer durations of poverty exposure are associated with higher food insecurity at the census tract level, adjusting for rurality.
Inclusive duration framework
In the first approach, we modelled associations using cumulative tiers of long-term poverty, where each group includes all tracts meeting a minimum duration threshold. This allowed us to evaluate whether longer exposure is associated with higher food insecurity, without excluding overlapping tracts.
-
• In Model A1 tracts with Persistent Poverty Since 1990 are compared to all other tracts not classified as such.
-
• In Model A2 tracts with Enduring Poverty Since 1980 are compared to all tracts not meeting the 1980 threshold.
-
• In Model A3 tracts with Enduring Poverty Since 1970 are compared to all tracts not meeting the 1970 threshold.
Mutually exclusive framework
To more clearly distinguish associations by poverty duration, we constructed mutually exclusive models, assigning each census tract to only one poverty duration category based on its earliest qualifying period.
-
• Model B1 compares tracts classified as Persistent Poverty Since 1990, but not meeting criteria for Enduring Poverty Since 1980 or 1970, to all other tracts.
-
• Model B2 compares tracts classified as Enduring Poverty Since 1980, but not since 1970 to all other tracts.
-
• Model B3 compares tracts classified as Enduring Poverty Since 1970, but not since 1960 to all other tracts.
These two modelling strategies offer complementary insights into how poverty duration relates to food insecurity. The inclusive framework captures how food insecurity tends to be higher with longer durations of poverty by allowing tracts to appear in multiple groups, layered cumulatively based on the earliest decade in which they met poverty thresholds. For example, a tract with poverty ≥ 20 % since 1970 would be included in all three inclusive models: Persistent (since 1990), Enduring 1980 and Enduring 1970. In contrast, the mutually exclusive framework assigns each tract to a single duration category, based on the earliest decade it qualifies. In this set-up, that same tract would appear only in the 1970 group, ensuring no overlap between models. This distinction allows for direct comparisons across separate tiers of long-term poverty exposure. Taken together, the two approaches allow us to assess both cumulative and comparative associations between poverty duration, examining whether tracts with longer exposure tend to have higher food insecurity than tracts with shorter exposure.
Statistical analysis consisted of initially checking underlying spatial autocorrelation. We estimated a series of ordinary least squares regression models, using census tract-level food insecurity rates as the outcome, where all models were adjusted for rural–urban classification using the 3-category collapsed RUCA codes (Urban, Micropolitan and Rural). For each specification, we excluded tracts missing the relevant poverty classification while retaining those with missing data on other poverty measures to maximise sample size. We calculated global Moran’s I(Reference Moran46) from the residuals of ordinary least squares regression models and checked the significance (P < 0·001) of spatial dependency. Visual inspection of residuals v. fitted values did not indicate substantial heteroscedasticity or major departures from linearity. Accordingly, we utilised a spatial error model to account for spatial autocorrelation, given the evidence of strong geographic clustering of the data. Sample sizes varied across models based on the availability of reliable, harmonised data over the required time frames.
Results
We first summarise the characteristics of the analytic samples used in each model. After matching the tract boundaries of long-term poverty, food insecurity and rurality–urbanicity, the number of census tracts included varied by poverty designations: 68 582 tracts were eligible for analysis of Persistent Poverty Since 1990, 55 128 for Enduring Poverty Since 1980 and 55 128 for Enduring Poverty Since 1970. In the inclusive framework, mean food insecurity rates were substantially higher in long-term poverty tracts: 23·1 % (sd 5·95) for Persistent Poverty Since 1990, 23·6 % (sd 6·30) for Enduring Poverty Since 1980 and 24·0 % (sd 6·32) for Enduring Poverty Since 1970, compared to approximately 11·6–12·0 % in other tracts. In the mutually exclusive framework, elevated rates persisted: 22·3 % (sd 5·30) for Persistent Poverty Since 1990 only, 23·0 % (sd 6·22) for Enduring Poverty Since 1980 only and 24·0 % (sd 6·32) for Enduring Poverty Since 1970, v. roughly 11·7–12·3 % among comparison tracts.
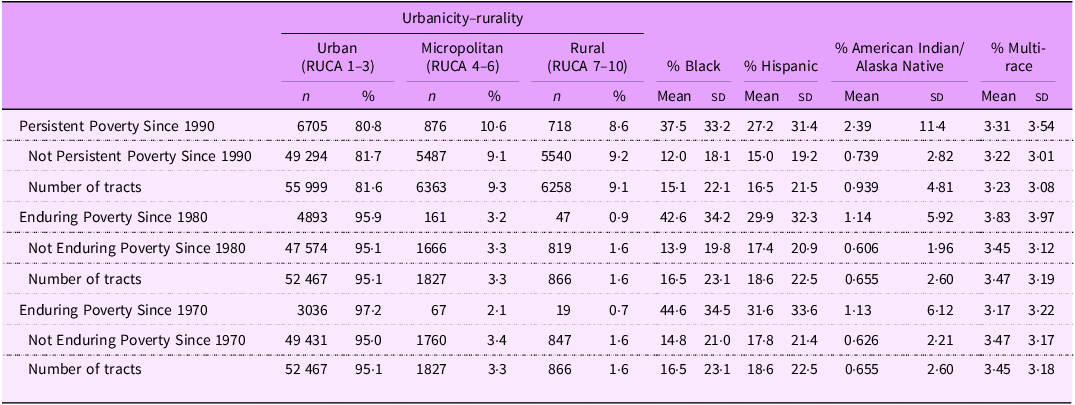
Table 1 summarises census tract distributions across rural–urban classifications and racial/ethnic composition, stratified by long-term poverty designations. Tracts classified as Persistent and Enduring Poverty are primarily located in urban areas, but this pattern reflects the broader distribution of census tracts nationally, as the majority of all tracts, including those not in long-term poverty, are urban. Notably, long-term poverty tracts are also present across micropolitan and rural areas, indicating that Persistent and Enduring Poverty are not exclusively urban phenomena but rather occur across a wide range of geographic contexts.
Characteristics of census tracts used in analysis by long-term poverty designation and RUCA classification

Table 1. Long description
The table presents census tract distributions across rural-urban classifications and racial/ethnic composition, stratified by long-term poverty designations. It includes data on Persistent Poverty since 1990, Enduring Poverty since 1980, and Enduring Poverty since 1970, along with their respective non-persistent or non-enduring counterparts. The table is divided into columns representing urbanicity-rurality classifications (Urban, Micropolitan, Rural) and racial/ethnic composition (% Black, % Hispanic, % American Indian/Alaska Native, % Multi-race). Each row provides the number and percentage of tracts for each classification and composition. Notable trends include a higher concentration of tracts in urban areas across all poverty designations. The table also highlights the presence of long-term poverty tracts in micropolitan and rural areas, indicating that Persistent and Enduring Poverty are not exclusively urban phenomena.
RUCA, Rural-Urban Commuting Area.
Each poverty term is categorised by urbanicity–rurality, where the percentage for each row sums up to 100 %. Percent Black, Hispanic and American Indian/Alaska Native are included because these racial and ethnic groups have historically experienced disproportionately high rates of food insecurity in the USA. Rurality is based on 2010 RUCA codes. Urban = RUCA 1–3; Micropolitan = RUCA 4–6; Rural = RUCA 7–10. Percentages reflect tract counts in the analytic sample.
Racial disparities are evident: tracts in long-term poverty have substantially higher proportions of Black and Hispanic populations compared to non-long-term poverty tracts. The concentration of American Indian/Alaska Native and multi-race populations is particularly notable, while overall averages are low, tracts classified as Persistent Poverty Since 1990 or Enduring Poverty Since 1970 have mean AI/AN percentages nearly double or triple that of tracts that are not Persistent Poverty Since 1990 or Enduring Poverty Since 1970 (e.g. 2·39 % v. 0·74 % for Persistent Poverty and 1·13 % v. 0·63 % for Enduring Poverty Since 1970), indicating a disproportionate presence of Native communities in areas with long-term structural disadvantage.
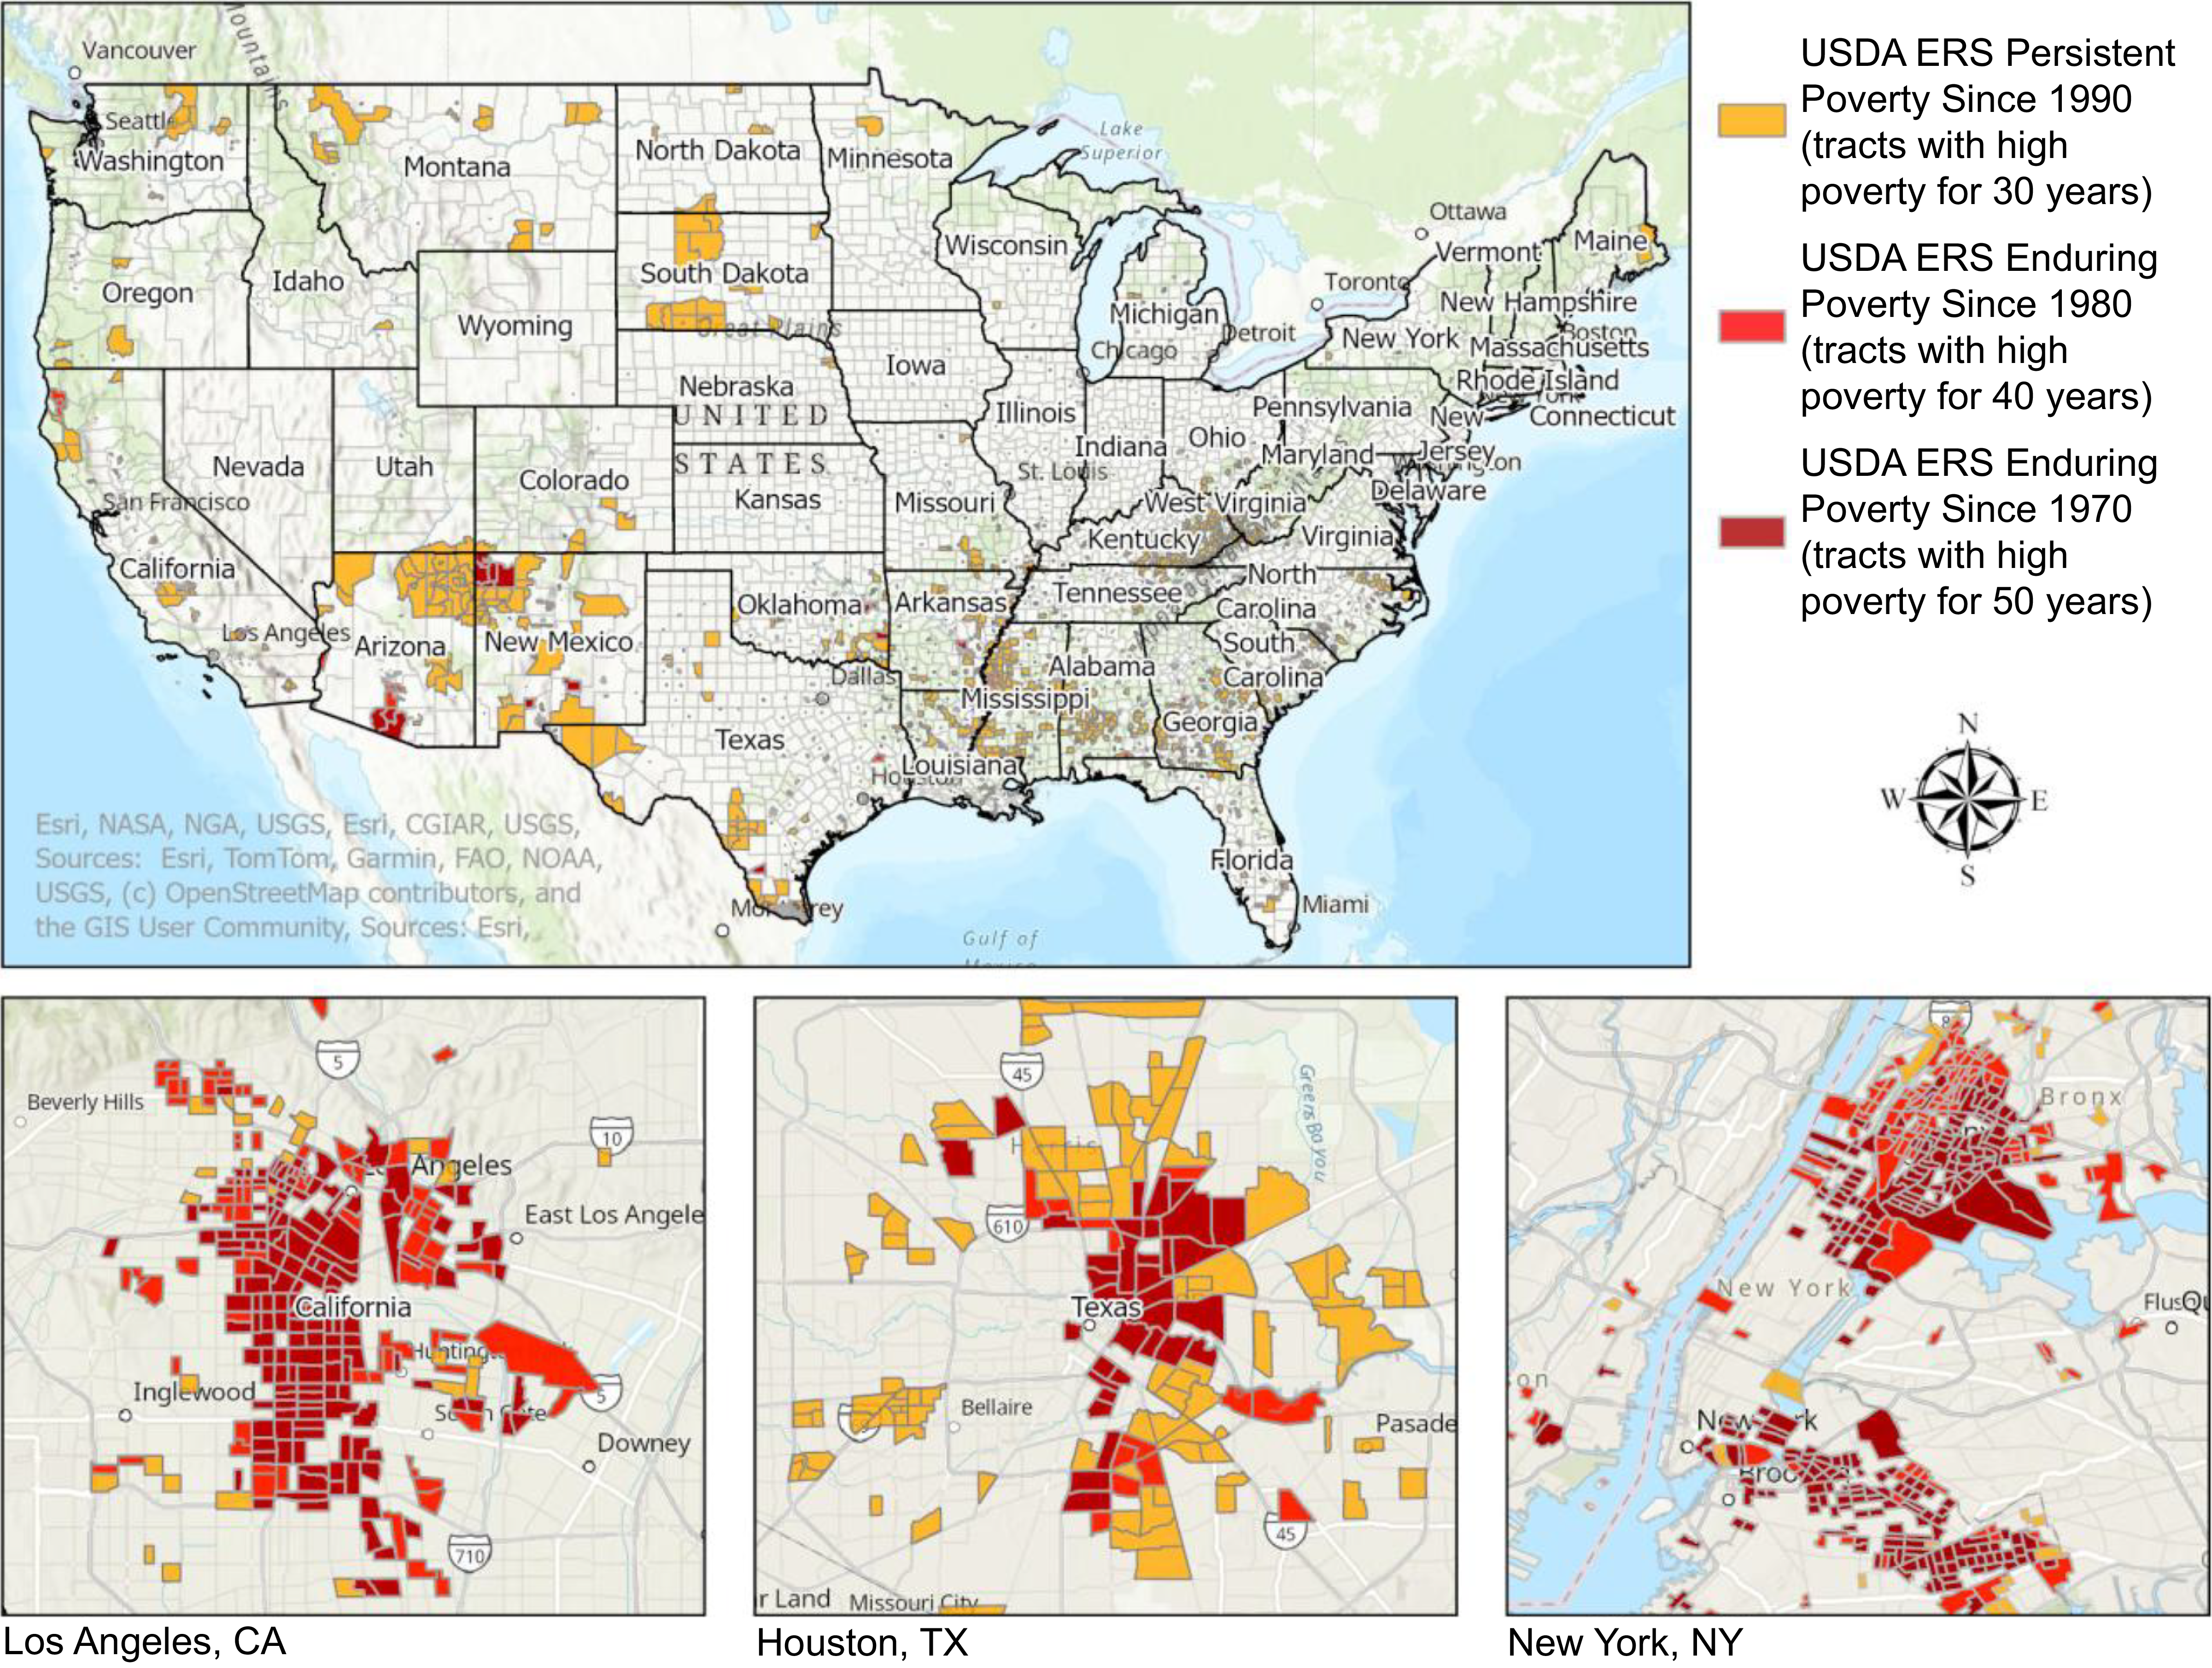
Figure 2 displays census tracts classified under the three long-term poverty designations: Persistent Poverty Since 1990, Enduring Poverty Since 1980 and Enduring Poverty Since 1970. While larger census tracts are visible in the figure for the USA, smaller census tracts are not. So, we also include in the inset views of Los Angeles, Houston and New York City. As shown in this figure, long-term poverty is not evenly distributed across space; rather, it tends to group in specific areas. Within the urban insets, concentrations are especially prominent in the southern part of Los Angeles, the eastern neighbourhoods of Houston and areas like the South Bronx and East Brooklyn in New York City.
USDA ERS long-term poverty designations, by tract, throughout the USA and zoomed into large metro areas. USDA ERS, US Department of Agriculture Economic Research Service.

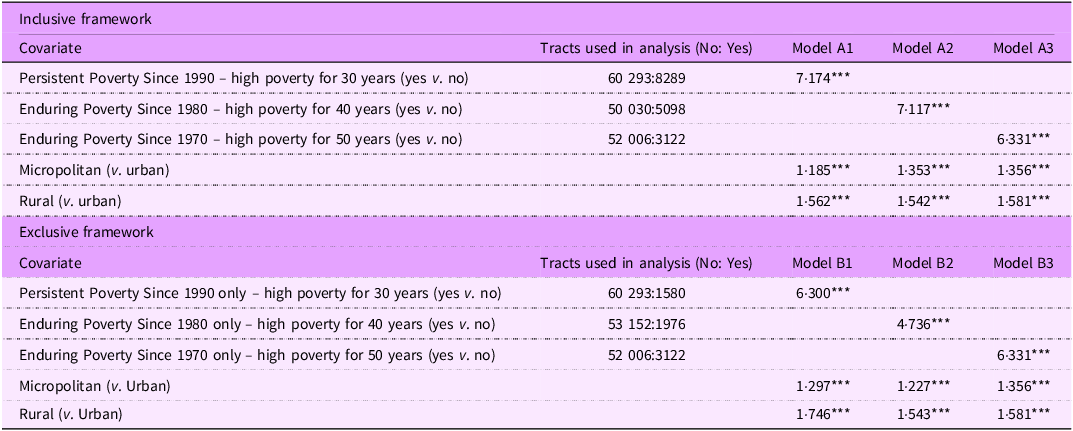
Table 2 presents result from spatial error model analyses using both the inclusive and mutually exclusive poverty duration frameworks, as previously described in the Methods section. Fully adjusted regression models, including controls for rural–urban classification, revealed strong and consistent associations between long-term poverty exposure and food insecurity across both the inclusive and mutually exclusive frameworks.
Associations between long-term poverty exposure and census tract-level food insecurity (adjusted for rural–urban classification)

Table 2. Long description
The table compares associations between long-term poverty exposure and food insecurity using inclusive and exclusive frameworks. It includes data on tracts used in analysis and model results for different poverty durations and rural-urban classifications. The table is divided into two main sections: Inclusive framework and Exclusive framework. Each section lists covariates, tracts used in analysis, and model results for three different models. The inclusive framework section includes covariates such as Persistent Poverty Since 1990, Enduring Poverty Since 1980, Enduring Poverty Since 1970, Micropolitan, and Rural. The exclusive framework section includes similar covariates but with different tracts used in analysis and model results. Each row provides specific values for the tracts used in analysis and the model results. Notable trends include consistent associations between long-term poverty exposure and food insecurity across both frameworks. The table provides detailed data points for each covariate and model, highlighting the strong and consistent associations observed in the analysis.
RUCA, Rural-Urban Commuting Area.
In the inclusive models (A1–A3), tracts are included in all groups for which they meet the poverty threshold. For example, a tract classified as Enduring Poverty Since 1970 would also appear in the 1980 and 1990 groups. In contrast, the mutually exclusive models (B1–B3) assign each tract to only one category based on the earliest decade it meets the poverty threshold, thereby avoiding any overlap. Model B1 includes tracts with Persistent Poverty Since 1990 only, those that do not qualify for the Enduring Poverty designations. Model B2 includes tracts with Enduring Poverty Since 1980 only, those meeting the threshold for 1980 but not for 1970. Model B3 includes tracts with Enduring Poverty Since 1970, representing the longest duration of poverty exposure. Although these tracts also meet the criteria for 1980 and 1990, they are assigned only to the 1970 group in order to maintain mutually exclusive classification. All models adjust for rural–urban classification using RUCA codes, where Urban (RUCA 1–3) serves as the reference category, compared to Micropolitan (RUCA 4–6) and Rural (RUCA 7–10). The referent group in each model comprises tracts that do not meet the respective poverty duration designation.
***Denotes significance levels P < 0·001.
In the inclusive duration models, tracts classified as Persistent Poverty Since 1990 (high poverty for 30 years) had food insecurity rates that were 7·174 percentage points higher than those not classified as such (P < 0·001; Model A1). When examining tracts with longer exposure, those classified as Enduring Poverty Since 1980 (high poverty for 40 years) had rates 7·117 percentage points higher than other tracts (P < 0·001; Model A2). Tracts in the most entrenched category, Enduring Poverty Since 1970 (high poverty for 50 years), experienced similarly elevated food insecurity rates, at 6·331 percentage points higher than other tracts (P < 0·001; Model A3).
The mutually exclusive models provided further nuance by disaggregating tracts based on the longest duration of poverty exposure with no overlap. Tracts with Persistent Poverty only, those with high poverty for 30 years, but not 40+ years, had food insecurity rates 6·300 percentage points higher than other tracts (P < 0·001; Model B1). Tracts classified as Enduring Poverty Since 1980 only (high poverty for 40 years, but not 50+ years) had rates 4·736 percentage points higher (P < 0·001; Model B2). Meanwhile, tracts in the Enduring Poverty Since 1970 category, those with the deepest historical poverty exposure (≥ 50 years), showed the highest disparities, with food insecurity rates 6·331 percentage points higher than other tracts (P < 0·001; Model B3).
Across all models, rurality was a statistically significant contributor to food insecurity. Compared to urban areas, micropolitan tracts exhibited increases in food insecurity ranging from 1·2 to 1·4 percentage points, while rural tracts were associated with increases between 1·5 and 1·7 percentage points, depending on the model.
Discussion
Summary of main findings
This study demonstrates that the duration of poverty exposure, whether Persistent Poverty Since 1990, Enduring Poverty Since 1980 or Enduring Poverty Since 1970, is strongly and consistently associated with elevated food insecurity at the census tract level. In both the inclusive and mutually exclusive analytic frameworks, tracts with histories of high poverty spanning three to five decades exhibited food insecurity rates approximately 4·7–7·2 percentage points higher than comparison tracts, even after adjusting for rural–urban classification. These findings extend the existing literature on poverty and food insecurity by introducing a place-based, duration-sensitive dimension that has been largely absent from prior research.
Relationship to prior research
A substantial body of household-level research has established that sustained economic hardship is more strongly associated with food insecurity than transient income shocks(Reference Chen, Wu and Jin22,Reference Keister, Gibson-Davis and Gennetian26,Reference Lee, Barrett and Hoddinott29) . Collectively, this work shows that households experiencing persistent low income and limited wealth accumulation face markedly higher food insecurity risk than those undergoing short-term economic disruption, whether measured through food security trajectories over time(Reference Lee, Barrett and Hoddinott29), net worth poverty independent of income(Reference Keister, Gibson-Davis and Gennetian26) or income trajectory classes characterised by persistently low or declining income(Reference Chen, Wu and Jin22). Our findings complement this household-level evidence by demonstrating that an analogous pattern operates at the neighbourhood scale: census tracts with decades of concentrated poverty exhibit substantially higher food insecurity rates than tracts with shorter histories of disadvantage, suggesting that the duration of place-based poverty captures a dimension of structural vulnerability not fully reflected in contemporaneous poverty rates alone.
These associations are also consistent with a broader literature linking Persistent Poverty to adverse population health outcomes, including higher cancer mortality(Reference Moss, Pinto and Srinivasan37), disproportionate concentration of Persistent Poverty in the rural South, Appalachia, tribal lands and high-poverty urban cores(Reference Benson, Bishaw and Glassman33), and lower life expectancy and worse health infrastructure across the rural–urban continuum(Reference Miller and Weber36). Our study extends this work by showing that Persistent and Enduring Poverty designations are also meaningfully associated with food insecurity, a key upstream determinant of diet quality and chronic disease risk(Reference Berkowitz, Seligman and Meigs3,Reference Gundersen and Ziliak4) .
Interpretation and mechanisms
The elevated food insecurity observed in long-term poverty tracts likely reflects cumulative processes of structural disinvestment that erode the local food environment over time. As outlined in the Introduction, the theoretical framework of cumulative disadvantage suggests that prolonged concentrated poverty triggers self-reinforcing cycles of commercial withdrawal, institutional erosion and diminished social infrastructure. Our results align with these mechanisms in several specific ways. Shannon(Reference Shannon30) described ‘retailer redlining’, whereby full-service grocery chains systematically avoid high-poverty neighbourhoods; this commercial disinvestment reflects decades of market decisions shaped by perceived profitability and neighbourhood stigma, not merely current economic conditions. Historical residential segregation further compounds these dynamics: Linde et al. (Reference Linde, Walker and Campbell31) found that neighbourhoods subjected to historical redlining continue to exhibit worse social determinants of health, including higher food insecurity rates, and Yankey et al. (Reference Yankey, Lee and Gardenhire32) demonstrated that neighbourhood racial segregation predicted supermarket distribution more strongly than socio-economic factors alone. These findings are directly relevant to our results, as long-term poverty tracts in our analysis are disproportionately home to Black, Hispanic and American Indian/Alaska Native populations, communities most affected by historical segregation and targeted disinvestment(Reference Rabbitt, Reed-Jones and Hales1,Reference Berning, Bonanno and Cleary21) . The associations we observe thus likely reflect not only the economic dimension of prolonged hardship but also the racialised and historically embedded mechanisms through which food access disparities become entrenched over generations.
Notably, the USDA long-term poverty designations are defined by sustained high poverty rates, and poverty is the strongest known predictor of food insecurity. In this sense, some degree of association between the exposure and outcome is expected by construction. The contribution of this study, however, lies in demonstrating that the duration of place-based poverty is associated with food insecurity beyond what contemporaneous poverty rates alone would predict, and that this association persists across multiple operationalisations of poverty duration. Even when two tracts share similar current poverty rates, the tract with a longer history of high poverty may lack the community organisations, food retail options and municipal services that buffer households against food insecurity(Reference Shannon30–Reference Yankey, Lee and Gardenhire32). Over time, these structural deficits become self-reinforcing, producing food insecurity burdens that exceed what current economic conditions alone would predict.
Across all models, rurality was independently associated with higher food insecurity, with micropolitan tracts exhibiting rates 1·2–1·4 percentage points higher and rural tracts 1·5–1·7 percentage points higher than urban tracts. These findings are consistent with prior research documenting that rural food insecurity is shaped by limited transportation, geographic isolation from food retail and constrained access to social services(Reference Gundersen, Dewey and Hake41,Reference Piontak and Schulman45) . The independent contribution of rurality, even after accounting for long-term poverty status, suggests that rural structural barriers represent a distinct pathway to food insecurity that operates alongside, rather than through, poverty duration.
Strengths and limitations
This study has several strengths, including the use of nationally comprehensive census tract data, the application of spatial error models to account for geographic clustering and the use of two complementary analytic frameworks, inclusive and mutually exclusive, that provide both cumulative and comparative perspectives on poverty duration.
However, several limitations should be noted. First, the cross-sectional design, based on 2019 modelled food insecurity estimates, limits causal interpretation and prevents assessment of temporal change in food insecurity within tracts over time. Second, while we adjusted for rurality, the models did not include other contextual covariates, such as housing costs, local food retail density or transportation infrastructure, that may be correlated with both long-term poverty and food insecurity. Third, the poverty classifications rely on harmonised historical tract-level data from the USDA ERS, which apply reliability thresholds that exclude some rural and recently developed areas, potentially underestimating exposure in those places. Fourth, the food insecurity estimates are modelled rather than directly measured. Notably, the MMG imputation model includes covariates such as the poverty rate, percentage Black and percentage Hispanic, variables that are also correlated with long-term poverty designations. While the exposure and outcome are derived from independent data sources and measure distinct constructs (historical poverty duration v. estimated current food insecurity), this overlap means that the observed associations may partly reflect shared underlying inputs rather than fully independent variation. Finally, the ecological design does not permit inferences about individual- or household-level food insecurity experiences within these tracts; the magnitude of associations observed at the tract level should not be interpreted as reflecting individual-level effects.
Implications for policy and future research
Despite these limitations, the findings carry clear implications for policy and practice. Interventions aimed at reducing food insecurity may be more effective when they account for how long a community has been affected by concentrated poverty, not merely whether it is currently poor. Duration-based targeting, particularly of Enduring Poverty tracts, can help direct resources to areas where structural disadvantage has accumulated over generations. Place-based investment strategies, such as US Housing and Urban Development (HUD) Promise Zones, or Community Development Financial Institution (CDFI) fund priority areas, offer practical models for directing infrastructure, economic development and food access resources to communities where need is deepest and most long-standing(Reference Benson, Bishaw and Glassman33,Reference Farrigan and Sanders35) . Future research should explore the mechanisms linking poverty duration to food insecurity by incorporating measures of the local food retail environment, transportation access and housing affordability. Longitudinal designs tracking changes in both poverty status and food insecurity within tracts over time would strengthen causal inference, and integrating community perspectives through qualitative approaches may provide deeper insight into how residents of long-term poverty tracts experience and navigate food access challenges.
Conclusions
Long-term poverty exposure is strongly associated with elevated food insecurity at the census tract level across the USA. Addressing food insecurity effectively requires more than responding to immediate economic need; it also requires recognising and responding to the structural, spatial and temporal forces, including racialised disinvestment, cumulative institutional erosion and the progressive degradation of local food environments, that shape long-term vulnerability in communities across the country. Incorporating historical poverty measures into resource allocation frameworks could improve the identification of communities most in need and support more precisely targeted, duration-sensitive interventions.
Acknowledgements
The authors would like to acknowledge the research staff at the University of Texas MD Anderson Cancer Center who assisted with the implementation of the Acres Homes Cancer Prevention Collaboration.
Financial support
This work is supported by funding from the National Cancer Institute of the National Institutes of Health under Award Number 1U54CA280804. The content is solely the responsibility of the authors and does not necessarily represent the official views of the National Institutes of Health.
Competing interests
There are no conflicts of interest.
Author contributions
R.R. and C.G. conceptualised the study. Y.C., J.L. and Y.L. contributed equally to data analysis, mapping and interpretation of results. All authors contributed to writing and approved the final manuscript. Data for this study were provided by G.C. and ERS.
Ethics of human subject participation
This study was conducted according to the guidelines laid down in the Declaration of Helsinki. All procedures involving research study participants were approved by the Committee for the Protection of Human Subjects at UTHealth Houston School of Public Health (IRB number: HSC-SPH-24-0164).
Data availability: The corresponding author can be contacted with any questions regarding the data used in analysis; data may be shared subject to relevant policies of the host organisation.

 Open access

