1 Introduction
Over the years, employers around the world have strived to provide retirement income security by setting up defined-benefit (DB) pension schemes. Under such schemes, the employee's pension benefit is determined by a formula that takes into account such factors as years of service for the employer and, in most cases, wages or salary. In many countries, pension legislation requires plan sponsors to make good on these promises even if the underlying value of the pension reserve falls short. As such, pension sponsors, rather than pension plan participants, bear pension investment and longevity risks. From the perspective of pension participants, an important appeal of the DB model is that it allows them to plan their retirement income without requiring much knowledge of saving, portfolio choice, capital market risks, or mortality trends. The aging population and the international move toward the market-based accounting standard, however, have placed substantial funding pressure on DB plans. As a consequence, the past two decades have seen a strong trend away from DB plans toward defined-contribution (DC) plans in many countries, especially in the Anglo-Saxon world. Under a stereotype DC plan, each participant has an individual retirement account into which the participant and the sponsors (if any) make regular contributions. The retirement benefit then depends on the total contribution and investment earnings of the accumulation in the account over time. In the case of DC plans, retirement saving and income tend to be more subject to employees' control throughout the life cycle, and hence it helps to relieve employers and other sponsors of some, if not all, responsibility for pension provision under the DB framework.
Many commentators seem to agree that the shift to DC plans, however, is far from being a satisfactory solution because they are too complex and too risky for individuals (see, for instance, Merton (Reference Merton2006) ). Individuals typically lack the financial expertise and computation capacities to implement complex lifetime financial planning, as is shown by Lusardi and Mitchell (Reference Lusardi and Mitchell2006) and van Rooij et al. (Reference van Rooij, Lusardi and Alessie2006). DC plans are also vulnerable to large marketing and management costs, and to market failure like that stemming from adverse selection in annuity markets. As a balance between DB and DC, an approach which has been implemented recently by many Dutch pension funds and which is under discussion in the UK is to introduce a practice known as ‘conditional indexation’.
In a conditional indexation scheme, the pension profile of a participant guarantees a minimum level which is updated each year through a decision on the inflation indexation for that year on the basis of the funding ratio of pension fund (the ratio of asset value to liability value). That is, the guaranteed level is built up by multiplying a conditionally granted indexation level each year. If a participant is granted full indexation every year, then her pension can fully compensate for inflation, and it is the maximum pension she can receive.
Thus conditional indexation schemes are essentially formulated in a framework of two reference points: they guarantee a minimum nominal amount of pension rights, and at the same time aim to provide pension rights sufficient to fully cover inflation. In the words of Bikker and Vlaar (Reference Bikker and Vlaar2007),
‘the typical pension contract nowadays comprises an average earnings defined benefit pension in which only nominal benefits are guaranteed, but with the intention to provide wage indexation.’
A way of thinking about pension systems is suggested here which has as salient features the presence of both a minimum benefit (guaranteed amount) and a maximum benefit (full indexation).
From the perspective of participants, conditional indexation schemes are similar to DB plans in the way benefits are specified. From the perspective of pension funds, conditional indexation brings a DC element as the liability value will generally change in line with the development of the fund's asset value through the practice of indexation, therefore serving as a shield of the funding ratio against the fluctuation of asset value stemming from exposure to financial markets (see Dai and Schumacher (Reference Dai and Schumacher2008) ). In a nutshell, conditional indexation, like traditional DB, enables participants to enjoy a high level of pension predictability, and like DC, enables pension funds to have a high level of financial stability. While we focus on conditional indexation from a pension perspective in this paper, similar schemes are also relevant in the context of with-profit policies; cf. for instance Grosen and Jørgensen (Reference Grosen and Jørgensen2002), Ballotta et al. (Reference Ballotta, Haberman and Wang2006), and Gatzert and Kling (Reference Gatzert and Kling2007) for a discussion of related schemes.
The introduction of conditional indexation may raise a number of issues, such as the valuation of pension liabilities, the definition of accrued pension rights, and long-term stationarity of pension funds. In this paper, we focus on the quality of pension profile of conditional indexation schemes from a life-cycle investment perspective, working under the assumption that participation in the scheme is compulsory (as is the case in The Netherlands) so that in practice a financial constraint is imposed on participants.
The objective of carrying out an evaluation of alternative investment schemes calls for the formulation of an evaluation criterion. As is common in the literature, we will use the expected utility framework of von Neumann and Morgenstern (Reference von Neumann and Morgenstern1944). This framework still allows considerable freedom in choosing a utility function. Rather than summarily eliminating most of this freedom by restricting ourselves to a one-parameter family of utility functions, we apply some considerations relating to the particular nature of the investment scheme that is under investigation in this paper.
Reference points are absent from the power or constant relative risk aversion (CRRA) utility function, which is the standard criterion underlying much analysis on optimal pension investment and pension scheme design. It is common, though, for individuals to use benchmarks or reference points as an aid in evaluation and decision-making under uncertainty (Tversky and Kahneman, Reference Tversky and Kahneman1981). Perhaps the most well-known example to economists is the notion of loss aversion in prospect theory; one of the defining properties of loss aversion is that wealth is measured relative to a given reference point. People divide risky outcomes into gains (greater than the reference point) and losses (less than the reference point), and experiments have shown that people's preferences with respect to gains and with respect to losses are different (Kahneman and Tversky, Reference Kahneman and Tversky1979; Tversky and Kahneman, Reference Tversky and Kahneman1992). Prospect theory formulates the phenomenon by a utility function with a kink at the reference point.
People may use different reference frameworks for decisions in different situations, and in some cases like the above-mentioned pension fund context it seems more appropriate to use more than one reference point. March and Shapira (Reference March and Shapira1987) argue that two reference points may have significantly more descriptive power than a single one, and that from managerial perspectives on risk taking, a target level for performance and a survival level are the most frequently mentioned references. On the basis of their and other theoretical studies on multiple reference points, Sullivan and Kida (Reference Sullivan and Kida1995) conducted some experiments to investigate the effect of multiple reference points on managers' decision-making under risk. Their finding indicates that presence of two reference points is in conformity with a complex pattern of risk-taking behavior; managers' decisions are affected by the positions of risky alternatives relative to two important reference points.
In the finance literature, the notion of loss aversion, built on the assumption of a single reference point, has been introduced by a number of recent papers, for example, Benartzi and Thaler (Reference Benartzi and Thaler1995), Barberis et al. (Reference Barberis, Huang and Santos2001), Berkelaar et al. (Reference Berkelaar, Kouwenberg and Post2004), and Gomes (Reference Gomes2005). The common modeling approach is to introduce a kink in the reference point distinguishing gains from losses. It may be noted that many commercial investment products involve guarantees; if such products are to be explained as optimal from an expected utility perspective, then kinked utility must play a role. Explanatory factors might include the principal/agent relationship; this factor also plays a role in the pension context. For the purposes of this paper, we assume that all considerations can be sufficiently expressed by a family of kinked utility functions.
Given the salience of two reference points in the pension context, it may be appropriate to allow the presence of two reference points in formulating preferences. The utility function we present below is an extended version of the power utility function, allowing for kinks at two reference points. It is an extension of the power utility function with a kink at a single reference point that Berkelaar et al. (Reference Berkelaar, Kouwenberg and Post2004) use to express loss aversion.
In addition to reference points, updating the guaranteed level over time as seen in conditional indexation schemes may be justified in part by external habit formation. That is, the reference point that people use to evaluate their consumption depends on the history of general consumption level, reflecting people's desire to ‘catch up with the Joneses’. In this paper, however, we abstract from this point in formulating a benchmark utility function, in view of the absence of a firmly established standard for expressing external habit formation, and also to stay close to the classical CRRA framework.
The implication of two reference points for pension finance can be shown through looking at the investment policy optimal with respect to the extended power utility function incorporating reference points. Assuming the standard Black and Scholes (Reference Black and Scholes1973) economy, we shall solve for the optimal investment policy in the sense that the expected utility of participants is maximized. As will be presented below, the optimal investment strategy can be characterized by a (partial) floor protection at the lower reference point, as well as a (partial) cap at the upper reference point. Intuitively, it can be interpreted as buying partial floor protection through selling part of the upside potential, similar to what is done in a collar construction. Compared with loss-averse preference, which is characterized by utility function with a kink at a single reference point, the strategy optimal for the preference with two reference points provides a better downside protection at the cost of forgoing more upside potential.
The subject of welfare analysis is a stylized conditional indexation scheme which is constructed to have a dynamically updated guaranteed level as seen in practice. To make the welfare analysis comparable with standard life-cycle investment studies, we impose that conditional indexation schemes be financially fair in the sense that the value of pension rights is equal to the value of contributions. In the absence of financial fairness, some participants could be arbitrarily better off with ex ante wealth transfer from others. To this end, we shall discuss ways in which one may construct pension systems that combine conditional indexation with financial fairness. The main idea we use below is contingent exchange of one option by another of equal value, with continuous updating of the parameters characterizing the options. This implies that conditional indexation as defined here could in principle be used by an individual as a private investment scheme. Being implemented in a financially fair manner, conditional indexation schemes can then be subject to welfare analysis to see how good conditional indexation schemes can be from the life-cycle investment perspective of participants. We illustrate by numerical examples how the evaluation outcome depends on the presence and strength of the reference points.
Since our purpose in this paper is to focus on the welfare implications of conditional indexation, we avoid technical complications due to factors that we believe are less directly related to the conditional indexation idea. We do introduce, as discussed above, utility functions that involve particular reference points because such reference points also play a role in conditional indexation. However, we do not include in the analysis several features that are often considered in the recent life-cycle investment literature, such as human capital, stochastic interest rates, stochastic inflation, longevity risk, and asset return predictability. In a more comprehensive investigation, such factors should be taken into account; here our aim is to present a first analysis.
The paper is organized as follows. In the next section, we formulate a class of piecewise power utility functions to allow that risky outcomes are evaluated against two reference points, and specify the financial setting. To establish the benchmark of the welfare analysis, the pension investment optimal for this class of utility functions is investigated in Section 3. Section 4 discusses the formulation of conditional indexation schemes whose payoff structure is close to those generated by collective pension funds in practice. The welfare analysis of conditional indexation schemes is illustrated by numerical examples in Section 5. Some concluding remarks are in Section 6.
2 The model
2.1 The utility function
The power utility function is the most widely used evaluation measure in the literature on dynamic asset allocation. It has some desirable properties in terms of mathematical tractability, and it reflects constant relative risk aversion, which is thought to be a reasonable assumption on people's risk preferences. The power utility function is also used as a building block to accommodate other attributes of preferences like loss aversion and habit formation. In this respect, refer to Berkelaar et al. (Reference Berkelaar, Kouwenberg and Post2004) for an example on loss aversion, and to Sundaresan (Reference Sundaresan1989) and Campbell and Cochrane (Reference Campbell and Cochrane1999) on habit formation. Following a similar approach, we propose a utility function with the power utility as a building block in order to reflect the presence of reference points.
Assume that an individual considers pension investment in a framework of two reference points: a guaranteed level and an intention level, denoted by θ1 and θ2, respectively. With respect to the two reference points, possible pension payoffs at retirement, W, can be divided into three regions: below the guaranteed level, beyond the intention level, and in between. As in papers on loss aversion, the presence of the two reference points is formulated by two kinks corresponding to the two points in the utility function. Within each of the three regions, the utility is specified in the standard power form, reflecting locally constant relative risk aversion. In addition, we impose that the utility function should be continuous.
In general, the utility function can be formulated by a piecewise power function characterized by five parameters:

where

In the above, the parameters γL, γM and γR are positive and represent the local constant relative risk aversion within the left, middle and right regions, respectively. The parameters κL and κU, which must be greater than or equal to 1 to ensure concavity, denote the ‘kinkedness’ of the utility function at the lower and upper reference points. For simplicity, we mainly work with the two-parameter family that is obtained by the simplification that the degrees of kinkedness are identical at both reference points and the local rates of risk aversion are identical for the three regions:

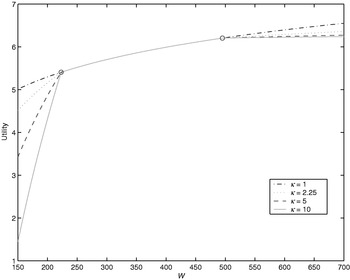
where γ (>0) is the local rate of relative risk aversion, and κ (⩾1) is the kinkedness parameter (Figure 1).
The two-parameter class of utility functions (2). This figure visualizes the utility function for different values of the kinkedness parameter: κ=1 (dash-dotted), κ=2.25 (dotted), κ=5 (dashed), and κ=10 (solid). Other parameter values are: γ=1, θ1=223, and θ2=495

There is a parameter similar to κ in the utility function of prospect theory that represents the degree of loss aversion. Tversky and Kahneman (Reference Tversky and Kahneman1992) estimate that the loss aversion parameter is equal to 2.25 based on the experimental results of a group of individuals facing hypothetical decision problems. The two kinks cause the marginal utility to jump at the two reference points. We note that when κ=1, the utility function is reduced to the standard power utility function, and that it also incorporates the utility function considered by Berkelaar et al. (Reference Berkelaar, Kouwenberg and Post2004) as a special case when θ2 is infinity. Because of the kinks, the preference expressed by the piecewise utility function has the property of first-order risk aversion at the reference points (Segal and Spivak, Reference Segal and Spivak1990).
2.2 The financial setting
We assume that the individual, over the working life, contributes to an occupational pension scheme an amount whose value is known at entry into the pension system, and receives a lump-sum pension at retirement. In line with standard life-cycle investment analysis, the individual, within the expected utility framework, would invest the contributed amount in such a way that the expected utility over the lump-sum pension is maximized. We work in a highly simplified setting, namely the standard Black–Scholes economy. This assumption, in addition to simplifying the analysis, allows one to focus on the impact on pension investment of two reference points, and makes it straightforward to examine some popular investment policies that already developed in a complete-market setting from a new perspective. Specifically, the financial setting is as follows.
• The only risk factor is stock market risk, and it is traded through a stock index S t following a geometric Brownian motion
where μ and σ are the constant drift and volatility parameters, and Z t is a standard Brownian motion.
• The riskless asset is a cash bond with constant interest rate r, whose price B t changes according to
• Thus the pricing kernel (stochastic discount factor) ξt is characterized by
where λ=(μ−r)/σ is the market price of risk.• We assume that the individual makes a single contribution at time t=0, and retires and receives pension at t=T. The value at time 0 of the contribution is denoted by W 0.
• We assume that two levels θ1 and θ2 have been defined which satisfy θ1<erTW 0<θ2 and which are referred to as the guaranteed level and the intention level, respectively. The corresponding annualized growth rates:
and will for concreteness be referred to as price inflation and wage inflation, respectively. The theory allows other interpretations as well, as long as the inequalities π1<r<π2 are satisfied; for instance π1 might correspond to a nominal guarantee.• We shall illustrate results by numerical examples. For this purpose, it is assumed that the economy is characterized by an annual risk-free interest rate of 3%, stock risk premium of 4% per year (i.e. μ=7%), stock market volatility of 20% per year, an annual price inflation of 2% and an annual wage inflation of 4%. The working life of the individual is 40 years. The present value of the contribution at time t=0 is 100. Thus the guaranteed and intention levels are 223 and 495, respectively. The parameter values are summarized in Table 1.
Table 1.The parameter values


 and
 will for concreteness be referred to as price inflation and wage inflation, respectively. The theory allows other interpretations as well, as long as the inequalities π1<r<π2 are satisfied; for instance π1 might correspond to a nominal guarantee.

3 Pension investment for the benchmark utility
To understand the benchmark utility function in the context of life-cycle investment, we now investigate the investment policy sought by the individual to optimize E[U(W T)]. In a complete market, such as the Black–Scholes economy, the optimal pension payoff as a function of the state of the economy can be obtained using the equivalent martingale method (Cox and Huang, Reference Cox and Huang1989), i.e.

where (U′)−1 denotes the inverse of the marginal utility function, and y is a Lagrange multiplier which is determined by the budget constraint E[ξTW T]=W 0. In the context of a collective pension fund, the budget constraint can be interpreted as imposing financial fairness between generations.
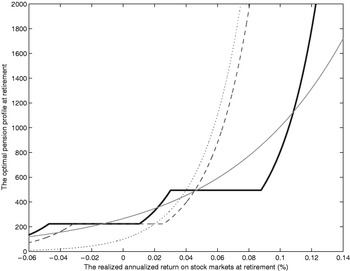
For the piecewise power utility function (2), one can solve the optimal profile of pension W T as a function of the value of pricing kernel at retirement ξT (see Appendix A.1.1). To make the optimal pension profile intuitively more appealing, Figure 2 plots the optimal pension as a function of the annualized return of stock markets. The optimal pension profile falls into five regions: three slopes connected by two plateaus. In the slope regions, the pension right is increasing with the return on the stock index. In the plateau regions, the pension benefit is constant at the reference levels, independent of stock index changes. The optimal profile of pension benefits can be characterized as a partial floor protection, attained at the cost of forgoing some upside potential of stock markets.
The optimal pension as a function of stock market return. This figure shows the optimal pension payoff for the utility function (2) as a function of the stock index return assuming the parameter values: κ=10, γ=1, θ1=223 and θ2=495 (bold line). For comparison, the figure also shows the optimal profiles for a CRRA utility (κ=1, γ=3; drawn line), the standard logarithmic utility (κ=1, γ=1; dotted line), and a utility function with only one kink (θ2=∞; dash-dotted line). For parameter values not mentioned here, see Table 1

The implication of the two reference points can also manifest itself through comparison with the optimal payoffs for alternative utility functions. Figure 2 also shows the payoffs optimal for the standard power preference and the loss-aversion preference. Berkelaar et al. (Reference Berkelaar, Kouwenberg and Post2004) show that loss aversion as expressed by a single reference point leads to a partial portfolio insurance strategy. In comparison with the loss-averse agent and the CRRA agent, the participant who uses two reference points gives up more payoff in good states of the financial market to finance a better downside protection.
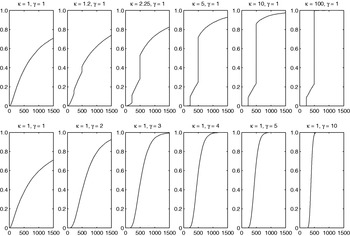
To illustrate the impact on the optimal pension benefit of the two parameters used in (3), κ and γ, Figure 3 presents the cumulative distribution of the optimal profile of pension benefits for various values of the parameters. The six plots on the first row, assuming γ=1, show the simulated cumulative distribution functions of the optimal pension benefits for varying values of κ. For κ greater than 1, the optimal profiles of pension benefits invariably feature probability clustering at the two reference levels, reflecting a partial portfolio insurance and selling of upside potentials. The clustering becomes more pronounced with increasing prominence of the reference points. For the level of kinkedness equal to the rate of loss aversion reported by Tversky and Kahneman (Reference Tversky and Kahneman1992), the probabilities of having pension benefits at the guaranteed and intention levels are about 9 and 25%, respectively. For κ=10, the clustering becomes dominant, with the probabilities increased to about 10 and 60%, respectively. If the effect of the reference points is so strong as to justify κ=100, then the optimal pension benefit is close to a binary payoff structure: the guaranteed level will be paid if the stock market index is below a certain level at retirement, otherwise the intention level will be paid. Actually, it can be shown that a binary payoff structure is optimal in the extreme case where γ=0 and κ=∞ (see Appendix A.2).
Cumulative distribution of the optimal pension for different values of κ and γ. The figure illustrates the impact of κ and γ on the optimal investment through simulated cumulative distribution function of the resulting pension value at time T. The plots on the first row are for fixed γ and varying values of κ, whereas those on the second row are for κ=1 and varying values of γ. For parameter values not mentioned here, see Table 1

The plots on the second row of Figure 3, assuming κ=1, present the distributions of the optimal pension benefits for varying degrees of risk aversion. In this case, the preference reduces to the standard CRRA. As discovered by Samuelson (Reference Samuelson1969) and Merton (Reference Merton1969) the CRRA individual finds it optimal for allocating a constant proportion of pension asset value in risky assets. This type of strategy, known as the ‘constant-proportion’ or ‘fixed-mix’ strategy, leads to a lognormally distributed profile of pension benefit in an economy of the Black–Scholes type. In a given financial market, the proportion in risky assets is determined by the rate of relative risk aversion: in the Black–Scholes economy, the proportion of pension assets in risky assets is λ/σγ, where λ is the market price of risk as introduced before. As shown in Figure 3, the variability of the lognormally distributed pension benefits generated by this strategy is decreasing with the degree of risk aversion. For CRRA preference, an increasing degree of risk aversion will make pension benefits concentrate more and more on a single value, rather than on the two reference levels as in the case of kinked utility. The difference highlights that κ and γ in the utility function (3) reflect different aspects of preference.
To complete the discussion on the investment policy for the benchmark class of utility functions, we turn to the investment strategy needed to realize the optimal profile of pension rights at retirement. The optimal pension can be viewed as a contingent payoff that can be replicated by a delta replication strategy. The fundamental theorem of asset pricing tells us that the process {ξtW t} is a martingale, so the optimal pension asset value W t at time t (⩽T) satisfies

Following this approach, one can solve the optimal pension asset value W t as a function of time t and the value of the pricing kernel (W t=f(t, ξt)).
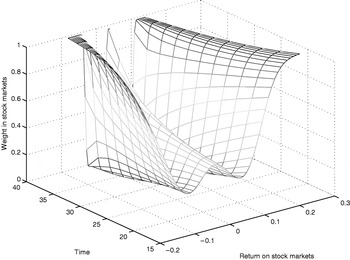
Given the one-to-one correspondence between the pricing kernel and the stock price in the Black–Scholes economy, the optimal pension asset value can also be expressed as a function of time and of the stock index value S t, i.e. W t=g(t, S t). The holdings of risky assets (‘delta’) can be determined by the partial derivative of the optimal pension asset value at time t with respect to the stock market level at time t. As an alternative to computing the delta, we characterize the optimal investment strategy by the weight of pension asset value invested in the stock index (see Appendix A.1.2). Figure 4 illustrates the optimal investment policy by presenting the stock weight as a function of time and the stock market return (only the weights for the last 20 years are shown for ease of viewing). The investment strategy requires a sophisticated, dynamic adjustment of the stock weight depending on time and on the realized return on stock markets. The relation between the weight and the return on stock markets is of a ‘W’ shape. The intuition is as follows. When the return on stock markets is at such levels that it is likely to realize the guaranteed or intention levels, then a low weight in risky assets is needed to ascertain the realization of the reference levels. However, if it is very unlikely for the terminal pension asset value to be at the two reference levels because of, for instance, very strong or weak stock markets, then the pension fund will behave like a constant-relative-risk-averse investor with no kinks, and the weight in risky assets is approaching that required by a constant proportion strategy.Footnote 1 This effect is in particular strong at times close to maturity. In scenarios where stock returns are good for some time but then go down, the optimal strategy reduces the stock holdings when bad returns appear, so as to reach at least the upper threshold with high probability.
The optimal stock weight. The figure shows the optimal stock weight as a function of time and return on stock markets. The ‘time’ axis represents the calender time, whereas the ‘return on stock market’ axis the return on the stock index so far. It is assumed that κ=10 and γ=1. For parameter values not mentioned here, see Table 1

4 Conditional indexation schemes
As mentioned above, a defining property of conditional indexation schemes is that the guaranteed amount of pension is adjusted over time. For instance, if a participant is granted full indexation to wage inflation each year after her entry into the fund, then the two thresholds will converge with the guaranteed amount approaching the intention amount at retirement. On the other hand, if the participant is so unlucky as to receive no indexation at all during the entire working life, then the guaranteed amount at retirement will be same as the amount that was already guaranteed at the time of entry.
Given the diversity of conditional indexation schemes, it is far from being trivial to ask which one to take as the subject of welfare analysis. Our purpose in this paper is to construct pension schemes with the defining property of dynamically adjusted guaranteed level as stylized conditional indexation schemes. The current practice of conditional indexation is implemented collectively by pension funds, and some studies show that the resulting conditional indexation schemes are not necessarily financially fair on a generation-by-generation basis in the sense that the value of the pension payoff may not be equal to the value of the contribution. It has been estimated that redistribution of wealth may reach 30% or more of the value of the liabilities (Kocken, Reference Kocken2007; p. 37) (cf. also Kocken (Reference Kocken2006) for a more extensive theoretical analysis). For the purpose of welfare analysis, it is necessary to impose the condition of financial fairness, since the absence of financial fairness implies that one individual can be arbitrarily better off through wealth transfer from others. Therefore, in the construction of stylized schemes, we impose the condition of financial fairness.
The construction of the stylized conditional indexation schemes starts with a digital contingent claim at time 0. Such a claim is optimal under a kinked utility function with γ=0 and κ=∞ (a piecewise linear function which drops to −∞ at the guaranteed level and which saturates at the intention level). The claim is written on the stock index, and at retirement pays the guaranteed level θ1, if the index is below a certain strike; otherwise it pays the intention level θ2. At time 0, the value of the option is equal to the contribution value, W 0. In the Black–Scholes economy, the given θ1, θ2, and the option value W 0 determine the strike of the option as in (16). Browne (Reference Browne1999) shows that the policy to maximize the probability of reaching a given value wealth by a deadline is to buy a European digital option with a particular strike price and payoff. Applying Browne's insight, one can show that the digital claim maximizes the probability of reaching the intention level while subject to the constraint of not falling short of the guaranteed level. At time 0, the probability of reaching the intention level is determined by

where Φ−1(⋅) denotes the inverse of the standard normal cumulative distribution function. The above equation for p is well defined only for e−rTθ1⩽W 0⩽e−rTθ2, where the scheme is reduced to the all-bond scheme for W 0=e−rTθ2. In the following welfare analysis, the case where W 0>e−rTθ2 may arise. In such a case, we use the all-bond scheme with payoff W T=e−rTW 0 to replace both the digital scheme and the stylized conditional indexation scheme constructed on the basis of the digital scheme.
The digital option by itself reflects the idea of a guaranteed level, but not the idea of conditional indexation. We would like to increase the guaranteed level when circumstances allow. Assume that circumstances are indeed found favorable at a first review date following time 0; then it is possible to sell the digital option that was purchased at time 0 and to buy a new digital option that has an increased lower level. The self-financing property of the strategy is guaranteed by requiring that the value of the newly bought option at the time of its purchase is equal to the value of the previously owned option at that time.
In this way, we obtain one constraint on the characteristics of the new option to be bought. However, a digital option is characterized by three parameters (upper level, lower level, and strike) so that two degrees of freedom remain. As a second constraint, we impose that the intention level θ2 remains the same. The third constraint might be provided by imposing that the strike also remains the same, but a more basic requirement may be that the probability of reaching the upper level is kept constant. This may be motivated if one thinks of the size of the investment at time 0 as reflecting an implicit decision on the probability of reaching the intention level, via the relation (5).
Under the proposed rules, high returns on the stock market will result in an increase of the guaranteed level, while both the intention level and the probability of reaching that level remain constant. Under the assumptions of the Black–Scholes market, we can and will consider a continuous-time version of the proposed strategy; moreover, using the completeness of the Black–Scholes market, the process of buying and selling options can be replicated by suitable portfolio rebalancings. We will consider two versions of the proposed scheme; one in which the rules as stated above are applied irrespective of stock returns, so that also downward adjustments may take place, and another (which is closer to practice) in which adjustments in the downward direction are not made and one accepts that under adverse circumstances the probability of reaching the intention level decreases.
4.1 The updating rules
4.1.1 Version I: two-way adjustment
This rule prescribes that the probability of reaching the intention level be constant over time. In particular, if the probability of reaching the intention level increases (decreases) due to an upturn (downturn) of the stock index, then the strike denoted by K t(1) is adjusted upwards (downwards) to the level that restores the probability to the benchmark p. At the same time, the guaranteed level, denoted by θ1,t(1), is increased (decreased) to ensure that the update is self-financing. This scheme is mainly of academic interest; a more realistic scheme that allows only one-way adjustment is described below. Appendix A.3 shows that the two-way adjustment rule leads to dynamics of the strike K t(1) and guaranteed level θ1,t(1) for t<T given by


where

As an alternative to the stochastic differential equation (6), the dynamics of the strike can be explicitly expressed as a function of the stock index value:

As can be seen from (8), the strike tends to the stock index as t approaches T, which implies that the investment policy is to take an increasingly sensitive bet in the form of digital options that are increasingly at the money. For the dynamics of the guaranteed level, it can be shown that

that is, the guaranteed levels converge in probability to the intention level as t approaches T (see Appendix A.3). This is not surprising given that the drift and volatility terms of (7) ‘explode’ as t approaches T unless the guaranteed level converges to the intention level.
4.1.2 Version II: ratchet adjustment
This rule introduces a ‘ratchet’ effect by allowing only upward adjustment of the guaranteed level. In a nutshell, the updating rule is to keep the probability of reaching the intention level no higher than the benchmark p. The updating is the same as version I in the case of stock market upturns: if the stock markets rise, and the probability of reaching the intention level rises above the benchmark, then the strike and the guaranteed level are adjusted upwards in such a way as to restore the probability to the benchmark. In the case of stock market downturns where the probability falls short of the benchmark, however, the strike and the guaranteed level are unchanged. As such, the strike, K t(2), and the guaranteed level, θ1,t(2), can be adjusted upward only. The strike resulting from this version of conditional indexation, denoted by K t(2), is the running maximum of the strike from version I (see Appendix A.3), i.e.

Given the dynamics of the strike, one can determine the updating of the guaranteed level by the requirement that the value of the updated pension rights should be unchanged. The SDE for the guaranteed level is not of a simple form, so it is omitted here. We only note that the running-maximum relationship does not hold for the guaranteed levels.
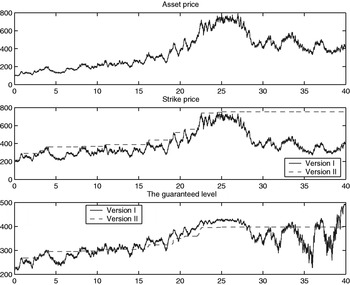
Figure 5 presents a simulated history of the strikes and guaranteed levels for the two updating rules. It illustrates the increasing volatility of the guaranteed level on the basis of the first version as t approaches T, and the running-maximum relationship between the strike prices resulting from the two rules.
Simulated histories of the strike and the guaranteed level. The upper panel is a simulated scenario of the stock index over 40 years, and the corresponding histories of the strike and the guaranteed level are in the middle and lower panels, respectively. In the middle and lower panels, the histories based on the two-way updating rule are represented by a solid line, and those based on the ratchet updating by a dashed line. For the parameter values of the simulation, see Table 1

4.2 The pension rights of the conditional indexation schemes
We now want to see the effect of both strategies on W T, the realized capital at time T. First, define by continuity the values of the strikes and the guaranteed levels at time T for both updating rules, that is,

The pension rights resulting from the two versions of conditional indexation, W T(1) and W T(2), are then

For the conditional indexation of version I, given that the guaranteed level converges to the intention level in probability, the pension rights at retirement also converge to the intention level. This is a peculiar outcome since it appears to construct an arbitrage opportunity; the proposed investment strategy seems to ensure a return that is higher than the riskless return. The explanation is that this version of conditional indexation allows ‘outrageous’ investment behavior, which violates the admissibility assumption in the finance literature (see e.g. Section 6.C of Duffie (Reference Duffie2001) ) Like the well-known ‘doubling’ strategy, the first version of conditional indexation involves shorting more and more of the riskless asset and going long in the risky asset in some states of nature, and it has to allow the possibility that pension asset value can go negative and be unbounded from below before the intention level is actually attained. Investment strategies of this nature are usually ruled out in the finance literature by the admissibility assumption, which either prohibits the wealth process from going negative or imposes a square-integrability condition.
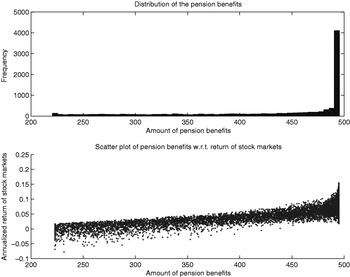
For the ratchet indexation, Figure 6 presents the distribution of the pension rights in our standard example. Also shown is the relation between the pension rights and the annualized return on stock markets. In addition to the notable concentration on the two original thresholds, the pension rights generated by ratchet conditional indexation have considerable probability of falling in the intermediate region between the two thresholds. The pension rights are path-dependent, rather than dependent solely on the stock index level at retirement. The resultant pension scheme will be used as the stylized conditional indexation scheme in the following welfare analysis.
The pension benefits resulting from the ratchet conditional indexation. The figure shows the pension profile from the ratchet rule of conditional indexation. The upper panel presents a simulated histogram of the pension rights, whereas the lower panel illustrates the relation between the return on the stock index and the amount of pension rights. The number of simulations is 10 000. See Section 2.2 for the parameter values of the simulations

5 Welfare analysis
By now we have set up the criterion and the subject of the welfare analysis. To apply welfare analysis to the stylized conditional indexation scheme against the utility function (2), we have to resort to numerical methods because of the absence of an analytical solution. Therefore we need to choose the value of parameters characterizing the benchmark utility, in particular, κ and γ. Tversky and Kahneman (Reference Tversky and Kahneman1992), based on psychological experiments, estimate that the rates of local relative risk aversion are rather small (+0.12 in the gain region, and −0.12 in the loss region).Footnote 2 Most of the literature on the application of the idea of loss aversion to finance (e.g. Ait-Sahalia and Brandt (Reference Ait-Sahalia and Brandt2001), Barberis et al. (Reference Barberis, Huang and Santos2001), Berkelaar et al. (Reference Berkelaar, Kouwenberg and Post2004) and Gomes (Reference Gomes2005) ), assumes that the coefficient of local relative risk aversion is between 0 and 1. We shall take γ=1 in the following. As for κ, the estimated value of 2.25 that Tversky and Kahneman (Reference Tversky and Kahneman1992) obtain in the context of loss aversion is on the basis of the choices of a group of individuals facing hypothetical decision problems. Given the critical importance of retirement income security, a higher degree of kinkedness may be reasonable. In addition, the standard CRRA utility will be included as a special case of (2). Thus we consider κ∊{1, 2.25, 5, 10, 100}.
The purpose of the welfare analysis is to assess the quality of conditional indexation schemes to individuals whose preference is characterized by the family of utility functions (2) in the context of life cycle investment. The performance is measured by welfare loss in terms of the additional contribution value required for a pension scheme to reach the same level of expected utility as is obtained from the optimal strategy. Apart from the stylized conditional indexation scheme, other pension schemes are considered for comparison purposes (see Appendix A.4 for the computation of expected utility of these schemes).
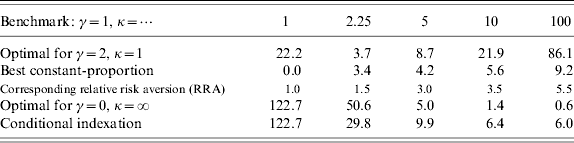
First consider the pension schemes resulting from constant-proportion strategies characterized by different stock weights. The second row of Table 2 shows results for a scheme with a constant stock weight of 50%, which, in the numerical setting as given in Table 1, is optimal for the CRRA preference when the coefficient of relative risk aversion is equal to 2. If the benchmark utility is the standard logarithmic utility (κ=1), the welfare loss of this constant-proportion scheme is substantial because of insufficient risk taking: over 20% more contribution is needed for the scheme to obtain the same level of expected utility as the optimal strategy, which is a constant-proportion scheme with 100% stock weight. If the two reference points are present in the individual preference, and their significance is moderate with κ=2.25, then this scheme looks much better with welfare loss less than 4%. The two kinks introduce first-order risk aversion, and hence make the 50%-stock-weight scheme look more favorable against the kinked benchmark utility than against the logarithmic benchmark. From this perspective, the parameters κ and γ, albeit reflecting different aspects of preference, substitute for each other to some extent. As the kinkedness parameter increases, however, the welfare loss increases considerably. A plausible explanation of large welfare loss for large κ value is that an individual with strongly kinked utility favors good downside protection at the cost of giving up upside potential, in which respect the constant-proportion scheme is poor.
The welfare loss of various schemes against the benchmark utility with different parameter values (in percent). The table reports the welfare loss in terms of the additional percentage of contribution value which is required for a pension scheme to reach the same level of expected utility as is obtained from the optimal strategy. The numbers in smaller font are the rates of relative risk aversion corresponding to the best constant-proportion schemes. Notice that the first column (κ=1) actually uses the standard logarithmic utility as the benchmark
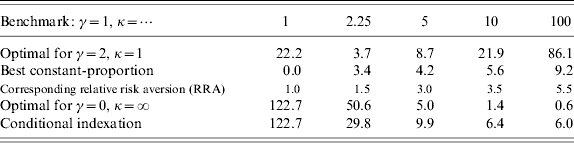
In the sphere of constant-proportion strategies, one can vary the stock weight in order to maximize the expected utility with respect to the (possibly kinked) benchmark utility. We refer to the optimal constant-proportion schemes with respect to the benchmark utility as the best constant-proportion scheme. When the benchmark is reduced to the logarithmic utility, the best constant-proportion scheme has no welfare loss simply because the scheme keeps stock weight equal to the level required by the logarithmic utility. As can be seen from the third row of Table 2 for kinked benchmark utility, the welfare loss of the best constant-proportion schemes is increasing with the kinkedness parameter. Welfare losses reflect the inability of constant-proportion schemes to provide downside protection required by the kinked benchmark utility. Moreover, for a more kinked benchmark, the best constant-proportion scheme decreases risk taking, as is seen from the fact that the rate of relative risk aversion corresponding to the stock weight of the scheme (shown in smaller font in the table) is increasing with κ.
Another scheme we consider for comparison is the rigid digital scheme, which at retirement pays the guaranteed level if the stock index is below the strike given by (16), and pays the intention level otherwise. As mentioned above, the digital scheme forms the basis of the construction of the stylized conditional indexation scheme, and is optimal with respect to the kinked utility function (2) with κ=∞ and γ=0. The digital scheme suffers from welfare loss in that (i) it assumes the greatest possible strength of the reference points (κ=∞), and (ii) it assumes local risk neutrality (γ=0). As shown in the fourth row of Table 2, the digital scheme's welfare loss decreases with the value of the kinkedness parameter κ used in the benchmark utility. When κ⩾10, the welfare loss becomes rather small. It is a natural outcome, recalling that the pension profile which is optimal for a kinked benchmark utility with large values of κ resembles the payoff of a digital option as illustrated in Figure 3.
The stylized conditional indexation scheme, the focus of the welfare analysis, is built on the basis of the digital scheme through updating the lower threshold over time. As the bottom row of Table 2 shows, like the digital scheme, the conditional indexation scheme incurs a welfare loss, which is decreasing with the kinkedness of the benchmark utility. For an individual with logarithmic or a mildly kinked utility (κ=1 or 2.25), the utility loss of the conditional indexation scheme (and the digital scheme) is significant. Against the logarithmic benchmark, for the conditional indexation scheme and the digital scheme to achieve the same utility level as is obtained by the optimal scheme, it is insufficient that the contribution is increased to such a level that the probability of reaching the intention level is one, i.e. to the level equal to θ2e−rT. As mentioned earlier, the two schemes are assumed to be reduced to the all-bond scheme with payoff equal to e−rTW 0, and the welfare loss is computed accordingly.
In comparison with the digital scheme, the dynamic updating of the guaranteed level introduces another element of suboptimality with respect to the benchmark utility, namely a non-constant lower reference point. It perhaps accounts for the welfare loss of the conditional indexation scheme being higher than that of the digital scheme in the case where κ⩾5. Nevertheless, against the strongly kinked benchmark utility (e.g. κ⩾10 or 100), the stylized conditional indexation scheme is close to the optimal as it has a moderate welfare loss of about 6%. In short, for individuals in whose preference the reference points play little role, the stylized conditional indexation scheme leads to material welfare loss, while for those paying much attention to the references, the scheme offers a reasonable option for retirement savings from the point of view of welfare analysis.
6 Concluding remarks
In this paper, we have used welfare analysis to evaluate the performance of conditional indexation schemes from a life-cycle investment perspective. This type of analysis is usually applied to study the effect of constraints. Conditional indexation in principle is not a constraint, but effectively such schemes imposed by compulsory participation cannot be undone by participants without costs, and they are taken as a given by most people. For this reason, the welfare analysis on the basis of a frictionless financial market, where participants actually need not care about the suboptimality of pension schemes in that they are capable of undoing any financial contracts and achieving their optimal investment profile themselves free of cost, is still relevant in providing insights into the performance of conditional indexation schemes in practice.
For the purpose of this analysis, we needed to establish both the criterion and the subject of the utility analysis, namely a benchmark utility and representative conditional indexation schemes. To do justice to the two reference points which underlie the formulation of conditional indexation and which often stand out in the discussion of pension provision, we propose as the benchmark utility an extended family of CRRA utility functions which accommodate the presence of reference points. The two reference points, as reflected by kinks in the utility function, lead to a pension investment policy with partial floor protection attained at the cost of forgoing some upside potential. The stylized conditional indexation scheme subject to welfare analysis is constructed to have a ratchet-adjusted guaranteed level, reflecting common practice. Possibly deviating from practice, the stylized scheme is financially fair because it is constructed on a self-financing basis. The property of financial fairness ensures that it makes sense to investigate conditional indexation schemes by means of utility analysis, and that such schemes are comparable with life-cycle investment policies.
Some numerical exercises show the influence of reference in the benchmark utility on the evaluation outcome of the stylized conditional indexation scheme. If the effect of the reference points is weak or even absent, the conditional indexation incurs substantial utility loss. If, however, the reference points are significant in preference, the scheme offers a reasonably good approach to pension provision as the welfare loss vis-à-vis the optimal is moderate. Conversely, increasing attention to conditional indexation may therefore be viewed as evidence of the presence and significance of reference points in participants' evaluation of pension provision.
The stylized conditional indexation scheme has been formulated in such a way that it can be implemented by an individual. However, the implementation of conditional indexation is usually done by collective funds. The collective implementation may play a role in saving transaction costs and hence have an impact on the evaluation of pension schemes. It is a point beyond the scope of this paper, which invites further research. Another avenue for further research will be to use more realistic financial settings, for example, stochastic inflation rates and the possible long-term predictability of asset returns.
A Appendix
A.1 Derivation of the optimal pension profile WT and investment strategy under piecewise power utility
A.1.1 The optimal pension profile WT
The marginal utility function of the piecewise power utility (2) isFootnote 3

Then the optimal pension profile at time T can be obtained by the Cox and Huang (Reference Cox and Huang1989) approach as expressed in (3);Footnote 4 in particular,

where  ,
 ,
 and
 .
A.1.2 The optimal investment strategy
By substituting (12) into (4) and after some straightforward but somewhat tedious calculus, one can obtain the optimal wealth at time 0⩽t<T

where Φ(·) denotes the cumulative standard normal distribution function, and


Applying the Itô rule to the expression of W t (13), one can describe the optimal wealth process by a stochastic differential equation. Alternatively, one can in the Black–Scholes economy characterize any self-financing wealth process by the following stochastic differential equation:

where w t denotes the stock weight at time t. Equating the diffusion parts of the two above-mentioned stochastic differential equations leads to the the optimal weight of risky assets at time 0⩽t<T

where φ(·) is the standard normal density function.
A.2 The optimal profile of pension rights in the special case where γ=0 and κ→∞
For the extreme case where γ=0 and κ→∞, the utility function (2) is reduced to

As in the more general case, using the equivalent martingale approach of Cox and Huang (Reference Cox and Huang1989) for the utility can lead to optimal profile of pension rights contingent on the pricing kernel ξ T:

where

where Φ−1(·) denotes the inverse of the standard normal cumulative distribution function. Given the one-to-one relation between the pricing kernel and the stock index value in the Black–Scholes model, we can express the optimal profile in terms of the stock index value S T:

where

A.3 The dynamics of the strike and lower threshold in conditional indexation
A.3.1 Version I
Given the rule that the probability of reaching the intention level is unchanged over time, we have

Conditioning on the stock index value S t at time t, S T can be expressed as

where Z is a standard normal variable. Inserting the expression into (17) generates the dynamics of the strike price as expressed by (8). Applying the Itô rule to (8), one obtains the characterization of the strike price by stochastic differential equation (6). Consider a European digital option which pays 0 at T if the stock price is lower than the strike, and pays 1 otherwise. We allow the strike K t to change over time, and denote the pricing formula of the digital option by F(K t, S t, t). Given the dynamics of the strike price from version I of conditional indexation, the pricing formula of the digital option F(K t(1), S t, t) is simply a deterministic function F 1(t)

where

For the dynamics of the guaranteed level, consider the updating in discrete time first. At time t, the pension value is

At the time t+Δt before applying conditional indexation, the pension value changes to

The pension value after conditional indexation is

Since the conditional indexation does not change the pension value at time t+Δt, we have Wt+Δt=W′t+Δt and then the adjustment of θ1,t(1) is given by

One can decompose the term F(K t+Δt(1), S t+Δt, t+Δt)−F(K t(1), S t+Δt, t+Δt) in the numerator as

For the first term on the right-hand side of (18), we have

where o(·) denotes the higher order term. For the second term on the right-hand side of (18), F(k t(1), S t+Δt, t+Δt)−F(k t(1), S t, t), the difference is taken on the basis of fixed strike price, and hence is the difference of the value of a digital option with fixed strike price. We use F 2(S t, t) to denote the digital option pricing formula with a fixed strike K, and

where

On the basis of the Itô rule, one has

Because dF 2(S t, t) is equal to F(k t(1), S t+Δt, t+Δt)−F(K t(1), S t, t) and because, for K=K t(1), d(K, t)=d(1)(t), one can write

Substituting (19) and (20) into (18), one gets

which in continuous time converges to (7). Thus at last we obtain the stochastic differential equation characterizing the evolution of the guaranteed level in continuous time.
Next we shall show that the guaranteed level reaches the intention level before time T almost surely. Consider first the stochastic process

Applying the Itô rule to the logarithmic transformation Y t=log X t leads to

or

Thus one has

Karatzas and Shreve (Reference Karatzas and Shreve1998) (Section 1.2) show that under the time change t=T−Te−s,  is a Brownian motion defined for 0⩽s<∞. The time-changed stochastic process is

Consequently,

where the notation ‘p-lim’ denotes convergence in probability. Thus, for the stochastic process θ1,t defined by

it holds that p-limt↑T θ1,t=θ2.
We now turn to the case in which θ1,t is defined by (7). Multiplying the right-hand side of (21) by φ(d(1)(t))/(1−Φ(d(1)(t))) will result in (7). Given that the term φ(d(1)(t))/(1−Φ(d(1)(t))) is continuous, and tends to a finite constant as time approaches T, it also holds that  in this case.
A.3.2 Version II
In this appendix, we shall motivate the rule of conditional indexation as given by (9) through the case of discrete updating. First of all, by definition one has

Next we show that the running-maximum relationship holds for any time t+Δt through mathematical induction. Assume that the statement holds for time t, i. e.

The probability of reaching the intention level at time t+Δt before updating the strike is

and the strike price is updated by

Given this assumption, one can verify that

Thus we have proved that for discrete updating, the strike price from version II is the running maximum of that from version I, which motivates the rule given by (9) in continuous time.
A.4 Expected utility computation
The appendix shows the computation of the expected utility of the schemes studied in Section 5 with respect to the piecewise power utility. For the scheme with the ratchet conditional indexation, the expected utility can be obtained through Monte Carlo simulations. For the other schemes, analytical formulae can be obtained through integral calculus.
A.4.1 The expected utility of the optimal strategy

where

A.4.2 The expected utility of the digital scheme which is optimal for the utility with κ=∞ and γ=0
As shown in Appendix A. 2, if the benchmark utility function (2) has the following parameter values: κ=∞ and γ=0 then the optimal pension profile reduces to a digital option. Against the general form of utility function (2), the expected utility of the digital scheme is

where p is determined by (5).
A.4.3 The expected utility of the constant-proportion strategy
Let γc denote the coefficient of relative risk aversion underlying a constant-proportion strategy. The stock weight of the constant-proportion strategy is

and the pension rights are

The expected utility derived from the constant-proportion strategy with stock weight w c is

where