Introduction
Introduced grasses vigorously invade across a wide range of arid and semiarid ecosystems and have colonized all continents, including Antarctica (D’Antonio and Vitousek Reference D’Antonio and Vitousek1992; Molina-Montenegro et al. Reference Molina-Montenegro, Carrasco-Urra, Rodrigo, Convey, Valladares and Gianoli2012). Once introduced, invasive grasses have been shown to outcompete native species through a variety of strategies: particularly faster uptake of ecosystem-limited resources, especially when transitioning from a dormant state (Van Auken and Bush Reference Van Auken and Bush1990; Ward et al. Reference Ward, Smith and McClaran2006); growing densely to obstruct other species from insolation (Bush and Van Auken Reference Bush and Van Auken1987); and high propagule pressure (Lonsdale Reference Lonsdale1999; Richardson and Pyšek Reference Richardson and Pyšek2006). Invasive grasses can also alter the ecosystem fire regime, which has been shown to be a primary factor of long-term successful grass invasion, even in competition with native grasses (D’Antonio and Vitousek Reference D’Antonio and Vitousek1992). For example, in Australia, invasive Rhodesian bluestem (Andropogon gayanus Kunth) produced a fuel load many times greater than in the areas dominated by native grasses. This significantly altered the fire regime in favor of A. gayanus and sped up the rate of its invasion (Rossiter et al. Reference Rossiter, Setterfield, Douglas and Hutley2003).
Management Implications
The results from this study imply that prioritizing discovery and control of newly invaded areas over the removal of known large invaded areas has the potential to be an effective and tractable invasive species control strategy for Pennisetum ciliare (buffelgrass). Finding new P. ciliare occurrences may be difficult within large uninvaded areas and perhaps may require more public justification compared with controlling known invaded areas. Removing newly established P. ciliare plants the farthest from the existing invaded areas has the potential to reduce P. ciliare invasion rates from exponential expansion to a more tractable quadratic expansion. Given the potential high expansion rates of P. ciliare, managers of lands prone to P. ciliare invasion likely need to impress policy makers and funding bodies of the need for timely action. Delaying the start of a control program by even a few years might allow the invaded area to expand beyond the economic threshold for control action.
While the impacts of invasive grasses have been well documented, finding successful strategies to control or remove invasive grasses remains difficult, particularly once the species begins to move beyond the site of initial introduction (DiTomaso Reference DiTomaso2000; DiTomaso et al. Reference DiTomaso, Masters and Peterson2010). Plant dispersion patterns have been shown to be a particularly important characteristic of invasions (Lookingbill et al. Reference Lookingbill, Minor, Bukach, Ferrari and Wainger2014; Sebert-Cuvillier et al. Reference Sebert-Cuvillier, Simonet, Simon-Goyheneche, Paccaut, Goubet and Decocq2010) and not only influence reinvasion risk, but can also lead to exponentially greater expansion rates depending on the type of plant dispersion (Cannas et al. Reference Cannas, Marco and Montemurro2006; Moody and Mack Reference Moody and Mack1988).
There are two primary, detectable plant dispersion patterns: (1) invasion along the edge of existing patches (i.e., an “invasion front,” whereby new plants establish along the edges of the source population) and (2) establishment of satellite populations (i.e., “satellite dispersion,” whereby new plants establish both along the front and in newly established patches distinct from the source population). These satellite populations become new source populations, and this kind of dispersion can lead to exponentially greater invasion rates compared with an invasion front dispersion (Shigesada and Kawasaki Reference Shigesada and Kawasaki1997).
Invasion front and satellite dispersion require different control strategies. If an invasion front is the primary dispersion pattern, a removal strategy emphasizing encircling invaded patches would be efficient, and the risk of reinvasion from distant source patches would be low (Cannas et al. Reference Cannas, Marco and Montemurro2006). Conversely, if satellite dispersion commonly occurs, then targeted removal of nascent satellite populations has been shown to best slow or control the invasion (Moody and Mack Reference Moody and Mack1988). This is because new satellite establishment increases the area of imminent invasion risk. In such situations, research has suggested that removing the satellites farthest from invasion fronts will generally bring the greatest reduction of further invasion risk (Lookingbill et al. Reference Lookingbill, Minor, Bukach, Ferrari and Wainger2014; Sebert-Cuvillier et al. Reference Sebert-Cuvillier, Simonet, Simon-Goyheneche, Paccaut, Goubet and Decocq2010).
In addition to understanding dispersion pattern, it is critical to understand cumulative expansion rate in order to formulate an effective control strategy (Fensham et al. Reference Fensham, Donald and Dwyer2013; Lookingbill et al. Reference Lookingbill, Minor, Bukach, Ferrari and Wainger2014). Expansion rates inform land managers about the total resources needed to control expansion of an invasive species (Olsson et al. Reference Olsson, Betancourt, Crimmins and Marsh2012a), they allow determination of areas at greatest risk for further invasion (Cannas et al. Reference Cannas, Marco and Montemurro2006; Higgins et al. Reference Higgins, Richardson and Cowling1996), and they help managers estimate the consequences of lags between detection and control efforts.
Buffelgrass [Pennisetum ciliare (L.) Link, synonym: Cenchrus ciliaris L.], a C4 perennial grass from Africa (Cox et al. Reference Cox, Martin, Ibarra, Fourie, Rethman and Wilcox1988) with a nearly worldwide distribution (reviewed in Lyons et al. Reference Lyons, Maldonado-Leal and Owen2013; Rogstad Reference Rogstad2008), is an ideal species to test ideas about expansion rates to inform control strategies. The invasion success of P. ciliare, like that of most invasive grasses, is due in part to its seed dispersal (Ernst et al. Reference Ernst, Veenendaal and Kebkile1992), low water requirements for germination (Ward et al. Reference Ward, Smith and McClaran2006), high drought tolerance, and quick uptake of water from senescence (Reynolds et al. Reference Reynolds, Kemp, Ogle and Fernández2004). Pennisetum ciliare can become dominant in the Sonoran Desert even without disturbances (Olsson et al. Reference Olsson, Betancourt, McClaran and Marsh2012b), but the cycle of increased fine fuels and dry-lightning-ignited fires fostered by P. ciliare threatens plant community conversion to an African-type grassland with little diversity and few native plants (Lyons et al. Reference Lyons, Maldonado-Leal and Owen2013; McDonald and McPherson Reference McDonald and McPherson2011; Olsson et al. Reference Olsson, Betancourt, Crimmins and Marsh2012a).
Mechanical removal and herbicides can successfully control P. ciliare, at least in the short term (e.g., Jernigan et al. Reference Jernigan, McClaran, Biedenbender and Fehmi2016), but land managers have struggled to develop successful long-term control strategies for large areas (Rogstad Reference Rogstad2008). Reinvasion of P. ciliare has been linked to propagule pressure, seed dispersal radius, and seedbank persistence of 3 to 4 yr (Fensham et al. Reference Fensham, Donald and Dwyer2013; Winkworth Reference Winkworth1971). Thus, even if a local P. ciliare population is removed, land managers must continue managing for seedling emergence from the seedbank and recruitment from regional sources, due to propagule pressure and seed dispersal radius.
Olsson et al. (Reference Olsson, Betancourt, Crimmins and Marsh2012a) found that P. ciliare patches double in size an average of every 5.1 yr, with a range of 2 to 7 yr. However, the patches in the Olsson et al. (Reference Olsson, Betancourt, Crimmins and Marsh2012a) study were long term, based on data collected from patches established for 14 to 20 yr. These late-stage invasion results may reflect constrained patch expansion due to colonization of the majority of suitable habitat and may not be applicable to new invasions. This is especially relevant if there is a high incidence of satellite dispersion by P. ciliare; if nascent satellites expand at a faster rate than existing larger patches and merge with other patches over time, the before and after expansion rates will include both the satellite and front effects. Because P. ciliare is still actively invading in the Sonoran Desert and throughout the world, the purpose of our study was to determine P. ciliare dispersion patterns and expansion rates of newly invaded territories, focusing specifically on expansion of satellites, patch size, and patch growth rates. If it can be determined that P. ciliare invades using a satellite dispersion strategy, land managers can improve their control strategies by targeting new satellite populations. Further, if expansion rates of new patches are faster than those of long-standing patches, land managers will have a more accurate timeline to design their removal strategies.
Materials and Methods
Study Area
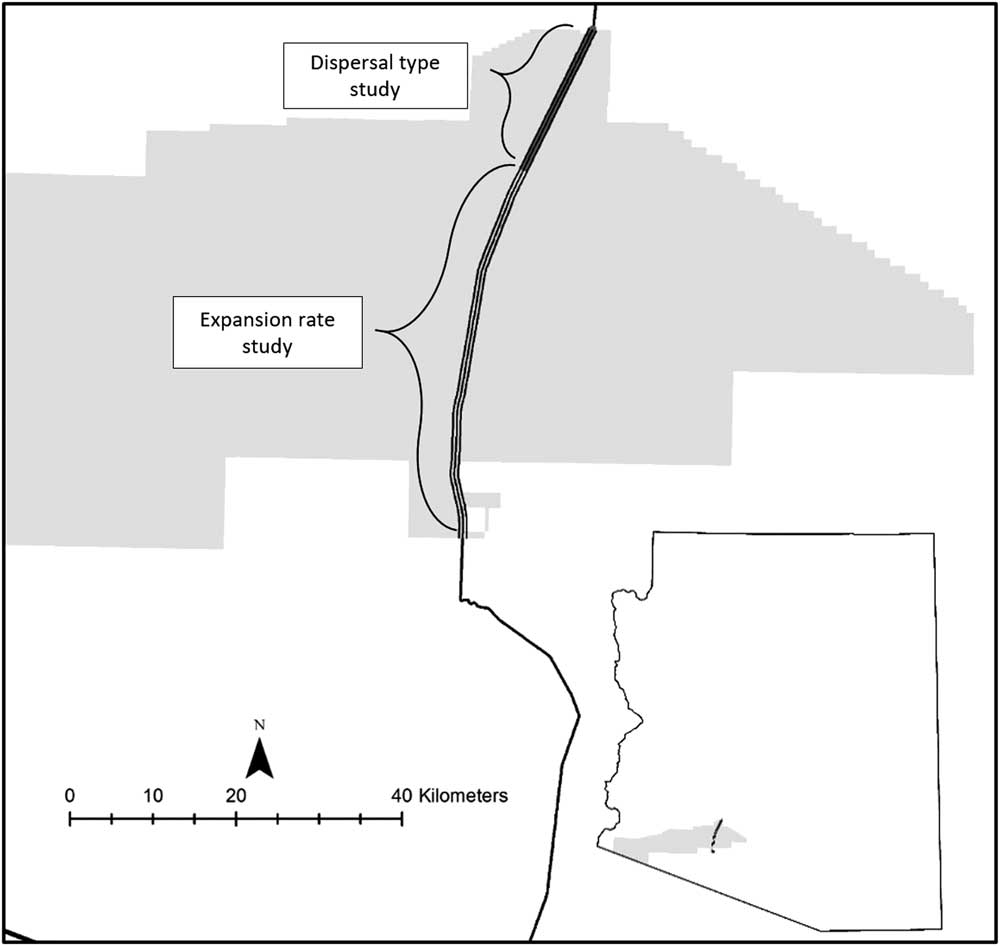
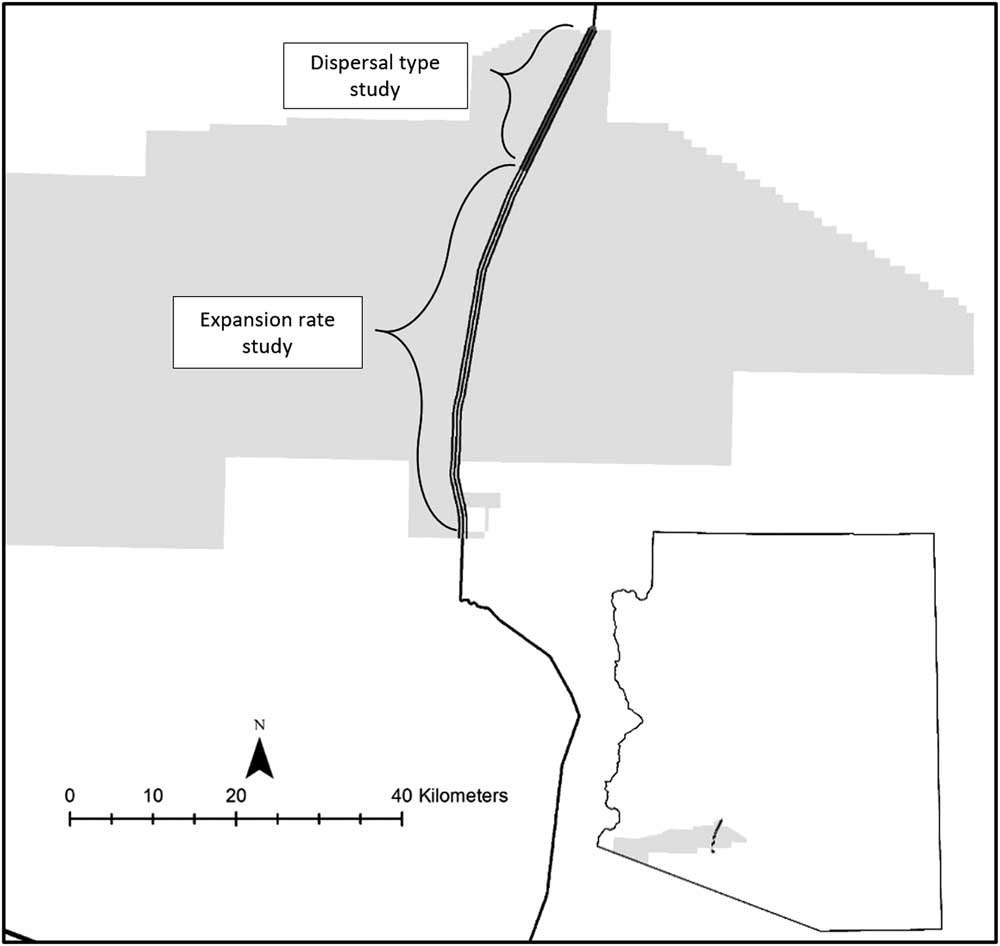
The study was conducted on the right-of-way of a roadway in southern Arizona, USA (32.854444°N, 112.768333°W). The paved public roadway traverses a military reservation. The contiguous area within 1 km of the study area was wildlands. The roadway has little traffic and connects the town of Ajo, AZ, to Gila Bend, AZ, both with populations of a few thousand people. There was an average distance of 60 m from the edge of the roadway to a fence. The fence defined the right-of-way, which was physically changed by the road (e.g., through water distribution and likely increased water availability). The relatively undisturbed land outside the right-of-way remained uninvaded throughout the study period. Data for the dispersion pattern analysis were collected along 16 km of the west side of the roadway, for a total area of 1 ha (Figure 1). Data for the patch expansion analysis came from P. ciliare patch boundaries that were monitored along a 56-km stretch of the roadway (Figure 1), for a total area of 676 ha. Pennisetum ciliare was first noted in 2008 but not previously when doing driving surveys.
Map of the study area in southwestern Arizona, USA.
Data Collection and Analysis
Dispersion Pattern
In spring 2015, P. ciliare occurrences were identified from a vehicle driving up to 30 kmh−1 along the west side of the roadway. An accuracy assessment was conducted to evaluate the effectiveness of identifying P. ciliare from a vehicle. In areas identified from a vehicle as having few or no P. ciliare plants, ten 300-m segments of the dispersion pattern analysis study area were randomly selected and surveyed on foot to determine whether P. ciliare was being missed by the sampling procedure. The 10 segments were rasterized into one hundred eighty 1,000-m2 cells, and errors of omission and commission were calculated for each cell. For the accuracy assessment, 174 cells were expected to contain no P. ciliare and 6 were expected to have P. ciliare from the original drive survey. The on-foot accuracy assessment survey revealed that the 174 cells with no P. ciliare were accurately surveyed. Three of the cells that predicted P. ciliare contained P. ciliare, while the other three cells incorrectly predicted P. ciliare. This returned a cell accuracy of 96.7%, which exceeds the level of 85% recommended by Foody (Reference Foody2002).
Once potential P. ciliare occurrences were identified for the dispersion pattern data collection, locations of individuals, with an individual defined as being separate from neighboring plants by more than 10 cm, were recorded (GPS 60, Garmin, Schaffhausen, Switzerland) to an accuracy of±3 to 5 m. The locations were used to determine dispersion pattern using the average nearest neighbor (ANN) method (ArcGIS v. 10.2.2, ESRI, Redlands, CA). The ANN test determines the dispersion pattern (dispersed, random, or clustered) of points (i.e., P. ciliare individuals) within a defined area by computing the ratio of the actual mean distance between each plant and its nearest neighbor to the expected mean distance of each plant and its nearest neighbor. The lower the ratio, the more clustered a data set, while a higher ratio is a more dispersed data set (pending statistical significance). A ratio close to 1:1 is considered a random distribution. If P. ciliare distribution were dispersed or random under the ANN, the spread would be an invasion front. A clustered classification from the ANN would indicate satellite dispersion.
Expansion Rate
From 2011 to 2013, patches of P. ciliare were observed October through December along both sides of the roadway. Patches were defined as three or more individuals,≤0.5 m apart. We identified 36 patches along a 56-km stretch of roadway. Patch outlines were recorded (Trimble Geo XH, Sunnyvale, CA) to an accuracy of ±20 cm post correction.
The expansion rate of each patch was calculated as the percent change in area per year. Pennisetum ciliare patches were analyzed only if there were patch data for all 3 yr. A pooled-site model (PSM) was also created by summing all patches to produce an aggregate for the entire study area to estimate cumulative expansion (Olsson et al. Reference Olsson, Betancourt, Crimmins and Marsh2012a). To account for patch coalescence, patches in the final year of data collection (2013) were enumerated. Each patch in the previous years of data collection that intersected or occurred within one of the 2013 enumerated patches was assigned the number of its corresponding 2013 patch.
Results and Discussion
Dispersion Pattern
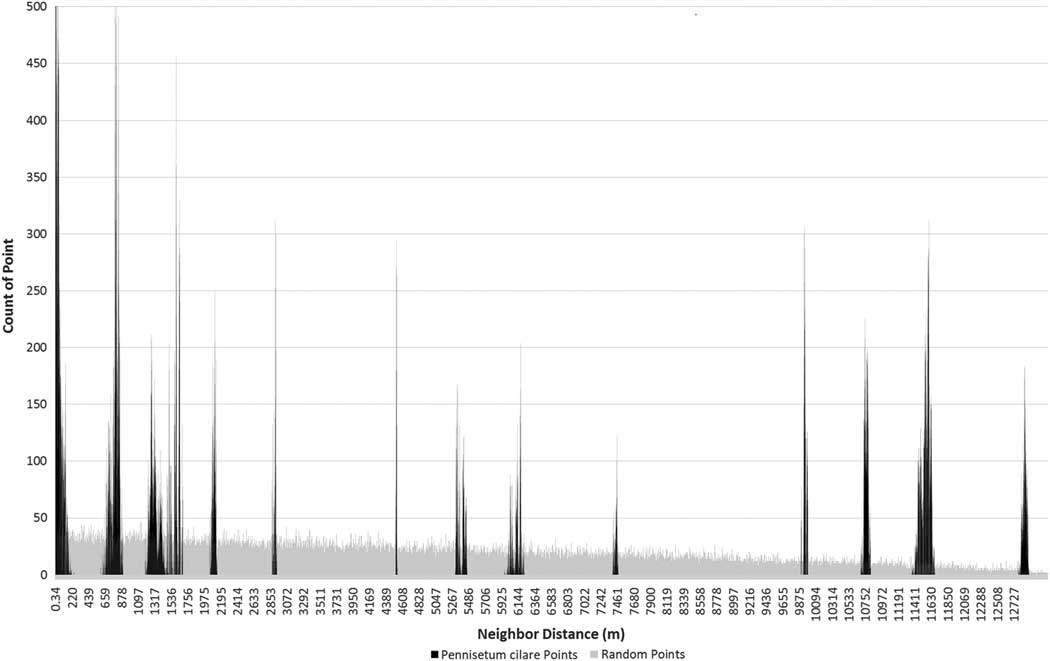
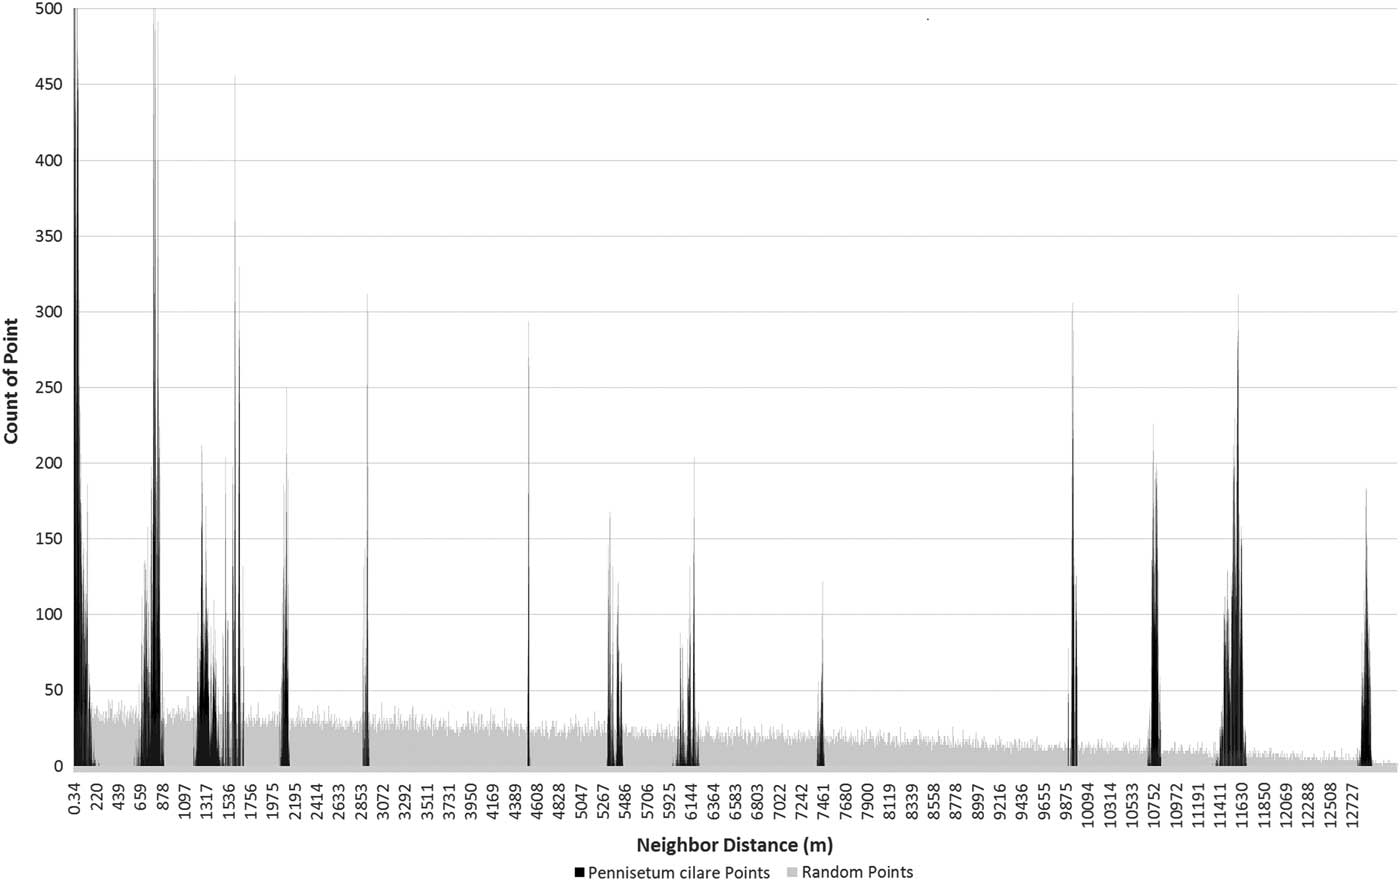
The individual plant distributions show the pattern of clumping associated with the satellite dispersion pattern (ANN test, z-score −47.2, P<0.01), which is distinctly different from a random or dispersed pattern found in an invasion front (Figure 2). A total of 652 P. ciliare individuals were identified along the 16-km roadway segment. The individuals occurred in six distinct patches, with patches ranging in size from 8 to 2,997 m2 (Figure 3). The distance between patches ranged from 0.743 to 12.8 km, based on mean center. The average distance between patches was 5.6 km.
Frequency of nearest neighbor distances among all 652 Pennisetum ciliare points (black) and among 652 random points (gray) within the same study area constraint. The P. ciliare points are in 13 distinct spikes, as opposed to the slightly decreasing trend of the random points (due to the shape of the road). The 13 spikes represent the possible distance combinations among six clusters. This is a visual representation of the satellite dispersal of the P. ciliare points.
Map of the dispersal pattern study area showing the 652 Pennisetum ciliare individuals that occur in six clusters.

While we did not define an a priori threshold for determining a satellite patch other than the finding of Ernst et al. (Reference Ernst, Veenendaal and Kebkile1992) that P. ciliare seeds tended to disperse less than 10 m from parent plants, our patch distribution results show P. ciliare invading with a satellite dispersion strategy along a roadside. The increase in satellite patches at least implies the theoretical potential for a compounding growth rate constrained only by the remaining uninvaded areas suitable for P. ciliare growth and sufficient rainfall to support seedling establishment. The models of Shigesada and Kawasaki (Reference Shigesada and Kawasaki1997) imply that once 50% of the available suitable area becomes invaded, the expansion rate will slow and asymptotically approach the system being fully invaded. While validating this theoretical change in rate for P. ciliare may be interesting, controlling the invasion will hopefully have a high enough priority to prevent full invasion.
The models of Moody and Mack (Reference Moody and Mack1988), Shigesada and Kawasaki (Reference Shigesada and Kawasaki1997), and Cannas et al. (Reference Cannas, Marco and Montemurro2006) all found that plant invasions expand exponentially slower when land managers target satellite populations during control than when they do not. Specifically, Moody and Mack (Reference Moody and Mack1988) found that targeting satellite populations exponentially improved the control of a plant invasion for an area, if a minimum of 15% of satellites were removed. Given the substantial consequences of ignoring satellite patches, the problem facing managers appears to be twofold. First, satellite patches must be detected soon after establishment, which in our example would be made difficult by satellite patches occurring an average of 5.6 km from the presumed source patch. This might imply searching a prohibitively large area of nearly 100 km2 for newly established satellites, although, as we discuss later, the roadway could have greatly augmented seed movement. Second, prioritizing discovery and control of small patches over the known large source patches may seem counterintuitive to both the public and resource managers and may result in an inconsistent approach over time.
Expansion Rate
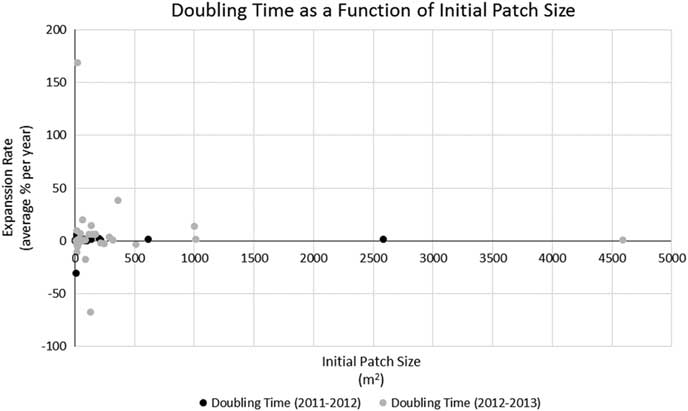
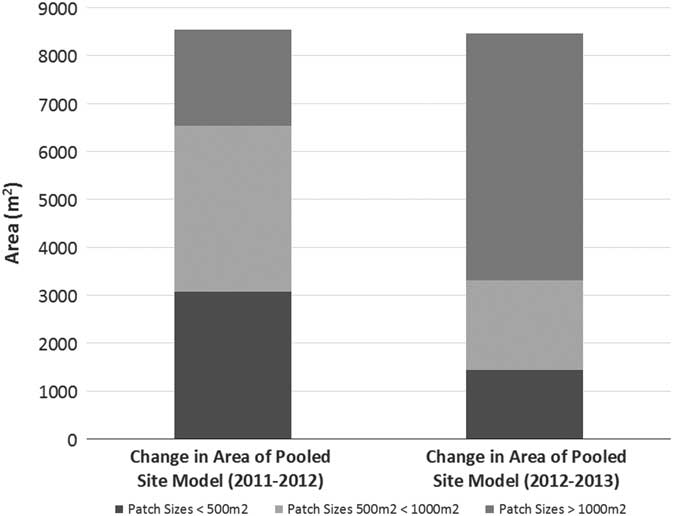
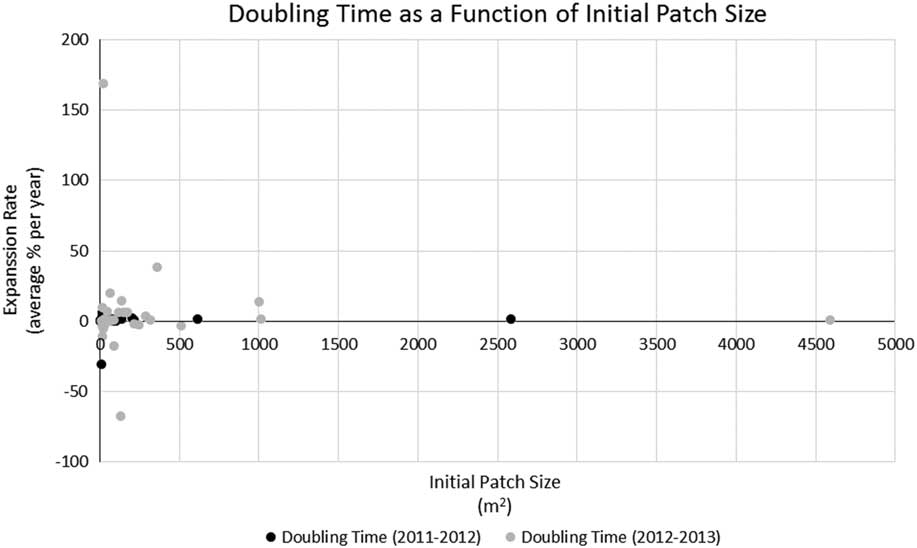
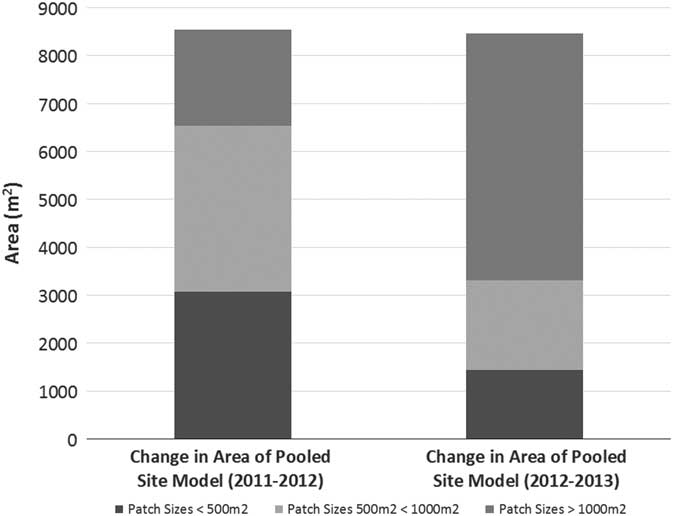
Pennisetum ciliare year-to-year patch expansion varied from −0.26% to 21,904%. Most patches (75%) experienced more growth from 2011 to 2012 than from 2012 to 2013, but 25% decreased in size from 2012 to 2013. There was no observed relationship between expansion rate and patch size (Figure 4) or between patch size and contribution to the growth of the PSM (R2=0.0048, P=0.046). The PSM—a sum of the area covered by all P. ciliare patches on the study area—showed that the cumulative invaded area increased in both 2012 and 2013 (Figure 5), but more from 2011 to 2012 (117%) than from 2012 to 2013 (69%). The year-to-year increase did not correspond well with the recorded precipitation in Gila Bend, AZ (~48 km north of the center of the patch expansion study area), with the 2011, 2012, and 2013 precipitation being 106, 107, and 164 mm, respectively, versus a 1981 to 2010 mean annual precipitation of 179 mm (DOC-NOAA 2018). The median patch size increase across the whole period of observation (from 2011 to 2013) was 271%.
Relationship between expansion rate (percent change in area per year) and patch size (based on delineated patch outlines collected during the expansion rate study). R2=0.0048, P=0.046.
The pooled site model (PSM) expanded each year. The biggest contribution to the growth of the PSM, in terms of patch size, was different for both years. From 2011 to 2012, patches less than 1,000 m2 (satellites) contributed 63% of the growth to the PSM, whereas from 2012 to 2013, patches less than 1,000 m2 contributed 27% of the growth to the PSM.
Our observed variability in expansion aligns with the descriptions of expansion rates by Johnson and Shonkwiler (Reference Johnson and Shonkwiler1999), who concluded from a meta-study in the Great Basin region of the United States that invasive weed patch expansion was variable over time due to environmental factors. They also found that variable patch growth of invasive weeds led to significant economic impact and difficulty of invasive species control. Schramm and Ehrenfeld (Reference Schramm and Ehrenfeld2012) found similar patch expansion variability during a Japanese stiltgrass [Microstegium vimineum (Trin.) A. Camus] invasion in the Sourland Mountains of west-central New Jersey, USA. Given that this was a forb in a mesic forest ecosystem, the variability appears to be somewhat common across invasions. Similarly, Olsson et al. (Reference Olsson, Betancourt, Crimmins and Marsh2012a) found variable P. ciliare patch expansion on sites in the Sonoran Desert. Some patches in the Olsson et al. (Reference Olsson, Betancourt, Crimmins and Marsh2012a) study decreased in size during different time periods, even given the longer duration of their study. For example, one patch decreased in size between 1990 and 1993 and another decreased in size from 1994 and 1997, despite an overall growth of each patch during the entire study (median patch size increase during the study period was 136%).
The present study also aligned with Olsson et al.’s (Reference Olsson, Betancourt, Crimmins and Marsh2012a) doubling-time results, which averaged 2.10 yr compared with 2.16 yr in the present study (based on data given in Olsson et al. [Reference Olsson, Betancourt, Crimmins and Marsh2012a] as percent change in area per year to match our methods). Removing the two longest doubling times (52.2 and 71.9 yr) of the 36 total patches, the average doubling time of the present study (0.79 yr) was less than half of Olsson et al. (Reference Olsson, Betancourt, Crimmins and Marsh2012a), suggesting that the expansion rate for new invasions or smaller patches could be higher than for larger, established patches, due to the possible availability of suitable growing areas adjacent to the newly invaded territory. The expansion of the PSM further illustrates this point. The PSM (i.e., the combined area of all P. ciliare) of the present study expanded at a doubling rate 15.5 times faster than that reported by Olsson et al. (Reference Olsson, Betancourt, Crimmins and Marsh2012a) (0.37 vs. 5.82 yr). However, there was not a compelling relationship (R2=0.0048, P=0.046) between patch size and growth rate in our study, as would be expected (Figure 4). We also expected smaller patches to consistently contribute more to the overall growth of the PSM. This was not true in our study, as smaller patches at less than 1,000 m2 (i.e., satellites) contributed 63% of the PSM growth the first year, but only 27% the second year (Figure 5).
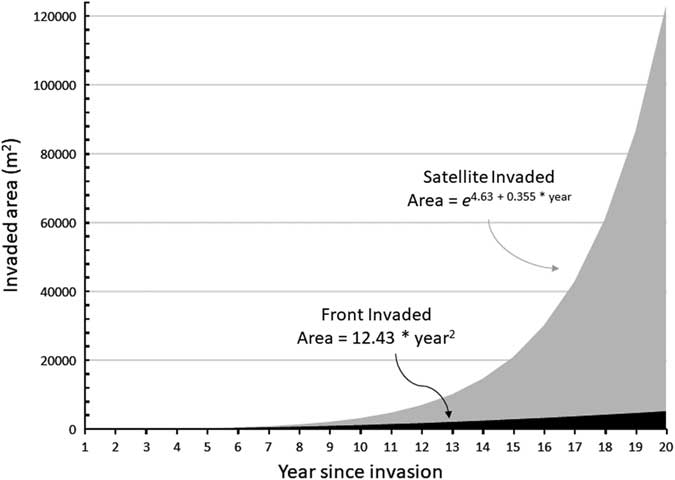
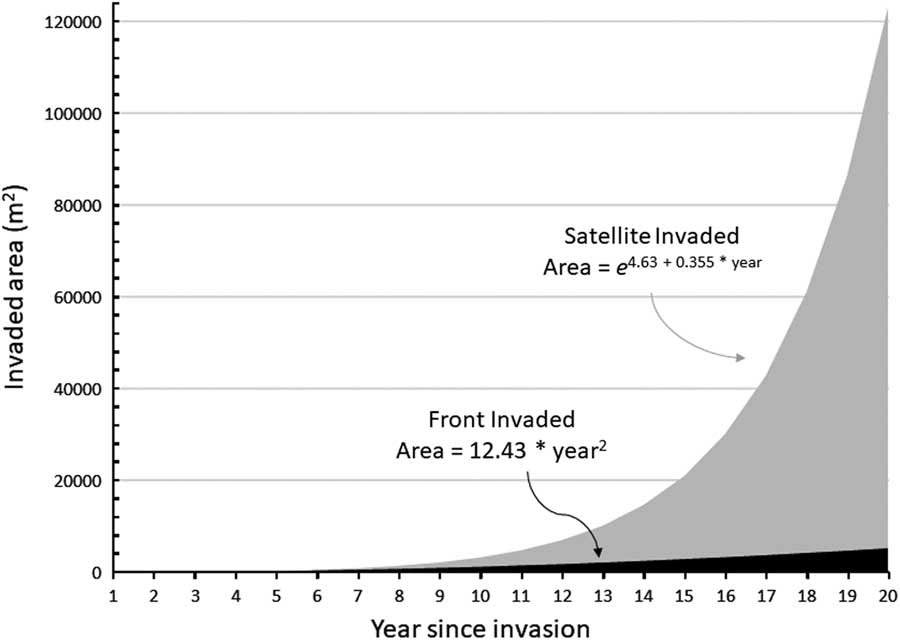
Assuming circular P. ciliare patches for ease of calculation, patches expanded an average of 2.11 m from the edge of the previous year’s patch. Patch expansion ranged from 0.02 to 12.7 m, with a standard deviation of 2.57 m. Patches greater than 1,000 m2 expanded a greater distance than patches less than 1,000 m2 (6.7 m compared with 2.6 m in 2011 and 10.2 m compared with 1.3 m in 2012). The results of average expansion for Olsson et al. (Reference Olsson, Betancourt, Crimmins and Marsh2012a) were similar at 2.86 m from the edge of the previous year on average, ranging from 1.92 to 5.72 m (when recalculating their data with our methods, for comparability). This corroborates the findings of Ernst et al. (Reference Ernst, Veenendaal and Kebkile1992), who reported that P. ciliare seeds dispersed 0.60 to 7.26 m from parent plants, based on wind speed and inflorescence height. While Ernst et al. (Reference Ernst, Veenendaal and Kebkile1992) noted that uncommon events such as whirlwinds or large storms could move seeds, the numbers tended to be small, and the movement was concentrated among the lightest and least viable seeds. We observed established patches≥700 m from the nearest neighboring established patches, implying that movement events must be common and contain sufficient amounts of viable seed. Given that our study site is along a rural roadway (roughly 8-m wide), the turbulence of large vehicles moving at high speed may have significantly contributed to seed movement. Illustrating our P. ciliare data graphically shows the potential difference in areal expansion between the front invasion and the satellite invasion (Figure 6).
Graphical representation of invasion front versus satellite invasion as a function of time since establishment for Pennisetum ciliare. The expansion parameters were simplified from data collected on P. ciliare in this study. The expansion rates started in year 1 with a single plant of 0.25-m diameter. The front expansion remained a single patch. For satellite expansion, each patch spawned another patch every 2 yr. All patches expanded by 2.11 m from their outer edges each year. Expansion was based on the assumptions of circular patches far enough apart to not coalesce and not constrained by lack of suitable growing space. The yearly values are plotted, and formulae were fit based on the cumulative outputs.
Patch coalescence is another important behavior during an invasion, because it represents a shift from invasion to expansion and connectivity of patches, leading to manifold increases in the impact a species has on the environment and increasing the invasion rate to neighboring areas. Davis et al. (Reference Davis, Taylor, Civille and Strong2004) found that the successful western U.S. marsh invader smooth cordgrass (Spartina alterniflora Loisel.) produces significantly proportionately more seed (i.e., an Allee affect) once patch coalescence and density occurs, further promoting invasion. Robinson et al. (Reference Robinson, van Klinken and Metternicht2008) found that patch coalescence of Prosopis spp. in Western Australia represented the establishment of mesquite-dominant landscapes in an ecosystem characterized by flux between woody shrubs, mesquite, and grasses. Albeit at a microscale, coalescence was observed during the study period. In the most extreme case, the largest patch began as 34 separate patches in 2011, down to 11 patches in 2012 (because of coalescence), and finally coalesced to 1 single patch by 2013.
Pennisetum ciliare invaded our site both through expansion along a front and through establishing satellite patches at a distance from existing patches. Controlling P. ciliare satellite patches, rather than controlling large patches, may be a more efficient strategy for preventing a runaway P. ciliare invasion. The invasion attributes of dispersion pattern (i.e., satellite or invasion front) and patch expansion rate were straightforward to calculate and potentially provide critical information to inform control strategies. Future research linking satellite establishment and patch expansion to environmental variables, such as temperature and weather, as well as disturbance would further improve P. ciliare invasion models, which in turn may offer greater control efficiency.
Acknowledgments
Fieldwork was completed with the assistance of Josh Sutter, Rachel Turner, Grant Martin, Joey Dahms, and Andy Warnick. GIS analysis was completed with the assistance of Mickey Reed. No conflicts of interest have been declared. This work was supported by the U.S. Air Force’s 56th Range Management Office at Luke Air Force Base, the Arizona Agricultural Experimental Station, and the Harry Wayne Springfield Endowment Scholarship.