Introduction
Former agricultural land use is known to have persistent effects on both soil and vegetation of recovering forests. Concerning forest seed banks, Bossuyt and Hermy (Reference Bossuyt and Hermy2001) claim that the influence of a former land use on the seed bank decreases after 50 years of forest restoration (cf. Hill and Stevens, Reference Hill and Stevens1981; Warr et al., Reference Warr, Kent and Thompson1994), ultimately rendering recent forest seed banks similar to ancient forest seed banks. In contrast, Plue et al. (Reference Plue, Hermy, Verheyen, Thuillier, Saguez and Decocq2008) found evidence that early successional ruderal species may persist and alter the seed bank for centuries beyond this threshold, if sufficient natural and/or man-made disturbance allow seed-bank replenishment (see also Van Calster et al., Reference Van Calster, Chevalier, Van Wyngene, Archaux, Verheyen and Hermy2008). While Plue et al. (Reference Plue, Hermy, Verheyen, Thuillier, Saguez and Decocq2008) looked into the effect of 1600-year-old settlements on the forest seed bank, Dupouey et al. (Reference Dupouey, Dambrine, Lafitte and Moares2002) and Dambrine et al. (Reference Dambrine, Dupouey, Laüt, Humbert, Thinon, Beaufils and Richard2007) proved that not only ancient settlements but also ancient agriculture persistently alters forest soil and vegetation, with the extent of change dependent on the former land-use intensity (Dupouey et al., Reference Dupouey, Dambrine, Lafitte and Moares2002). Therefore, we were interested to test whether various degrees of ancient agricultural intensity would still affect forest seed banks.
Seed banks vary widely between land-use types (Thompson and Grime, Reference Thompson and Grime1979). In the most frequently disturbed habitats, i.e. arable fields, high-seed-density seed banks are generally found (Cavers and Benoit, Reference Cavers, Benoit, Leck, Parker and Simpson1989; Roberts and Vankat, Reference Roberts and Vankat1991; Dessaint et al., Reference Dessaint, Chadoeuf and Barralis1997), containing mainly ruderal annual species (Cavers and Benoit, Reference Cavers, Benoit, Leck, Parker and Simpson1989; Dessaint et al., Reference Dessaint, Chadoeuf and Barralis1997). Ruderals of arable fields (sensu Grime, Reference Grime2001) show vital adaptations to these open and frequently disturbed habitats, i.e. a high growth rate, light requirement for germination (Milberg et al., Reference Milberg, Andersson and Thompson2000; Grime, Reference Grime2001) and high seed persistence (Thompson et al., Reference Thompson, Bakker, Bekker and Hodgson1998). These adaptations consequently yield a high vegetation–seed-bank similarity (Thompson and Grime, Reference Thompson and Grime1979; Dessaint et al., Reference Dessaint, Chadoeuf and Barralis1997; Vasileiadis et al., Reference Vasileiadis, Froud-Williams and Eleftherohorinos2007). Agricultural land-use intensity also affects seed-bank characteristics. The more productive arable soil becomes, the more seeds are added to the seed bank (Roberts, Reference Roberts1981). Moreover, soil fertility/productivity can easily be enhanced by the application of fertilizers and/or animal manure. Although chemical fertilizers may deplete the seed bank (Egley, Reference Egley1986), animal manure is also considered an important source of seeds (Cavers and Benoit, Reference Cavers, Benoit, Leck, Parker and Simpson1989), causing an increase in seed density after application (Lewandowska and Skapski, Reference Lewandowska and Skapski1979). On the other hand, cultivation (tillage) depletes the seed bank through the destruction of seedlings combined with enhanced germination (Cavers and Benoit, Reference Cavers, Benoit, Leck, Parker and Simpson1989). Seed losses are increased further when conventional management intensifies [number of actions (Roberts, Reference Roberts1966), tillage type (Ball, Reference Ball1992)]. Finally, crop species (Roberts and Neilson, Reference Roberts and Neilson1981) and crop sequence (Menalled et al., Reference Menalled, Gross and Hammond2001) may also affect the seed-bank composition.
When arable fields are abandoned, forest succession sets in. After an initial rise in seed density and species richness early in old-field succession (Oosting and Humphreys, Reference Oosting and Humphreys1940; Leck and Leck, Reference Leck and Leck1998), both will exhibit a sharp, followed by a more gradual decline (Donelan and Thompson, Reference Donelan and Thompson1980; Roberts and Vankat, Reference Roberts and Vankat1991). Subsequently, once a closed forest canopy establishes and matures, both density and richness keep declining with stand age (e.g. Augusto et al., Reference Augusto, Dupouey, Picard and Ranger2001; Bossuyt and Hermy, Reference Bossuyt and Hermy2001; Bossuyt et al., Reference Bossuyt, Heyn and Hermy2002) as a result of seed predation, seed senescence and failed germination of early successional species (Bossuyt and Hermy, Reference Bossuyt and Hermy2001). Simultaneously, established (ancient) forest species introduce few (for some), if any (for most), large and heavy short-term persistent seeds into the seed bank (Bossuyt and Hermy, Reference Bossuyt and Hermy2001), yielding forests seed banks that are characterized by low seed density and species richness (e.g. Bossuyt et al., Reference Bossuyt, Heyn and Hermy2002; Van Calster et al., Reference Van Calster, Chevalier, Van Wyngene, Archaux, Verheyen and Hermy2008), with little resemblance to the standing vegetation (Hopfensperger, Reference Hopfensperger2007). Nonetheless, low seed numbers of ancient forest species are consistently reported in recent studies (Augusto et al., Reference Augusto, Dupouey, Picard and Ranger2001; Bossuyt et al., Reference Bossuyt, Heyn and Hermy2002; Plue et al., Reference Plue, Hermy, Verheyen, Thuillier, Saguez and Decocq2008).
Although forest seed banks differ from arable seed banks (see above), we believe that different intensities of ancient agricultural land use may still influence forest seed banks to various degrees, similar to the soil and vegetation (Dupouey et al., Reference Dupouey, Dambrine, Lafitte and Moares2002; Dambrine et al., Reference Dambrine, Dupouey, Laüt, Humbert, Thinon, Beaufils and Richard2007). To test our hypothesis, the study site of Dupouey et al. (Reference Dupouey, Dambrine, Lafitte and Moares2002) became of particular interest as detailed maps enabled the zonation into forest areas with different ancient land-use intensities. Consequently, detailed data could be gathered to test the effect of ancient agricultural intensity on the seed bank after 1600 years of continuous forest cover. Given the knowledge on arable and forest seed banks (see above), we wanted to test whether, along a decreasing ancient land-use intensity gradient: (1) the forest seed bank would differ in (functional) composition and characteristics; (2) dissimilarity between seed bank and vegetation would increase; and (3) functional seed-bank types (i.e. poor dispersers, stress-tolerant species) would increase in abundance.
Materials and methods
Study area
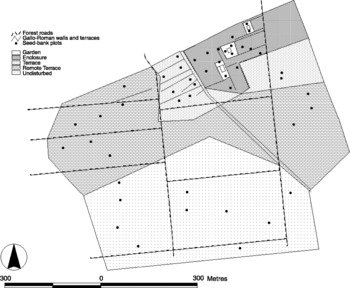
The study area is a 20 ha archaeological site situated 25 km south-west of Nancy, France (Fig. 1). Gallo-Roman coins and ceramics were used to date the site. The archaeological site is situated on a limestone plateau and covered by an oak–beech forest. The management regime is coppice-with-standards, with oak (Quercus robur) and beech (Fagus sylvatica) as standards (trees of large timber size) and hornbeam (Carpinus betulus) as coppice. The forest has not known any other land use since the medieval period, although a period of coppice overexploitation is suspected around the 18th century. Soils are rendzic leptosols, i.e. shallow ( ± 17 cm), rich, and clay-textured soils. Dupouey et al. (Reference Dupouey, Dambrine, Lafitte and Moares2002) provide a full description of the soil gradient. Five land-use types of decreasing intensity were mapped based on the spatial distribution and density of walls (Fig. 1), and abundance of ceramics and tiles.
Location of seed-bank plots across the study area. The different land-use intensity zones are delineated as proposed by Dupouey et al. (Reference Dupouey, Dambrine, Lafitte and Moares2002).

Different studies in NE France (e.g. Willaume et al., Reference Willaume, Blouet, Lansival and Paitier1993) provide some insight into Gallo-Roman agricultural practices. These enabled us to identify which management practices probably took place in each land-use intensity type.
(1) Gardens were heavily fertilized with ashes and animal manure; the latter either applied by the farmers or by grazing animals, particularly poultry. Stones were thoroughly removed from the soil to facilitate ploughing. Main crops grown were vegetables.
(2) Enclosures were heavily fertilized as well, although only with ashes and animal manure applied by farmers. Ploughing and stone removal were common practice. Main crops grown were cereals [wheat (Tricitum compactum), barley (Hordeum vulgare) and oats (Avena sativa)], legumes (e.g. Pisum sativum, Lens esculenta and Vicia spp.) and vegetables.
(3) Fertilization on the terraces was limited to some application of animal manure. Ploughing was done as intensively as on the former types, but stone removal was less intense. Main crops grown were cereals and legumes.
(4) Remote terraces were probably grassland rather than cropland. They were unfertilized, apart from animal fertilizer provided by grazing animals (sheep), and were not ploughed. Possibly some parts were already reserved for coppicing.
(5) There was no agriculture on the ‘undisturbed’ areas. However, the forest was not undisturbed as it was likely to be grazed by sheep. Forest management included coppicing as well as coppice-with-standards.
Plot selection
Sampling sites were selected according to a stratified random sampling design, based on the land-use intensity map of Dupouey et al. (Reference Dupouey, Dambrine, Lafitte and Moares2002) (Fig. 1). However, since the houses could not be adequately sampled, the walled zone immediately around the houses was redefined as the most intensively used area, i.e. domestic gardens. The remaining land-use intensity zones were retained as proposed by Dupouey et al. (Reference Dupouey, Dambrine, Lafitte and Moares2002). Ten randomly selected plots per land-use type were set out in the field under homogeneous forest canopy and light conditions. Only seven plots were set out in the gardens due to surface area limitations. Hence, 47 plots were sampled in total.
Data collection
One 10 × 10 m plot was set out at each sampling site. Complete vegetation surveys (following Braun-Blanquet) were made at each plot in April and August 2006. Three forest strata were recorded: the herbaceous layer (0–1 m), the shrub layer (1–8 m) and the tree layer (>8 m). In August 2006, 25 soil cores (0–10 cm, 2.6 cm in diameter) were collected at random per plot for seed-bank analysis. All soil cores were pooled per plot to obtain one mixed seed-bank sample per plot. Samples were stored in paper bags and kept in a cool and dark environment until further processing.
The concentrated seed-bank samples (Ter Heerdt et al., Reference Ter Heerdt, Verweij, Bekker and Bakker1996), spread out over steam-sterilized compost, were allowed to germinate under a 16-h day, 8-h night regime, with day temperatures ranging from 25 to 30°C. The containers were kept moist through capillarity. The first germination period (14 weeks) was interrupted by a cold-stratification period (0–2°C; 10 weeks). The following germination period (12 weeks) was ended when no new seedlings germinated for two consecutive weeks. All identified seedlings were counted and removed, while unidentified seedlings were transplanted and identified upon flowering. Five control containers were distributed among the containers to detect contamination from either airborne seeds or seeds present in the potting soil. No contamination was detected. Species identification and nomenclature follows Lambinon et al. (Reference Lambinon, De Langhe, Delvosalle and Duvigneaud1998).
Data analysis
To test the hypothesis that seed-bank composition varied as a function of ancient land-use intensity, a multi-response permutation procedure (MRPP; Zimmerman et al., Reference Zimmerman, Goetz and Mielke1985) was performed on the seed-bank data matrix (39 species × 47 plots). Preceding this analysis, the seed-bank data were checked for spatial autocorrelation. Therefore, the seed-bank matrix (39 species × 47 plots) was correlated with an Euclidean distance matrix (47 × 47), based on (x, y)-coordinates, using a Mantel test. Since the latter was not significant (r m < 0.01; P = 0.46), a Bray–Curtis distance-based MRPP, with pairwise comparisons, was carried out in PcOrd 5.0 (McCune and Mefford, Reference McCune and Mefford2006) to identify homogeneous subsets of ancient land-use intensities. To support possible compositional differences, a Species Indicator Analysis (Dufrêne and Legendre, 1997) was run in PcOrd 5.0 (McCune and Mefford, Reference McCune and Mefford2006) to assess if species occurred significantly more within a specific land-use type.
In addition to the seed-bank composition, seed-bank species richness, seed density and seed-bank signature (Hunt et al., Reference Hunt, Hogdson, Thompson, Bungener, Dunnett and Askew2004) were calculated per plot. As several variables were not normally distributed, the Jonckheere–Terpstra test (Siegel and Castellan, Reference Siegel and Castellan1988) was used to identify changes with the land-use intensity gradient. This test was chosen over the Kruskal–Wallis test as it performs better on a priori ordered data (i.e. in function of land-use intensity) (Siegel and Castellan, Reference Siegel and Castellan1988). Pairwise comparison between groups was used to identify homogeneous subsets.
Due to large α-diversity differences between vegetation and seed bank, the unbiased Raup and Crick (dis)similarity measure was chosen to calculate the vegetation–seed-bank plot dissimilarity, as the Raup and Crick measure is independent of α-diversity differences. Indeed, this probabilistic measure represents the probability that two sites (i.e. one site with two communities) share fewer species than expected under the null model, i.e. the chance of selecting a species from a regional pool is proportional to the number of sites where the species was recorded (Vellend et al., Reference Vellend, Verheyen, Flinn, Jacquemyn, Kolb, Van Calstes, Peterken, Graae, Bellemare, Honnay, Brunet, Wulf, Gerhardt and Hermy2007). The measure is calculated as the proportion of draws from the regional pool where the amount of shared species is equal or higher than the observed shared species. Again, a Jonckheere–Terpstra test (Siegel and Castellan, Reference Siegel and Castellan1988) was used to test whether dissimilarity would increase with decreasing land-use intensity.
To test for differences in functional seed-bank composition, seed-bank species first had to be classified into distinct functional seed-bank types. In order to group the species into such types, the procedure suggested by Verheyen et al. (Reference Verheyen, Honnay, Motzkin, Hermy and Foster2003) was followed. Important seed-bank-related traits were taken from the LEDA database (Knevel et al., Reference Knevel, Bekker, Bakker and Kleyer2003) and, if necessary, complemented with values from the database of Grime et al. (Reference Grime, Hodgson and Hunt2007). Nine traits were selected: seed weight, seed length, seed width, maximum canopy height (measure for competitiveness), seed longevity index (measure for seed persistence), seed production, lifespan [(bi-)annual or perennial], vegetative spread (yes or no) and dispersal type (anemochory, epi-/endozoochory, ballisto-/myrmecochory or barochory). Next, a hierarchical clustering using Ward's method was performed on the Gower dissimilarity matrix [based on the species–traits matrix (36 species × 9 traits)] to identify different clusters. The optimal cluster number was determined through visual inspection of the dendrogram. Kruskal–Wallis and χ2-tests (Siegel and Castellan, Reference Siegel and Castellan1988) were used to characterize the resulting seed-bank types. Finally, the proportion (in %) of each functional seed-bank type in the plot seed bank was calculated, based on its seed-bank composition. A Jonckheere–Terpstra test (Siegel and Castellan, Reference Siegel and Castellan1988) was applied to test for differences in seed-bank type abundance over the land-use intensity gradient.
Results
General description of the vegetation and seed bank
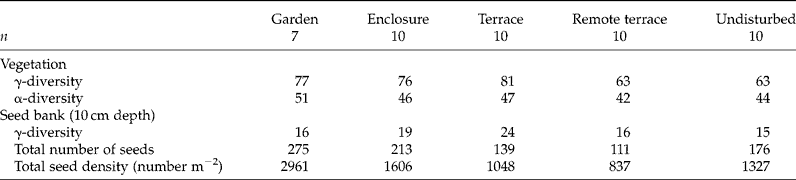
The vegetation yielded 134 species distributed over 47 plots. Gardens, enclosures and terraces had noticeably more species (76–81) than the remote terraces and undisturbed zones (63). Average plot species richness did not vary significantly, although the largest average number of species was recorded in the gardens (Table 1). Over the entire study, 914 seeds germinated, which equals an overall mean seed density of 1466 seeds m− 2 (range: 75–6181 seeds m− 2). Among those seedlings, 39 species were found (one not identified to species level). Terraces yielded most species compared to other land-use types (Table 1). Twenty-one seedlings (2.3%) died prior to identification, while 44 seedlings (4.8%) could not be identified to species level. Species with the highest numbers of seeds were Verbascum thapsus (255; 27%), Hypericum perforatum (223; 24%), H. hirsutum (89; 9.5%), Fragaria vesca (68; 7.5%), Veronica officinalis (43; 5%) and Carex digitata (39; 4%).
General characteristics of vegetation and seed bank per land-use intensity
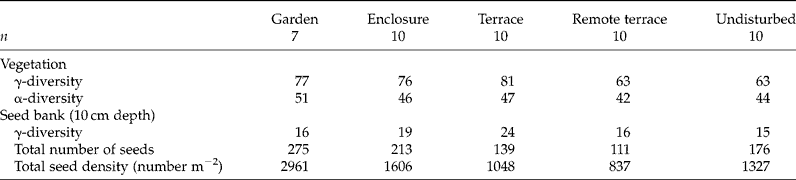
γ-diversity, total species richness per land-use intensity type; α-diversity, average plot species richness per land-use intensity type.
Seed-bank composition and characteristics related to ancient land-use intensity
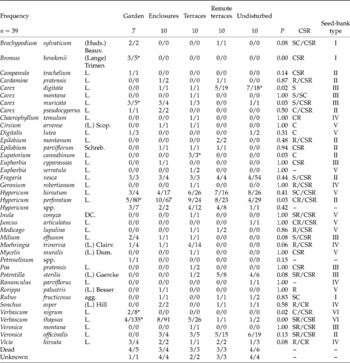
Seed-bank species composition changed significantly as a function of ancient land-use intensity (MRPP statistic = − 6.40; P ≤ 0.001). Pairwise comparisons outlined four homogeneous subsets, which did not differ significantly in species composition: (1) gardens–enclosures; (2) enclosures–terraces; (3) terraces–remote terraces; and (4) remote terraces–undisturbed sites. The Species Indicator Analysis showed that several species occurred significantly more in seed banks of a specific land-use type: gardens (Bromus benekenii, V. thapsus, V. nigrum and H. perforatum), terraces (Eupatorium cannabinum) and the undisturbed zones (C. digitata) (see Appendix, Table A1).
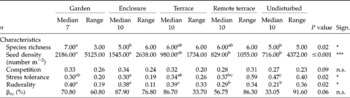
Seed-bank characteristics differed significantly with land-use type (Table 2). Seed density and species richness declined significantly with decreasing land-use intensity, although species richness on the enclosures was low. The ruderal seed-bank signature decreased significantly as intensity decreased, while the stress-tolerant seed-bank signature showed a reverse trend. Although a declining tendency was observed for the competitive seed-bank signature, it was not significant. Contrary to our second hypothesis, vegetation–seed-bank dissimilarity tended to decrease with decreasing ancient land-use intensity (Table 2), yet not significantly. Dissimilarity was highest on the terraced sites, enclosures and gardens, whereas similarity between seed bank and vegetation was highest on the undisturbed plots (and remote terraces).
Median (and range) of seed-bank characteristics and significance of differences with decreasing ancient land-use intensity, as tested by a Jonckheere–Terpstra test

Sign., level of significance; ***P ≤ 0.001; **0.001 < P ≤ 0.01; *0.01 < P ≤ 0.05; n.s. not significant.a,b,c homogeneous subsets. Characteristics without letters in the table do not differ with the land-use gradient.βrc, Raup and Crick plot – dissimilarity between vegetation and seed bank.
Functional seed-bank types related to ancient land-use intensity
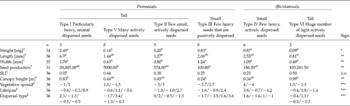
From the visual inspection of the species dendrogram, six clusters emerged as the optimal solution. Differentiating traits (as determined by the Kruskal–Wallis and χ2-tests) were used to characterize the six seed-bank types. The (bi)annual herbs were a first distinct group which was subdivided in two characteristic seed-bank types (Table 3). Type IV are small, mostly annuals producing few large and heavy seeds which are actively dispersed. Type VI is distinct from type IV as both species of this group are tall biannuals, incapable of vegetative spread, which produce vast amounts of small and light seeds. The remaining four types are all perennials (Table 3). The first type, type I, are tall perennials, which produce particularly heavy (and large) seeds, which are exclusively animal-dispersed. Type III differs from the latter with respect to their size (small), seed production (low), dispersal type (short distance, unassisted) and lack of vegetative spread. Types II and V seem closely related but are nonetheless different, as type V species have higher seed production whereas type II species reproduce exclusively via seeds. Both types have small and light seeds that are predominantly wind-dispersed. Remarkably, all six seed-bank types do not differ in seed persistence. Table A1 of the Appendix lists the functional seed-bank type to which species belong.
Differences in traits between the functional seed-bank types, as determined by Kruskal–Wallis and χ2 tests

***P ≤ 0.001; **0.001 < P ≤ 0.01; *0.01 < P ≤ 0.05; n.s. not significant. a,b homogeneous subsets.Sign., Level of significance; SLI, Seed Longevity Index.
† Kruskal–Wallis test. Values are median values of a specific trait per functional seed-bank type. Significant differences between functional types are indicated with different letters. Traits without letters in the table do not differ between the functional seed-bank types.
‡ Chi-square test. Values are the difference between observed and expected count for each of the following classes: vegetative spread, yes/no; lifespan, annual/biannual/perennial; dispersal type, endo- and epizoochory/anemochory/myrmeco- and ballistochory/barochory.
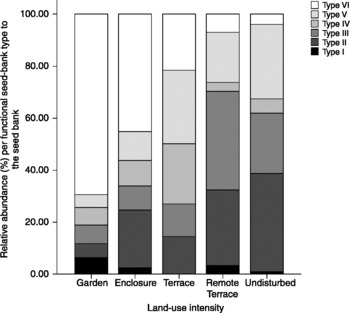
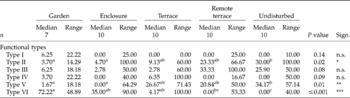
Seed-bank type I did not differ in abundance over the land-use intensity gradient (Fig. 2; Appendix, Table A2). Neither did seed-bank type III, though an increase in abundance could be noted as land-use intensity decreased. Type IV seed-bank species occurred mostly on the terraces, though not significantly. Seed-bank types II and V both increased significantly in abundance with decreasing land-use intensity; the opposite trend was significant for seed bank type VI.
Functional seed-bank composition based on the mean proportion (in % based on seed densities) of each seed-bank type per land-use intensity, in decreasing order of land-use intensity (1, garden; 2, enclosures; 3, terraces; 4, remote terraces; 5, undisturbed zones). Significant differences between functional seed-bank type abundance with decreasing land-use intensity are given in the Appendix, Table A2.

Discussion
Seed bank related to ancient land-use intensity
The low median seed density (1466 seeds m− 2) and species richness (6 spp.) are expected given the 1600-year continuous forest cover (cf. Jankowska-Blaszczuk and Grubb, Reference Jankowska-Blaszczuk and Grubb1997). The low seed longevity index (median 0.37) and high seed weight (median 0.48 g) strengthen the hypothesis of long-term forest cover, as they are typical for stable, relatively undisturbed habitats (Thompson et al., Reference Thompson, Bakker, Bekker and Hodgson1998). Nevertheless, similar to that reported by Plue et al. (Reference Plue, Hermy, Verheyen, Thuillier, Saguez and Decocq2008), the ancient agricultural land use seems to have introduced ruderals of arable fields in the seed banks of the most intensively used zones (i.e. Verbascum thapsus, V. nigrum, Rorippa palustris and Cirsium arvense), while the continued coppice-with-standards management (Van Calster et al., Reference Van Calster, Chevalier, Van Wyngene, Archaux, Verheyen and Hermy2008) complemented with frequent small-scale natural disturbance (Jankowska-Blaszczuk and Grubb, Reference Jankowska-Blaszczuk and Grubb2006), e.g. increased uprooting of trees on the shallow leptosols (Fraser, Reference Fraser1962), may enable their persistence (see below). As a result, seed-bank characteristics associated with those ruderals (e.g. ruderal seed-bank signature) are significantly higher on all, or at least one, of the most intensively used zones, while their presence increases seed density and species richness (cf. Plue et al., Reference Plue, Hermy, Verheyen, Thuillier, Saguez and Decocq2008). Through the addition of these species, the seed-bank composition reflects the land-use intensity gradient. What is more, functional composition (Fig. 2) also differs over the land-use gradient. Types I and IV, although very different in traits, share their dispersal agent, i.e. animals. As vertebrates are efficient vectors for seed dispersal (e.g. Couvreur et al., Reference Couvreur, Cosyns, Hermy and Hoffmann2005), the absence of a significant difference over the land-use intensity gradient is not surprising. On the other hand, poor dispersers (unassisted dispersal and heavy seeds), such as type III species, exhibit an increasing trend with decreasing land-use intensity (e.g. Carex digitata). Indeed, as they are small (not competitive), produce few seeds and lack vegetative spread, they still seem to be dispersal limited (cf. Dupouey et al., Reference Dupouey, Dambrine, Lafitte and Moares2002). In addition, recruitment on the more fertile soils may serve as a bottleneck for type III species, and particularly for type II. Although wind dispersed, the low seed numbers and inadequate competitive capabilities may inhibit them from establishing seed-forming populations across the forest. However, type V species have all the traits (e.g. high seed numbers) necessary to colonize the old fields over 1600 years, but were seemingly unable to do so.
Type VI species, i.e. V. thapsus and V. nigrum, share several traits with type V species. Gross (Reference Gross1980) studied the old-field colonization by V. thapsus and concluded that it fills a specific window early in succession. Having no adaptations for long-distance dispersal (Gross and Werner, Reference Gross and Werner1978), Gross (Reference Gross1980) stated that successful colonization was primarily seed-bank dependent, as she found that V. thapsus must be among the initial colonizers to set seed successfully. This could imply that the present distribution, i.e. decreasing type VI abundance with decreasing land-use intensity, may still be the original distribution of V. thapsus. In addition, Gross (Reference Gross1980) found that the persistence of V. thapsus is not based solely on a quick response to environmental stimuli of a safe site (bare ground, light, ≥ 0.5 m2) but also upon the occurrence of repeated disturbances in space and time (i.e. the coppice-with-standards management; see above). Therefore, producing large numbers of long-persistent seeds is necessary (Gross, Reference Gross1980). Their present numbers, suggesting past successful reproduction, may have outcompeted analogous type V species in the most intensively used zones during disturbances, explaining the observed pattern for type V species.
Are seed-bank patterns determined by soil changes?
Grime (Reference Grime2001) defines ruderals as disturbance-linked species of productive environments. The forest soil is fertile and productive throughout the forest – despite a significant, yet short soil gradient along the land-use gradient (Dupouey et al., Reference Dupouey, Dambrine, Lafitte and Moares2002). Hence, soil conditions across the forest should be able to sustain any introduced ruderals. In the extensively used areas, the most important limiting soil nutrient is plant-available phosphorus. Yet, phosphorus by itself is unlikely to be responsible either for the absence of ruderals in these areas or for their presence in the intensively used areas. We, however, cannot dismiss the possibility that high phosphorus levels in the latter areas may have contributed in part to the ruderals' survival once introduced. Additionally, the presence of nutrient-demanding species such as Bromus benekenii and Campanula trachelium (cf. the Appendix, Table A1) may be attributable to raised phosphorus levels. Compared to Plue et al. (Reference Plue, Hermy, Verheyen, Thuillier, Saguez and Decocq2008) however, who suggested that soil modifications can affect the seed-bank composition, the observed differences in soil nutrient levels in this study are nonetheless limited, and therefore an improbable explanation for the strong seed-bank pattern. Thus, we argue that in this case the gradient in seed-bank composition is only partially related to the soil gradient.
Are seed-bank patterns determined by vegetation?
This study supports the well-documented discrepancy between seed bank and vegetation (Hopfensperger, Reference Hopfensperger2007). Indeed, the median Raup and Crick dissimilarity (74.50%) over all plots is high, suggesting that the current plot vegetation only determines the corresponding plot seed-bank composition to a limited extent. Yet, results show a strong decreasing trend in vegetation–seed-bank dissimilarity with decreasing land-use intensity, opposite to that found by Thompson and Grime (Reference Thompson and Grime1979). Logically, the ruderal seed-bank species (see above) which are absent from the vegetation, create the large discrepancy in the intensively used zones. However, as former land-use intensity decreases, so does their abundance (e.g. Figure 2, type VI), consequently lowering vegetation–seed-bank dissimilarity. Indeed, as the median similarity (66.95%) is highest in the undisturbed zones, vegetation seems to determine the seed-bank composition in that part of the forest. High similarities have been recorded before in old-growth forest seed banks (Jankowska-Blaszczuk et al., Reference Jankowska-Blaszczuk, Kwiatkowska, Panufnik and Tanner1998; Leckie et al., Reference Leckie, Vellend, Bell, Waterway and Lechowicz2000), indicating that this forest part may have remained relatively undisturbed through time. Thus, although vegetation becomes increasingly important as a seed-bank determinant as land-use intensitity decreases, seed-bank patterns do not parallel present vegetation patterns (Dupouey et al., Reference Dupouey, Dambrine, Lafitte and Moares2002).
Disturbance as a vehicle for persistence
When forest stands mature, the seed bank gradually depletes and may become severely depleted if frequent disturbances are lacking (e.g. high forest systems; Van Calster et al., Reference Van Calster, Chevalier, Van Wyngene, Archaux, Verheyen and Hermy2008). Even long-term persistent species, normally well equipped to span the time between natural forest disturbances, will die of seed senescence. However, nearly total depletion of the seed bank is averted when frequent human (i.e. two-story coppice-with-standards management) and natural disturbances (i.e. increased tree uprooting on shallow leptosols (Fraser, Reference Fraser1962); forest blow-down) take place. Indeed, frequently recurring disturbances with regular light phases (a coppice cut every 15–30 years and three to four times the coppice cycle length for the standards cut) allow seed-bank species to establish seed-forming populations, which incorporate fresh seeds into the soil. Hence, ruderals of arable fields, regarded as highly persistent (Thompson et al., Reference Thompson, Bakker, Bekker and Hodgson1998), should be able to bridge periods between disturbances. Consequently, once introduced via agricultural land use, they remain present in the seed bank (see above; Plue et al., Reference Plue, Hermy, Verheyen, Thuillier, Saguez and Decocq2008), rather than disappearing after 50 years (Bossuyt and Hermy, Reference Bossuyt and Hermy2001), enabling persistence of the seed-bank gradient. As soil and vegetation changes may persist for at least 1600 years (Dupouey et al., Reference Dupouey, Dambrine, Lafitte and Moares2002; Dambrine et al., Reference Dambrine, Dupouey, Laüt, Humbert, Thinon, Beaufils and Richard2007; Plue et al., Reference Plue, Hermy, Verheyen, Thuillier, Saguez and Decocq2008), there is no reason to assume that the seed-bank gradient will disappear as long as the coppice-with-standards management is continued.
Acknowledgements
J.P. would like to thank P. Behr for fieldwork assistance and two anonymous referees for valuable comments on the manuscript.
Appendix
Frequency/abundance of each seed-bank species (number of occurrences over all plots of a land-use type/number of seeds per land-use type) and the P value of the Species Indicator Analysis on the seed-bank data matrix. The plant strategy signature (CSR; Grime, Reference Grime2001) used to calculate the corresponding variables is given for each species. The functional seed-bank type each species belongs to is given, according to the classification outlined in the text. Plant nomenclature follows Lambinon et al. (Reference Lambinon, De Langhe, Delvosalle and Duvigneaud1998)

* Land-use intensity a plant species is characteristic of, as identified by the Species Indicator Analysis.
Plant strategy signature: C, competitive; S, stress-tolerant; R, ruderal.
Median relative abundance (and range) of the seed-bank functional types (cf. Table 3) based on the seed-bank composition and significance of observed differences with the ancient land-use intensity gradient, as tested by a Jonckeere–Terpstra test (Siegel and Castellan, Reference Siegel and Castellan1988)

Sign., level of significance; ***P ≤ 0.001, **0.001 < P ≤ 0.01, *0.01 < P ≤ 0.05, n.s. not significant. a,b,c homogeneous subsets.