Introduction
Spaceborne interferometric synthetic aperture radar (InSAR) was introduced by Goldstein and others (Reference Goldstein, Zebker and Werner1988) and first applied to glaciers by Goldstein and others (Reference Goldstein, Engelhard, Kamb and Frolich1993). It takes advantage of the coherence between the phases of two SAR scenes from the same satellite orbit, even in areas with poor visual contrast like ice caps and glaciers. As it depends on active microwave sensing, SAR data can also be acquired through clouds and at night. Information on movement and elevation are both contained in a single interferometric phase (Gens and van Genderen Reference Gens and van Genderen1996; Joughin and others Reference Joughin, Tulaczyk, Fahnestock and Kwok1996).
Differential interferometry represents a means to separate displacement from topographic information. While Gabriel and others (Reference Gabriel, Goldstein and Zebker1989) described DInSAR using three SAR scenes (3-pass DInSAR without DEM) over land, Kwok and Fahnestock (Reference Kwok and Fahnestock1996) obtained glacier velocities by differentiating the fringe structures in two independent interferograms (4-pass DInSAR without DEM). Cumming and others (Reference Cumming, Valero, Vachon, Mattar, Geudtner and Gray1997) applied 2-pass DInSAR with DEM to measure alpine glacier flow. These different approaches have become established glacier monitoring tools, which are constantly being refined (Rosen and others, Reference Rosen, Hensley, Joughin, Li, Madsen, Rodriguez and Goldstein2000; Rott, Reference Rott2009). Because of the short 24 h time span and hence the high potential for coherence between SAR scene acquisitions, the ERS-1/-2 tandem mission of 1995/96 still represents a unique data source for interferometric and glaciological analyses (Eldhuset and others Reference Eldhuset, Andersen, Hauge, Isaksson and Weydahl2003; Wangensteen and others Reference Wangensteen, Weydahl and Hagen2005; Rott Reference Rott2009). Examples of interferometric surge research are given in Joughin and others (Reference Joughin, Tulaczyk, Fahnestock and Kwok1996), Murray and others (Reference Murray, Luckman, Strozzi and Nuttall2003) and Pritchard and others (Reference Pritchard, Murray, Strozzi, Barr and Luckman2005).
This study focuses on glacier dynamics, aiming at a reconstruction of glacier flow with ERS-1/-2 data from April and May 1996 and a SPOT5 DEM from 2007. This allows a look into the past quiescent phase of Comfortlessbreen (Fig. 1) about a decade before its surge (Sund and others Reference Sund, Eiken, Hagen and Kääb2009; Sund and Eiken Reference Sund and Eiken2010), to infer 1996 velocities. The goal of this paper is to render a thorough and well illustrated, low threshold description of the DInSAR workflow necessary to arrive at movement information. The entry into differential interferometry shall thus be facilitated.
Comfortlessbreen study area on Svalbard archipelago. Background: section of a modified C-band SAR amplitude image (5 April 1996) by ERS 1.

Geographical setting and glacier surges
Svalbard lies in the North Atlantic (74° to 84° N, 10° to 34° E), south of the Arctic Ocean (Fig. 1). Glaciers cover about 60 % of the archipelago. Many of them are surge-type (Hagen and others Reference Hagen, Liestøl, Roland and Jørgensen1993; Sund and others Reference Sund, Eiken, Hagen and Kääb2009) with typically low quiescent-phase velocities around 10 m a−1 (Melvold and Hagen Reference Melvold and Hagen1998; Nuttall and others Reference Nuttall, Hagen and Dowdeswell1997). Glacier surges are sudden increases in velocity of 10 to 1000 times the quiescent flow, rapidly transferring large ice masses from higher to lower areas (Meier and Post Reference Meier and Post1969; Murray and others Reference Murray, Luckman, Strozzi and Nuttall2003). In Svalbard, surges tend to last in total at least ~10 a (Dowdeswell and others Reference Dowdeswell, Hamilton and Hagen1991; Sund and others Reference Sund, Eiken, Hagen and Kääb2009) and quiescence 30 to 500 a (Dowdeswell and others Reference Dowdeswell, Hamilton and Hagen1991; Hagen and others Reference Hagen, Liestøl, Roland and Jørgensen1993). Between surges, velocities remain too low to maintain balance, which causes build-up of glacier mass (Melvold and Hagen Reference Melvold and Hagen1998). More knowledge on surge dynamics is important because surges can have great impact on glacier geometry, and may affect assessments relating to climate change.
Some 20 km south of Ny Ålesund on Spitsbergen, the glacier Comfortlessbreen (Fig. 1), with an area of ~ 65 km2 and a length of ~ 15 km, is flowing in a northwesterly direction from 1000 m above sea level (a.s.l.) to its partly tidewater terminus (Hagen and others Reference Hagen, Liestøl, Roland and Jørgensen1993). Its recent surge is described by Sund and others (Reference Sund, Eiken, Hagen and Kääb2009) and Sund and Eiken (Reference Sund and Eiken2010).
Data basis
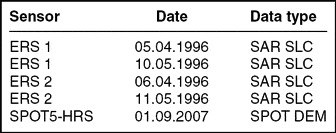
Four C-band SAR scenes from April and May 1996 from the 1-day repeat-pass tandem mission of ERS-1/-2 are used for differential SAR interferometry over Comfortlessbreen together with a SPOT5 HRS (High Resolution Stereoscopic) SPIRIT DEM from 2007 (Korona and others Reference Korona, Berthier, Bernard, Remy and Thouvenot2009) with 40 m resolution and 5 m height accuracy (Table 1). Each SAR image covers an area of ~ 100 × 100 km and was provided in single look complex (SLC) format to be read into the Gamma Remote Sensing software (Wegmüller and Werner Reference Wegmüller and Werner1997) in which all data processing was done.
Data basis of the study.

Differential SAR interferometry
Interferometric synthetic aperture radar (InSAR) principles
An SLC SAR image s consists of amplitude, magnitude or intensity information |s| representing backscatter from the ground as perceived in Fig. 1, and phase angles ϕ recorded as fractions (0 – 2π) of a radar wavelength λ with an ambiguous number of full wavelengths. The number of fully completed wavelengths of a radar signal is not measured (Hanssen Reference Hanssen2001):

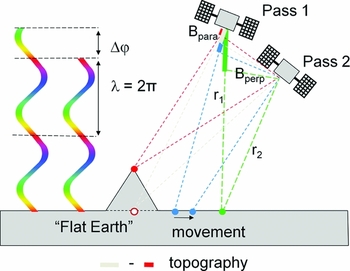
The phases of one SAR image alone contain few interpretable features, yet when using the phase differences or interferometric phases Δϕ between two images of the same orbit and area (Fig. 2), the phase differences Δϕ can be represented in an interferogram to infer ground information (Gens and van Genderen Reference Gens and van Genderen1996; Moholdt Reference Moholdt2010):
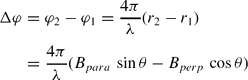
with the distances r 1 and r 2 from a point on the ground to the satellite antenna on the first and the second pass respectively (Fig. 2) and the radar look angle θ between nadir and the target on the ground (topographic information). Those two orbit passes are separated from one another temporally by a temporal baseline Bt = 24 h in the case of the ERS-1/-2 tandem mission, and in space by the spatial baseline Bs, corresponding to the distance between the two satellite orbits. Bs can be expressed by parallel baseline Bpara and perpendicular baseline Bperp (Fig. 2); those are calculated and refined during interferogram generation.
Two colour fringes with their interferometric phase Δϕ (left). Across-track InSAR geometry with fat parallel baseline Bpara, perpendicular baseline Bperp and antenna distances r 1 and r 2 (right). Satellite flight direction perpendicular to figure plane.

In case of terrain displacement or deformation within the time interval corresponding to Bt, this will lead to a distinct signal in phase difference next to the inherent topographic contribution (Fig. 2). Hence Eq. 2 needs to be expanded with a deformation term (Kwok and Fahnestock Reference Kwok and Fahnestock1996; Wangensteen and others Reference Wangensteen, Weydahl and Hagen2005):
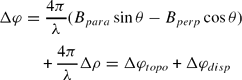
where Δρ represents the displacement component in line-of-sight direction. This shows that the topography summand Δϕtopo is dependent on a spatial baseline Bs, while the movement summand only depends on Bt, but not on any Bs (Wangensteen and others Reference Wangensteen, Weydahl and Hagen2005; Moholdt Reference Moholdt2010).
Phase coherence and interferogram generation
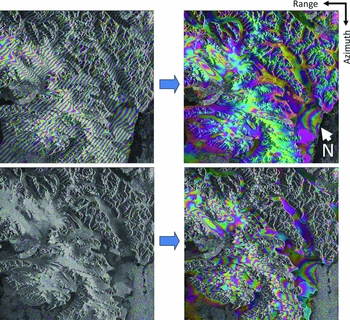
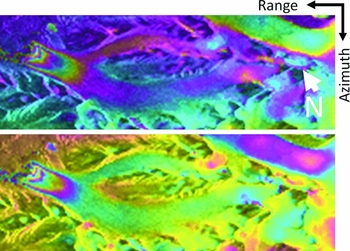
Very accurate image co-registration as well as high coherence (Fig. 3), that is only slight differences within a SLC image pair, are mandatory for interferogram generation (Rosen and others Reference Rosen, Hensley, Joughin, Li, Madsen, Rodriguez and Goldstein2000; Weydahl Reference Weydahl2001). Offset estimation via iterative image matching was used to co-register the two respective image pairs (Table 1), which were selected because of their high coherence (Weydahl Reference Weydahl2001), with sub-pixel precision. Then one complex ERS-1 SAR image was multiplied with the complex conjugate of the other ERS-2 image taken 24 h later (Rosen and others Reference Rosen, Hensley, Joughin, Li, Madsen, Rodriguez and Goldstein2000; Rott Reference Rott2009). In the resulting raw interferogram, the phase differences Δϕ between the two satellite images are displayed modulo 2π as colour fringes (Figs. 2, 4). Those phase differences contain a mixed signal made up not only of topography (Δϕtopo) and displacement (Δϕdisp) as represented in Eq. 3, but also of contributions from flat Earth trend (Δϕflat), and possibly atmospheric influences (Δϕatmo) and noise (Δϕnoise) (Weydahl and others Reference Weydahl, Eldhuset and Hauge2001; Fig. 4, left):

Δϕflat and Δϕtopo result from the sideward SAR viewing geometry and can be precisely computed with accurate orbit data and DEMs; Δϕdisp only captures displacements in range line of sight of the sensor (Cumming and others 1989; Kwok and Fahnestock Reference Kwok and Fahnestock1996; Rott Reference Rott2009). Fast movements appear blurred in radar applications due to decorrelation or coherence loss (Weydahl, Reference Weydahl2001; Eldhuset and others, Reference Eldhuset, Andersen, Hauge, Isaksson and Weydahl2003). Therefore, radar imagery better reflects glacial accumulation areas and slow-flowing glacier parts (Goldstein et al, Reference Goldstein, Engelhard, Kamb and Frolich1993; Joughin and others, Reference Joughin, Tulaczyk, Fahnestock and Kwok1996; Eldhuset and others, Reference Eldhuset, Andersen, Hauge, Isaksson and Weydahl2003; Pritchard and others, Reference Pritchard, Murray, Strozzi, Barr and Luckman2005).
Phase coherence between image pairs. Left: 5–6 April 1996, right: 10–11 May 1996. Bright, yellow areas represent high coherence values. Intermediate, pink tones indicate moderate correlation, while darker, turquoise zones imply low coherence.

Interferograms of 5–6 April 1996 (top) and 10–11 May 1996 (bottom) wrapped around modulus 2π with amplitude images as background. Phases from flat Earth, topography, movement, atmosphere and noise (left). Flat Earth phase corrected (right).

Flat Earth phase removal constitutes the first step in interferometric processing (Fig. 4), followed by filtering (Rott Reference Rott2009; Wegmüller and Werner Reference Wegmüller and Werner1997). Remaining phase differences are then due to topography, movement, atmosphere and noise (Fig. 4, right). When working with only one single SLC pair as in basic InSAR processing (Goldstein and others Reference Goldstein, Engelhard, Kamb and Frolich1993), the Δϕ constituents (Eq. 4) cannot be further resolved without additional supporting data; ground control points, other ground truth or DInSAR applications (see 4.4.) are necessary to this end.
Phase unwrapping
Fig. 4 represents intermediate InSAR results; phase unwrapping must be effectuated in order to obtain a final interferogram. This can then be interpreted correctly, as its fringes represent continuous values instead of being wrapped around modulus 2π. Phase unwrapping means adding integer multiples of 2π to Δϕ whenever it jumps back to 0 from 2π; a crucial and difficult step (Gens and van Genderen Reference Gens and van Genderen1996; Wegmüller and Werner Reference Wegmüller and Werner1997; Moholdt Reference Moholdt2010). Low coherence cannot be unwrapped and has to be masked out (Fig. 5). Several algorithms have been developed for unwrapping; implemented in Gamma (Wegmüller and Werner Reference Wegmüller and Werner1997) are the branch-cut region growing algorithm (Goldstein and others Reference Goldstein, Zebker and Werner1988) and the minimum cost flow (MCF) technique with a triangular irregular network (TIN) (Costantini Reference Costantini1998). Both approaches were tested in this study.
Coherence masks with threshold 0.8 for the interferograms of April (left) and May 1996 (right). Coherence < 0.8 is masked out for unwrapping (black colour).

2-pass differential InSAR (DInSAR) with DEM
DInSAR consists in subtracting the interferometric phases of one interferogram (Δϕ1) from another one (Δϕ2) to separate the phase contributions from topography and movement (Eqs. 3, 4) by subtracting and thus removing either of those phases. Hence pure terrain displacement can be derived without residual height information, or alternatively pure DEM information without motion signals. The InSAR baselines Bs1 and Bs2 must differ for this effect, while motion is assumed to be constant (Rott Reference Rott2009):
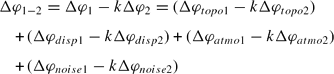
A scaling factor k is introduced at this point. When aiming at the topographic phase component Δϕ1−2=Δϕtopo12, k must equal 1 (Moholdt Reference Moholdt2010). As topography depends on Bs, while movement does not (Eq. 3), constant movement becomes fully subtracted for k = 1. Then topography or DEM information can be generated from Eq. 5. However, when aiming at displacement Δϕ1−2=Δϕdisp12, a scaling factor k≠1 has to be used to allow for a complete removal of the perpendicular baseline and hence the topographic phase. Phase noise may increase due to interferogram scaling (Eq. 5).
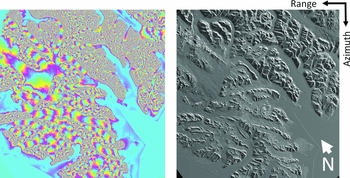
Differential interferometry can be done by 2-pass DInSAR with two tandem SAR scenes and a DEM (Cumming and others 1989) as in this study, or by combining three (3-pass DInSAR) or more satellite scenes from the same orbit. Two interferograms are generated and then subtracted from one another (Joughin and others Reference Joughin, Tulaczyk, Fahnestock and Kwok1996; Kwok and Fahnestock Reference Kwok and Fahnestock1996; Eldhuset and others Reference Eldhuset, Andersen, Hauge, Isaksson and Weydahl2003). In 2-pass DInSAR, a reference interferogram with Δϕ corresponding to surface topography is simulated based on a DEM in radar geometry (Fig. 6). Thus the DEM must be read into radar doppler coordinates (RDC). An initial geocoding look-up table links Universal Transverse Mercator (UTM) coordinates to range-doppler geometry (Fig. 6, left). Then a SAR intensity image is simulated based on DEM and SAR imaging geometry (Fig. 6, right). Offsets are iteratively improved via pixel matching and subsequently the look-up table, so that a fine registration of the DEM becomes possible. Forward geocoding finally allows the transformation of the DEM UTM projection into RDC with improved coordinate relationships (Wegmüller and Werner Reference Wegmüller and Werner1997).
Simulated interferogram from SPOT5 DEM of 2007 transformed from map projection into radar geometry (left) based on simulated amplitude image from DEM in RDC (right).

Afterwards, a first wrapped differential interferogram (Fig. 8, top) is generated by subtracting the unwrapped simulated phase kΔϕ2 (Eq. 5) from the complex, that is wrapped interferogram Δϕ1 (Fig. 4, left); both still contain Δϕflat. Residual linear phase trends are determined by Fast Fourier Transform and removed by baseline model refinement. The corresponding unwrapped unflattened topographic interferometric phase is then resimulated with a baseline refined with help of the RDC DEM, and a second differential interferogram produced (Fig. 8, bottom).
Results
When unwrapping the interferograms, the MCF technique with a TIN (Costantini Reference Costantini1998) led to smoother and more continuous results than the branch-cut algorithm (Goldstein and others Reference Goldstein, Zebker and Werner1988), therefore it was given preference in this study. Fig. 7 shows the maximum spatial unwrapping extent when using 5 × 5 tiles, which divide the image into 25 rectangles. Those tiles are unwrapped individually with a certain overlap and then reassembled by the algorithm. A few horizontal and vertical linear jumps in the colour fringes remain from tiling in Fig. 7. Besides, some baseline effects from the lower right to the higher left corner can be observed (Fig. 7, left). The final interferograms were generated using 3 × 2 tiles and a reduced image subset. The elevation difference corresponding to one 2π fringe in an unwrapped interferogram is (Weydahl and others Reference Weydahl, Eldhuset and Hauge2001):
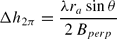
with ra being antenna distance r 1 or r 2. For 5-6 April 1996 with Bperp ~ 12 m, one fringe represents Δh 2π=793 m of altitude, and for 10-11 May 1996 (Bperp ~ −66 m) 144 m.
InSAR phase unwrapping using MCF with linear jumps due to tile borders, phase inconsistencies and some baseline effects. Left: 5–6 April 1996 (Bperp ~ 12 m), right: 10–11 May 1996 (Bperp ~ −66 m).

Comfortlessbreen. Top: first complex-valued differential interferogram based on ERS-1/-2 data of 5-6 April 1996 and the SPOT-5 DEM. Linear colour shift from top left to bottom right due to small errors in the baseline model. Bottom: refined complex-valued differential interferogram after removal of linear phase trends via baseline residual correction.

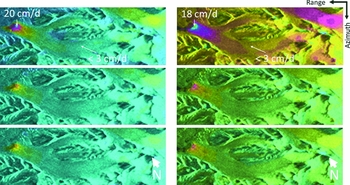
Glacier velocities in line-of-sight between scene acquisitions can be derived from the differential phase (Murray and others Reference Murray, Luckman, Strozzi and Nuttall2003; Wangensteen and others Reference Wangensteen, Weydahl and Hagen2005) after filtering and unwrapping by MCF, leading to orthonormal displacement maps for horizontal, vertical and look vector movement component respectively (Fig. 9). The DInSAR analysis of Comfortlessbreen reveals horizontal displacements of ~ 20 cm d−1 (5-6 April 1996) and ~18 cm d−1 (10-11 May 1996) at the glacier terminus and < 3 cm d−1 in the middle and upper glacier portions (Fig. 9). These measured velocities correspond to <11 m a−1 along most of the glacier, while they increase towards 73 m a−1 in the lowermost 2.5 km, respectively. In the topmost area of the glacier, velocities of around 6 cm d−1 can be noted, which is commensurate to 22 m a−1.
Comfortlessbreen glacier flow. Filtered and unwrapped differential interferograms transformed into displacement maps (left: 5–6 April 1996 and SPOT5 DEM, right: 10–11 May 1996 and SPOT5 DEM): horizontal (top), vertical (middle) and movement along the look vector (bottom) with 20 cm/d−1 per full colour cycle (from cyan to magenta).

Discussion
The DInSAR displacement rates stated above are consistent for both April and May scenes and indicate a pre-surge velocity level on Comfortlessbreen in 1996. For Svalbard glaciers known to have surged, low velocities around 10 m a−1 are typically measured during quiescence (Nuttall and others Reference Nuttall, Hagen and Dowdeswell1997; Melvold and Hagen Reference Melvold and Hagen1998) due to their polythermal regime. Tidewater glaciers commonly increase velocities towards the terminus (Vieli and others Reference Vieli, Jania, Blatter and Funk2004), as is the case here (Fig. 9). The ratio from lowest (< 3 cm d−1) to highest (20 cm d−1) velocities is 7 (11 m a−1 to 73 m a−1). Increasing velocities in the cirque region in spring 1996 (Fig. 9, top) may represent the first indicator of surge initiation, surge stage 1 as suggested by Sund and others (Reference Sund, Eiken, Hagen and Kääb2009). During surge in 2008 however, this pattern changed. Despite generally increased velocities of ~ 2 m d−1 (730 m a−1), the velocity gradient, was reduced, ranging from 1.17 m d−1 (427 m a−1) at mid-glacier to 2.06 m d−1 (752 m a−1) at the terminus (Sund and Eiken Reference Sund and Eiken2010; M. Sund, personal communication, 2011), hence reducing the velocity ratio along glacier to < 2. DInSAR thus provides a basis for the comparison of changes from quiescence displacement levels to surge.
The potential accuracy of repeat-pass InSAR surface change detection lies in the millimeter range (Gabriel and others Reference Gabriel, Goldstein and Zebker1989; Goldstein and others Reference Goldstein, Engelhard, Kamb and Frolich1993; Weydahl Reference Weydahl2001). Yet Δϕ decorrelates for ERS SAR images at ~ 7.2 cm for horizontal movements in line of sight (Weydahl Reference Weydahl2001). To the central west in Fig. 3, fast flowing Kronebreen with its 2 m d−1 (Weydahl Reference Weydahl2001; Eldhuset and others Reference Eldhuset, Andersen, Hauge, Isaksson and Weydahl2003) appears very blue and decorrelated especially towards its margins. Such speeds as also reached in the Comfortlessbreen surge in 2008 (Sund and Eiken Reference Sund and Eiken2010) cannot be captured by DInSAR; SAR offset tracking and optical image matching represent possible alternatives.
Atmospheric influences, imprecise orbit information, signal noise and assumption of displacement along the elevation gradient represent the principal error sources in InSAR (Strozzi and others Reference Strozzi, Delaloye, Kääb, Ambrosi, Perruchoud and Wegmüller2010). An assumed error in line-of-sight displacement of ≤ 0.7 cm for ERS-1/-2 results from a total phase error of a quarter wavelength (Crosetto and others Reference Crosetto, Monserrat, Bremmer, Hanssen, Capes and Marsh2008; Strozzi and others Reference Strozzi, Delaloye, Kääb, Ambrosi, Perruchoud and Wegmüller2010). As shown in Eqs. 4 and 5, contributions from atmospheric influences (Δϕatmo) and noise (Δϕnoise) are still contained in the generated (differential) interferograms (Weydahl and others Reference Weydahl, Eldhuset and Hauge2001; Rott Reference Rott2009). Ideally, Δϕatmo and Δϕnoise would be fully subtracted in the DInSAR process. However, Δϕatmo may differ between repeat pass acquisitions due to varying atmospheric water vapour content. This cannot easily be corrected for, as the necessary additional data would have to cover the entirety of the atmospheric strata and is seldom available (Gens and van Genderen Reference Gens and van Genderen1996; Hanssen Reference Hanssen2001; Rott Reference Rott2009). As shown in Fig. 3, the phase coherence of the May image set is higher than in the April one, in which some temporal decorrelation over the northern central part of the scene occurs, possibly due to snowfall, snow drift, melting or atmospheric influences (Rott Reference Rott2009). Besides, SAR data penetrates the ground surface to a certain extent. Hence inferences on and even below the glacier surface are possible, concerning roughness, wetness and melting conditions amongst others.
Because of the introduction of k, Δϕnoise may increase. In order to reduce noise or speckle, a salt-and-pepper effect due to interferences between the many scatterers within one image pixel, the image grid can be spatially transformed to a lower resolution by averaging several looks at the same pixel, resulting in a multi-look image (MLI) with better amplitude correlation and phase coherence between images at the expense of a lower spatial resolution (Kwok and Fahnestock Reference Kwok and Fahnestock1996). MLI generation represents a means to find out how much noise is left in the interferograms; therefore different MLI parameter settings should be compared to the results given here. With regard to the velocities given earlier, the errors cannot be precisely calculated within Gamma for all pixel values of a DInSAR scene. Testing all possible combinations of ERS-1/-2 SAR scenes together with more DEMs represents a means to account for the various possible error sources.
A short Bperp is advantageous for deriving displacement such as glacier flow, as it leads to extremely high topographic height spans represented within one fringe, like Δh 2π=793 m as given for the April pair. This reduces DEM influence to a minimum, as most fringes in the corresponding interferogram then result from movement. The tallest peaks on Svalbard reach ~1700 m a.s.l., thus a maximum of only two entire colour cycles stem from topography in the case of Bperp ~ 12 m (Fig. 4, top). As Comfortlessbreen reaches up to 1000 m a.s.l., some 1.3 colour cycles represent the maximum possible topographic contribution which might still be found in the unwrapped interferogram in Fig. 7 (left) which has not been differentiated from a simulated radar DEM phase. Since interferometric sensitivity to displacement is independent of the baseline Bperp, while it increases with the baseline for topography, short (or zero) spatial baselines are advantageous for InSAR displacement assessments and provide better coherence (Rott Reference Rott2009).
Conclusions and outlook
This study provides a step-by-step introduction to differential interferometry exemplified by Comfortlessbreen. 2-pass DInSAR with DEM yields useful and consistent displacement maps for 1996, a period where little ground truth is available for the glacier. The results allow for comparison between surge and quiescence levels, showing a reduction in velocity gradient along glacier within ~20 years to a fourth, even though velocities increased 10 to 60 times. More flow analyses are necessary to assess surge behaviour.
It would be interesting to look further into atmospheric influences by comparing our results to local meteorological data, which are limited to ground observations in 1996. No accurate corrections are hence possible. By assessing different DInSAR combinations of the ERS-1/-2 scenes with and without DEMs, conclusions could be drawn on whether the decorrelation in the April set is due to changes in the atmosphere or on the ground.
Our results are also valuable with regard to new tandem missions which allow for interferometric analyses again. For example, the COSMO/SkyMed constellation with its current four satellites (X-band SAR) can be flown in InSAR modus with either 1-day, 4-days, 8-days or 16 days tandem recording. TerraSAR-X and TanDEM-X or the C-band Radarsat Constellation Mission represent other sources of interferometry-compliant SAR data.
Acknowledgements
The European Space Agency (ESA) provided the SAR data (AOPOL 4127), the French Space Agency (CNES) the SPOT5-HRS DEM obtained through the IPY-SPIRIT programme (Korona and others Reference Korona, Berthier, Bernard, Remy and Thouvenot2009) © CNES 2008 and SPOT Image 2008 all rights reserved. We thank R.G. Way and G. Moholdt for Gamma scripting support. G. Moholdt and the Remote Sensing Colloquium at the Department of Geosciences, University of Oslo, kindly reviewed an earlier manuscript. We are also grateful for the reviews by Polar Record and an Early Career Scientist Travel Grant for ICRSS by the UK Polar Network. The Center for Remote Sensing of Land Surfaces, University of Bonn, Germany, currently hosts N.J. Schneevoigt. M. Sund was partly at the University Centre in Svalbard.