



1 Introduction
Surfactants are surface-active compounds that play an important role as cleaning, wetting or foaming agents in a range of practical applications and everyday products. They can be produced naturally, for example by the lungs (Grotberg Reference Grotberg1994) and by microorganisms (De et al. Reference De, Malik, Ghosh, Saha and Saha2015), but they are also manufactured for use in many commercial products such as detergents, soaps and shampoos. The widespread use of surfactants is mainly a result of their chemical structure, comprising an amphiphilic molecule that contains a hydrophilic head and a hydrophobic tail; hence in fluid mixtures such as water–oil systems, surfactants tend to arrange themselves at the interface with their heads in the aqueous phase and their tails in the oil phase. It is also possible for surfactants to be soluble in either of the two phases, either as individual molecules (at sufficiently low concentrations) or colloidal-sized aggregates called micelles (at higher concentrations). The micelles occur only when the concentration is above a critical value called the critical micelle concentration (CMC), and are formed by directing their oil-soluble tails away from the aqueous phase and trapping small droplets of oil inside. Micellisation can therefore promote the mixing of immiscible liquids and can play a crucial role in cleaning processes.
One of the key functions of surfactants is to reduce the surface tension at fluid interfaces. It is known that for bulk concentrations below the CMC, the surface tension decreases with the surfactant concentration according to the Gibbs isotherm (e.g. Chang & Franses Reference Chang and Franses1995). Experimental surface-tension measurements have indicated, however, that the surface tension reaches a saturation level as the surfactant concentration in the bulk becomes larger than the CMC (Song et al. Reference Song, Couzis, Somasundaran and Maldarelli2006). As soon as the bulk concentration reaches the CMC, any additional surfactant mass is readily available to form micelles and it is expected that the interface and bulk monomer concentrations would remain constant. This implies that at equilibrium and for bulk concentrations above the CMC, there is a disassociation between the change in surfactant mass and the surface tension (which is not sensitive to the concentration of micelles).
The reduction of the surface tension in the presence of surfactant (at sufficiently low concentrations) gives rise to so-called Marangoni forces that act locally on the interface and drive the fluid towards regions of higher surface tension. This phenomenon can significantly influence microscopic multiphase flows where surface tension is the dominant force. It is hence evident that surfactants can be used as a means of manipulating flows and controlling interfacial instabilities (examples of such instabilities arising in film spreading processes are given in the review by Matar & Craster (Reference Matar and Craster2009)). The ability to control and manipulate multi-layer systems, by either suppressing or enhancing instabilities, is essential in numerous applications that either benefit from a flat and smooth film or require interfacial travelling waves to enhance mass transport; examples include coating applications (Weinstein & Ruschak Reference Weinstein and Ruschak2004), oil recovery (Slattery Reference Slattery1974), foam drainage (Shaw Reference Shaw1992) and microfluidics technology (Craster & Matar Reference Craster and Matar2009). It is therefore of fundamental importance to understand the physical mechanisms responsible for interfacial instabilities.
The stability of interfacial flows has been studied extensively. In the absence of surfactants, Yih (Reference Yih1967) found that a two-layer parallel flow is unstable to perturbations of long wavelength. The instability occurs as long as the Reynolds number is non-zero and it requires a viscosity contrast across the interface. Yih’s work has been extended by other authors to perturbations of arbitrary wavelength (Renardy Reference Renardy1985; Yiantsios & Higgins Reference Yiantsios and Higgins1988) and to semi-infinite fluids (Hooper & Boyd Reference Hooper and Boyd1987) in order to identify the effect of bounding walls. The impact of surfactants on two-layer flows has been analysed predominantly for the case of insoluble surfactants. Linear stability studies indicated that the interface can be destabilised by insoluble surfactants even in the Stokes flow limit (Frenkel & Halpern Reference Frenkel and Halpern2002; Halpern & Frenkel Reference Halpern and Frenkel2003; Blyth & Pozrikidis Reference Blyth and Pozrikidis2004b ; Frenkel, Halpern & Schweiger Reference Frenkel, Halpern and Schweiger2019a ,Reference Frenkel, Halpern and Schweiger b ), and eventually becomes saturated to non-uniform states in the nonlinear regime (Blyth & Pozrikidis Reference Blyth and Pozrikidis2004b ; Pozrikidis Reference Pozrikidis2004a ; Wei Reference Wei2005; Frenkel & Halpern Reference Frenkel and Halpern2006; Bassom, Blyth & Papageorgiou Reference Bassom, Blyth and Papageorgiou2010; Samanta Reference Samanta2013; Kalogirou & Papageorgiou Reference Kalogirou and Papageorgiou2016; Frenkel & Halpern Reference Frenkel and Halpern2017; Kalogirou Reference Kalogirou2018).
There have been a number of studies considering the effect of soluble surfactants on the linear stability of falling liquid films (Ji & Setterwall Reference Ji and Setterwall1994; Karapetsas & Bontozoglou Reference Karapetsas and Bontozoglou2013, Reference Karapetsas and Bontozoglou2014) or two-layer channel flows (Sun & Fahmy Reference Sun and Fahmy2006; Zaisha et al. Reference Zaisha, Ping, Guangji and Chao2008; You, Zhang & Zheng Reference You, Zhang and Zheng2014; Picardo, Radhakrishna & Pushpavanam Reference Picardo, Radhakrishna and Pushpavanam2016). In the latter case, the papers were either based on the simplifying assumption of a non-deformable interface or considered surfactant soluble in both phases, with the surface tension linearly dependent on either bulk concentration. In this paper, we also consider dynamic transport of surfactant at the interface and include the adsorption kinetics. The literature considering flows in the presence of surfactant at high concentrations above the CMC is very limited and is restricted to single fluids with a free surface – see Breward & Howell (Reference Breward and Howell2004) for an analysis of steady straining flow of a micellar surfactant solution; Edmonstone, Craster & Matar (Reference Edmonstone, Craster and Matar2006) for a report on surfactant-induced fingering patterns observed in droplet spreading on clean films; Craster, Matar & Papageorgiou (Reference Craster, Matar and Papageorgiou2009) for a study on break up of surfactant-laden jets; Karapetsas, Matar & Craster (Reference Karapetsas, Matar and Craster2011) for a review of surfactant-enhanced spreading and superspreading on solid surfaces.
In this article, we present a detailed mathematical model describing a two-layer flow where one of the fluids is contaminated with soluble surfactant. Even though the surfactant could theoretically exist in both fluid layers, here it is only allowed to live in one of the fluids as this scenario is more relevant to practical applications involving water–oil systems, for instance in cleaning processes. The model incorporates surfactant in three different arrangements: molecules adsorbed at the interface, single molecules (monomers) in the bulk fluid and multi-molecule aggregates (micelles) in the bulk. The presence of soluble surfactants introduces additional complexity in the model due to the coupling of the interfacial dynamics with the dynamics in the bulk through mass exchange. To the best of our knowledge, this is the first study that considers a multi-layer flow with soluble surfactants above the CMC. The derived model integrates a number of salient physical properties that play an important role in the dynamics of surfactant-laden multi-layer flows, such as inertia, gravity, surface tension, Marangoni stresses, diffusion and mass transfer between the different surfactant forms. This model reduces to that of Kalogirou (Reference Kalogirou2018) (which is the most general model presented so far and includes the effects of inertia and density stratification) for a two-layer flow with an insoluble surfactant in appropriate limits. We perform a linear stability analysis that yields an eigenvalue problem for the wave speed, and obtain analytical expressions for the two dominant growth rates valid in the long-wave approximation. The linearised system is also solved numerically for perturbations of arbitrary wavelengths and results are presented for situations with bulk concentrations below or above the CMC.
In recent experimental work, Georgantaki, Vlachogiannis & Bontozoglou (Reference Georgantaki, Vlachogiannis and Bontozoglou2012, Reference Georgantaki, Vlachogiannis and Bontozoglou2016) investigated liquid film flow with soluble surfactants, and reported the formation of solitary waves preceded by capillary ripples as well as small-amplitude sinusoidal travelling waves. In other related experiments, Shen et al. (Reference Shen, Gleason, McKinley and Stone2002) studied fibre coating with surfactant solutions and investigated the thickening properties of the film in terms of the bulk surfactant concentration. Hashimoto et al. (Reference Hashimoto, Garstecki, Stone and Whitesides2008) considered the flow of surfactant-laden droplets in a microfluidic Hele-Shaw cell and found a range of flow patterns, including elongation of droplets and shear-driven instabilities. However, to our knowledge there are no experiments on two-layer channel flows with surfactants that could serve as a means of validation for our model.
The paper is organised as follows. In § 2 the physical problem is presented and the mathematical model is formulated. Linear stability analysis about the equilibrium state is performed in § 3 and asymptotic long-wave expansions are introduced. Numerical results for bulk concentrations below and above the CMC are presented and discussed in § 4. The main conclusions of this study can be found in § 5.
2 Mathematical model
The flow considered in this paper is illustrated in figure 1. We define a Cartesian coordinate system with horizontal coordinate
 $x$
and vertical coordinate
 $y$
, while time will be denoted by
 $t$
. The problem configuration comprises two immiscible viscous fluids that fill a long horizontal channel, consisting of two impermeable parallel plates at
 $y=0$
and
 $y=H$
. The two fluid layers are superposed and separated by a distinct interface, each occupying regions
 $0\leqslant y\leqslant h(x,t)$
and
 $h(x,t)\leqslant y\leqslant H$
, respectively. The interface at
 $y=h(x,t)$
can evolve in space and time, but in a steady scenario is flat at
 $y=h_{0}H$
, with
 $0<h_{0}<1$
. The flow is driven in the
 $x$
-direction by the motion of the upper plate with longitudinal velocity
 $U$
, as well as a constant pressure gradient
 $G=-(\unicode[STIX]{x2202}p/\unicode[STIX]{x2202}x)$
.
Problem configuration: two superposed fluid layers in a channel of fixed height
 $H$
, driven by the upper wall motion with velocity
 $U$
and by a constant pressure gradient
 $G=-(\unicode[STIX]{x2202}p/\unicode[STIX]{x2202}x)$
. The lower fluid is contaminated with surfactant molecules, which can also attach on the interface between the two fluids or form micelles. The size of the molecules is not to scale.

2.1 Hydrodynamics
The two fluids have densities
 $\unicode[STIX]{x1D70C}_{1}$
,
 $\unicode[STIX]{x1D70C}_{2}$
, viscosities
 $\unicode[STIX]{x1D707}_{1}$
,
 $\unicode[STIX]{x1D707}_{2}$
and thicknesses
 $H_{1}$
,
 $H_{2}$
, where subscripts
 $1$
and
 $2$
refer to the lower and upper fluids, respectively. We define the pressure
 $p_{j}$
and the velocity vector
 $\boldsymbol{u}_{j}=(u_{j},v_{j})$
in each region
 $j=1,2$
. The evolution of the flow in each fluid layer is governed by the mass and momentum equations, given by
 $$\begin{eqnarray}\displaystyle & \displaystyle \unicode[STIX]{x1D735}\boldsymbol{\cdot }\boldsymbol{u}_{j}=0, & \displaystyle\end{eqnarray}$$
 $$\begin{eqnarray}\displaystyle & \displaystyle \unicode[STIX]{x1D70C}_{j}\left(\frac{\unicode[STIX]{x2202}\boldsymbol{u}_{j}}{\unicode[STIX]{x2202}t}+\boldsymbol{u}_{j}\boldsymbol{\cdot }\unicode[STIX]{x1D735}\boldsymbol{u}_{j}\right)=-\unicode[STIX]{x1D735}p_{j}+\unicode[STIX]{x1D707}_{j}\unicode[STIX]{x1D6FB}^{2}\boldsymbol{u}_{j}+\unicode[STIX]{x1D70C}_{j}\boldsymbol{g}, & \displaystyle\end{eqnarray}$$
 $\unicode[STIX]{x1D735}=(\unicode[STIX]{x2202}/\unicode[STIX]{x2202}x,\unicode[STIX]{x2202}/\unicode[STIX]{x2202}y)$
and
 $\boldsymbol{g}=(0,-g)$
with gravitational acceleration
 $g$
.
On both walls the no-slip and no-penetration conditions for the fluid velocities are applied, namely
 $$\begin{eqnarray}\boldsymbol{u}_{1}=(0,0)\quad \text{at}\quad y=0,\quad \text{and}\quad \boldsymbol{u}_{2}=(U,0)\quad \text{at}\quad y=H.\end{eqnarray}$$
At the interface the fluid velocities need to be continuous, i.e.
 $$\begin{eqnarray}\boldsymbol{u}_{1}=\boldsymbol{u}_{2}\quad \text{at}\quad y=h(x,t),\end{eqnarray}$$
and should satisfy the kinematic condition
 $$\begin{eqnarray}\frac{\text{D}}{\text{D}t}(y-h(x,t))=0,\quad \text{with}\quad \frac{\text{D}}{\text{D}t}=\frac{\unicode[STIX]{x2202}}{\unicode[STIX]{x2202}t}+\boldsymbol{u}_{1}\bigg|_{y=h}\boldsymbol{\cdot }\unicode[STIX]{x1D735}.\end{eqnarray}$$
The above kinematic condition is accompanied by a dynamic condition that requires the stress to be continuous across the interface. The stress jump at the interface is given by (Stone & Leal Reference Stone and Leal1990; Milliken, Stone & Leal Reference Milliken, Stone and Leal1993)
 $$\begin{eqnarray}\boldsymbol{n}\boldsymbol{\cdot }\left(\unicode[STIX]{x1D748}_{1}-\unicode[STIX]{x1D748}_{2}\right)=\unicode[STIX]{x1D705}\unicode[STIX]{x1D6FE}\boldsymbol{n}-\unicode[STIX]{x1D735}_{s}\unicode[STIX]{x1D6FE},\end{eqnarray}$$
where
 $\unicode[STIX]{x1D6FE}$
is the surface tension and
 $\unicode[STIX]{x1D748}_{j}$
is the stress tensor in fluid
 $j$
defined by (Batchelor Reference Batchelor1967)
 $$\begin{eqnarray}\unicode[STIX]{x1D748}_{j}=-p_{j}\boldsymbol{I}+\unicode[STIX]{x1D707}_{j}(\unicode[STIX]{x1D735}\boldsymbol{u}+(\unicode[STIX]{x1D735}\boldsymbol{u})^{T}),\quad j=1,2.\end{eqnarray}$$
Also,
 $\boldsymbol{n}$
is the unit normal vector (pointing into fluid 1),
 $\unicode[STIX]{x1D735}_{s}$
is the surface gradient operator and
 $\unicode[STIX]{x1D705}$
is the interfacial curvature, given by
 $$\begin{eqnarray}\boldsymbol{n}=\frac{(h_{x},-1)}{\sqrt{1+h_{x}^{2}}},\quad \unicode[STIX]{x1D735}_{s}=\frac{(1,h_{x})}{1+h_{x}^{2}}\unicode[STIX]{x2202}_{x},\quad \unicode[STIX]{x1D705}=\unicode[STIX]{x1D735}_{s}\boldsymbol{\cdot }\boldsymbol{n}=\frac{h_{xx}}{(1+h_{x}^{2})^{3/2}}.\end{eqnarray}$$
Equation (2.5a
) takes into account the capillary pressure jump due to interfacial curvature (normal to the interface) and the Marangoni force arising as a result of the variability of surface tension due to the presence of surfactant (in the tangential direction). The stress balance in the normal and tangential directions is provided by taking the dot product of (2.5a
) with the unit normal vector
 $\boldsymbol{n}$
from (2.5c
) and unit tangent vector
 $\boldsymbol{t}=(1,h_{x})/\sqrt{1+h_{x}^{2}}$
, respectively, and is equal to
 $$\begin{eqnarray}[\boldsymbol{n}\boldsymbol{\cdot }(\boldsymbol{n}\boldsymbol{\cdot }\unicode[STIX]{x1D748}_{j})]_{2}^{1}=\unicode[STIX]{x1D705}\unicode[STIX]{x1D6FE},\quad [\boldsymbol{t}\boldsymbol{\cdot }(\boldsymbol{n}\boldsymbol{\cdot }\unicode[STIX]{x1D748}_{j})]_{2}^{1}=-\boldsymbol{t}\boldsymbol{\cdot }\unicode[STIX]{x1D735}_{s}\unicode[STIX]{x1D6FE},\end{eqnarray}$$
where the jump notation
 $\big[f_{j}\big]_{2}^{1}=f_{1}-f_{2}$
is used.
2.2 Surfactant transport and connection to surface tension
The lower fluid 1 is contaminated with surfactant of bulk concentration
 $C(x,y,t)$
. The surfactant molecules can get transferred onto the interface or form into micelles, whose concentrations are denoted by
 $\unicode[STIX]{x1D6E4}(x,t)$
and
 $M(x,y,t)$
, respectively. We suppose that the surfactant molecules join/leave the interface from/to the bulk with adsorption/desorption rates
 $k_{a}$
,
 $k_{d}$
, and that the micelles form and break up with kinetic rate constants
 $k_{b}$
,
 $k_{m}$
, respectively (figure 2). It is also assumed that the micelles are monodispersed (Shaw Reference Shaw1992) and each micelle has a preferred size consisting of
 $N$
monomers. We adopt the kinetic model presented by Edmonstone et al. (Reference Edmonstone, Craster and Matar2006), Craster et al. (Reference Craster, Matar and Papageorgiou2009), which introduces the following fluxes
 $$\begin{eqnarray}J_{b}=k_{a}C\left(1-\frac{\unicode[STIX]{x1D6E4}}{\unicode[STIX]{x1D6E4}_{\infty }}\right)-k_{d}\unicode[STIX]{x1D6E4},\quad \text{and}\quad J_{m}=k_{b}C^{N}-k_{m}M,\end{eqnarray}$$
where the bulk concentration
 $C$
in
 $J_{b}$
is evaluated at the interface
 $y=h$
. The above kinetic model is clearly nonlinear and takes into account that the space on the interface is limited, thus it can become fully packed with monomers at a finite concentration
 $\unicode[STIX]{x1D6E4}_{\infty }$
(the maximum packing concentration), at which no more molecules can be further adsorbed on the interface. The model also assumes that micelles are formed rapidly (since
 $N$
is typically large) when the critical micelle concentration is exceeded – this is due to the nonlinear term
 $C^{N}$
.
Schematic showing the adsorption and desorption kinetics at the interface, as well as the assembly and disassembly kinetics of micelles in the bulk. The size of the molecules is not to scale.

The surfactant monomers at the interface, the monomers in the bulk and the micelles follow appropriate transport equations, given by (Stone & Leal Reference Stone and Leal1990; Craster et al. Reference Craster, Matar and Papageorgiou2009; Karapetsas et al. Reference Karapetsas, Matar and Craster2011)
 $$\begin{eqnarray}\displaystyle & \displaystyle \frac{\text{d}\unicode[STIX]{x1D6E4}}{\text{d}t}-\dot{\boldsymbol{r}}\boldsymbol{\cdot }\unicode[STIX]{x1D735}_{s}\unicode[STIX]{x1D6E4}+\unicode[STIX]{x1D735}_{s}\boldsymbol{\cdot }\left(\unicode[STIX]{x1D6E4}\boldsymbol{u}_{S}\right)+\unicode[STIX]{x1D6E4}\unicode[STIX]{x1D705}\left(\boldsymbol{n}\boldsymbol{\cdot }\boldsymbol{u}_{I}\right)=\mathscr{D}_{s}\unicode[STIX]{x1D6FB}_{s}^{2}\unicode[STIX]{x1D6E4}+J_{b}, & \displaystyle\end{eqnarray}$$
 $$\begin{eqnarray}\displaystyle & \displaystyle C_{t}+\boldsymbol{u}_{1}\boldsymbol{\cdot }\unicode[STIX]{x1D735}C=\mathscr{D}_{b}\unicode[STIX]{x1D6FB}^{2}C-NJ_{m}, & \displaystyle\end{eqnarray}$$
 $$\begin{eqnarray}\displaystyle & \displaystyle M_{t}+\boldsymbol{u}_{1}\boldsymbol{\cdot }\unicode[STIX]{x1D735}M=\mathscr{D}_{m}\unicode[STIX]{x1D6FB}^{2}M+J_{m}, & \displaystyle\end{eqnarray}$$
with
 $\mathscr{D}_{s}$
,
 $\mathscr{D}_{b}$
and
 $\mathscr{D}_{m}$
denoting the surface, bulk and micelle surfactant diffusivities, respectively. The first term in the interfacial transport equation (2.8) represents the time derivative of a point on the interface which moves in a direction normal to the surface (with an arbitrary tangential component
 $\dot{\boldsymbol{r}}$
) – see Wong, Rumschitzki & Maldarelli (Reference Wong, Rumschitzki and Maldarelli1996) for a detailed derivation. Also,
 $\boldsymbol{u}_{I}$
and
 $\boldsymbol{u}_{S}$
denote the interfacial velocity and its tangential component, respectively, defined as follows
 $$\begin{eqnarray}\boldsymbol{u}_{I}=\boldsymbol{u}_{1}|_{y=h},\quad \boldsymbol{u}_{S}=(\boldsymbol{t}\boldsymbol{\cdot }\boldsymbol{u}_{I})\boldsymbol{t}.\end{eqnarray}$$
At the bottom channel wall, no-flux conditions are imposed for the bulk and micelle concentrations, i.e.
 $$\begin{eqnarray}\boldsymbol{n}\boldsymbol{\cdot }\unicode[STIX]{x1D735}C=0\quad \text{and}\quad \boldsymbol{n}\boldsymbol{\cdot }\unicode[STIX]{x1D735}M=0,\quad \text{at}\quad y=0,\end{eqnarray}$$
and on the fluid 1 side of the interface the following flux conditions are valid
 $$\begin{eqnarray}\mathscr{D}_{b}(\boldsymbol{n}\boldsymbol{\cdot }\unicode[STIX]{x1D735}C)=J_{b}\quad \text{and}\quad \mathscr{D}_{m}(\boldsymbol{n}\boldsymbol{\cdot }\unicode[STIX]{x1D735}M)=0,\quad \text{at}\quad y=h(x,t).\end{eqnarray}$$
The first condition in (2.13) describes the exchange of monomers between the interface and the nearby bulk fluid, while the second condition states that the flux of micelles onto the interface in zero. This condition is physically appropriate and essentially means that no micelles can adsorb directly to the interface, but they must first break up into monomers in the bulk.
Finally, the total mass
 ${\mathcal{M}}$
of surfactant in a domain of (arbitrary) length
 $L$
is conserved, that is
 $$\begin{eqnarray}{\mathcal{M}}=\int _{0}^{L}\int _{0}^{h}(C+NM)\,\text{d}y\,\text{d}x+\int _{0}^{L}\unicode[STIX]{x1D6E4}\,\text{d}x=\text{const.},\end{eqnarray}$$
where micelles can only form as long as the mass available is sufficient for the bulk concentration to exceed the critical micelle concentration.
When the bulk concentration
 $C$
is below the critical micelle concentration,
 $C_{CMC}$
, addition of surfactant in the bulk also increases the interface concentration
 $\unicode[STIX]{x1D6E4}$
, which in turn reduces the interfacial surface tension
 $\unicode[STIX]{x1D6FE}$
according to the Gibbs law (Chang & Franses Reference Chang and Franses1995; Pozrikidis Reference Pozrikidis2004b
)
 $$\begin{eqnarray}\text{d}\unicode[STIX]{x1D6FE}=-{\mathcal{R}}{\mathcal{T}}\unicode[STIX]{x1D6E4}\frac{\text{d}C_{s}}{C_{s}},\end{eqnarray}$$
where
 ${\mathcal{R}}$
is the ideal gas constant,
 ${\mathcal{T}}$
is the absolute temperature and
 $C_{s}$
denotes the bulk concentration at the interface. The Gibbs isotherm assumes an ideal bulk fluid and non-interacting molecules, and is valid when the bulk concentration and the surface concentration are at thermodynamic equilibrium (Hiemenz & Rajagopalan Reference Hiemenz and Rajagopalan1997), namely when
 $$\begin{eqnarray}J_{b}=0~\Leftrightarrow ~\frac{C_{s}}{\unicode[STIX]{x1D712}}=\frac{\unicode[STIX]{x1D6E4}}{\unicode[STIX]{x1D6E4}_{\infty }-\unicode[STIX]{x1D6E4}},\quad \text{with}\quad \unicode[STIX]{x1D712}=\frac{k_{d}\unicode[STIX]{x1D6E4}_{\infty }}{k_{a}}.\end{eqnarray}$$
Equation (2.16) is often called the Langmuir adsorption isotherm in the literature of reaction kinetics (Halpern & Grotberg Reference Halpern and Grotberg1992; Jensen & Grotberg Reference Jensen and Grotberg1993; Chang & Franses Reference Chang and Franses1995; Breward & Howell Reference Breward and Howell2004; Pozrikidis Reference Pozrikidis2004b ; Song et al. Reference Song, Couzis, Somasundaran and Maldarelli2006; Karapetsas et al. Reference Karapetsas, Matar and Craster2011). Using (2.16) in the Gibbs isotherm (2.15) and integrating, results in the well-known Langmuir equation of state
 $$\begin{eqnarray}\unicode[STIX]{x1D6FE}=\unicode[STIX]{x1D6FE}_{0}+{\mathcal{R}}{\mathcal{T}}\unicode[STIX]{x1D6E4}_{\infty }\ln \left(1-\frac{\unicode[STIX]{x1D6E4}}{\unicode[STIX]{x1D6E4}_{\infty }}\right),\end{eqnarray}$$
with
 $\unicode[STIX]{x1D6FE}_{0}$
corresponding to the clean surface tension in the absence of surfactant. Note that even though the above equation of state only relates the surface tension to the interfacial concentration, the surface tension is also affected by the bulk concentration through (2.16).
When the concentration in the bulk fluid becomes greater than the critical micelle concentration, then any additional surfactant in the bulk is converted into micelles leaving the interface concentration
 $\unicode[STIX]{x1D6E4}$
unchanged and, in turn, the surface-tension constant. The phenomenon of the surface tension settling to a constant value for bulk concentrations beyond the CMC is well known and has been reported in experimental surface-tension measurements – see Elworthy & Mysels (Reference Elworthy and Mysels1966), Zhmud, Tiberg & Kizling (Reference Zhmud, Tiberg and Kizling2000), Liao, Basaran & Franses (Reference Liao, Basaran and Franses2003), Song et al. (Reference Song, Couzis, Somasundaran and Maldarelli2006). It is important to note that in this argument ‘concentration in the bulk’ refers to the total concentration
 $C_{b}$
consisting of both monomer and micelle concentrations, i.e.
 $C_{b}=C+M=C+C^{N}$
(Danov et al.
Reference Danov, Vlahovska, Horozov, Dushkin, Kralchevsky, Mehreteab and Broze1996; Zhmud et al.
Reference Zhmud, Tiberg and Kizling2000). Consequently, the plot of the surface tension from (2.17) against
 $C_{b}$
is seen reaching a plateau at a critical value
 $\unicode[STIX]{x1D6FE}=\unicode[STIX]{x1D6FE}_{c}$
when
 $C_{b}\geqslant C_{CMC}$
(figure 3).
Variation of surface tension of water
 $\unicode[STIX]{x1D6FE}$
to surfactant concentration in the bulk
 $C_{b}$
, according to the Langmuir equation of state (2.17). The values used for parameters are taken from Song et al. (Reference Song, Couzis, Somasundaran and Maldarelli2006) and are:
 $\unicode[STIX]{x1D6FE}_{0}=72~\text{dyn}~\text{cm}^{-1}$
(surface tension of water at
 $25\,^{\circ }\text{C}$
),
 ${\mathcal{R}}=8.314~\text{N}~\text{m}~\text{K}^{-1}~\text{mol}^{-1}$
,
 ${\mathcal{T}}=298.15$
K (equal to
 $25\,^{\circ }\text{C}$
),
 $\unicode[STIX]{x1D6E4}_{\infty }=2.4\times 10^{-6}~\text{mol}~\text{m}^{-2}$
and
 $\unicode[STIX]{x1D712}=8.35\times 10^{-6}~\text{mol}~\text{m}^{-3}$
. The surface tension reaches a plateau at bulk concentration
 $C_{b}=9\times 10^{-3}~\text{mol}~\text{m}^{-3}$
, which confirms the experimental prediction of the CMC found by Song et al. (Reference Song, Couzis, Somasundaran and Maldarelli2006) (here we assume that each micelle consists of
 $N=100$
monomers).

2.3 Non-dimensionalisation
The problem is written in non-dimensional form by performing the following transformation of variables
 $$\begin{eqnarray}\displaystyle \left.\begin{array}{@{}c@{}}\displaystyle (x,y,h)=H(x^{\ast },y^{\ast },h^{\ast }),\quad (u_{j},v_{j})=U(u_{j}^{\ast },v_{j}^{\ast }),\quad t={\displaystyle \frac{H}{U}}t^{\ast },\quad p_{j}=\unicode[STIX]{x1D70C}_{1}U^{2}p_{j}^{\ast },\\ \displaystyle \unicode[STIX]{x1D6FE}=\unicode[STIX]{x1D6FE}_{0}\unicode[STIX]{x1D6FE}^{\ast },\quad \unicode[STIX]{x1D6E4}=\unicode[STIX]{x1D6E4}_{\infty }\unicode[STIX]{x1D6E4}^{\ast },\quad C=C_{CMC}C^{\ast },\quad M={\displaystyle \frac{C_{CMC}}{N}}M^{\ast },\\ \displaystyle J_{b}={\displaystyle \frac{\unicode[STIX]{x1D6E4}_{\infty }U}{H}}J_{b}^{\ast },\quad J_{m}={\displaystyle \frac{C_{CMC}U}{H}}J_{m}^{\ast },\quad {\mathcal{M}}=L\unicode[STIX]{x1D6E4}_{\infty }{\mathcal{M}}^{\ast },\end{array}\right\}\quad & & \displaystyle\end{eqnarray}$$
where
 $C_{CMC}=(k_{m}/Nk_{b})^{1/(N-1)}$
(Breward & Howell Reference Breward and Howell2004; Edmonstone et al.
Reference Edmonstone, Craster and Matar2006; Craster et al.
Reference Craster, Matar and Papageorgiou2009; Karapetsas et al.
Reference Karapetsas, Matar and Craster2011) and
 $L$
is the length of an (arbitrary) horizontal domain. A number of dimensionless parameters are therefore introduced and are given in table 1. To simplify the notation, we will henceforth drop the superscript stars from all dimensionless variables.
2.3.1 Governing equations within the fluids
The flow in each fluid region is described by the non-dimensional continuity and Navier–Stokes equations, given below for fluids
 $j=1,2$
,
 $$\begin{eqnarray}\displaystyle & \displaystyle u_{jx}+v_{jy}=0, & \displaystyle\end{eqnarray}$$
 $$\begin{eqnarray}\displaystyle & \displaystyle u_{jt}+u_{j}u_{jx}+v_{j}u_{jy}=-\frac{1}{r_{j}}p_{jx}+\frac{1}{Re_{j}}(u_{jxx}+u_{jyy}), & \displaystyle\end{eqnarray}$$
 $$\begin{eqnarray}\displaystyle & \displaystyle v_{jt}+u_{j}v_{jx}+v_{j}v_{jy}=-\frac{1}{r_{j}}p_{jy}+\frac{1}{Re_{j}}(v_{jxx}+v_{jyy})-\frac{1}{Fr^{2}}. & \displaystyle\end{eqnarray}$$
 $$\begin{eqnarray}\displaystyle & \displaystyle C_{t}+u_{1}C_{x}+v_{1}C_{y}=\frac{1}{Pe_{b}}(C_{xx}+C_{yy})-J_{m}, & \displaystyle\end{eqnarray}$$
 $$\begin{eqnarray}\displaystyle & \displaystyle M_{t}+u_{1}M_{x}+v_{1}M_{y}=\frac{1}{Pe_{m}}(M_{xx}+M_{yy})+J_{m}, & \displaystyle\end{eqnarray}$$
with the dimensionless flux
 $J_{m}$
given by
 $$\begin{eqnarray}J_{m}=K_{m}(C^{N}-M).\end{eqnarray}$$
The boundary conditions imposed on the channel walls are
 $$\begin{eqnarray}\displaystyle & \displaystyle \text{No slip: }u_{1}=0\quad \text{at }y=0,\quad \text{and}\quad u_{2}=1\quad \text{at }y=1, & \displaystyle\end{eqnarray}$$
 $$\begin{eqnarray}\displaystyle & \displaystyle \text{No penetration: }v_{1}=0\quad \text{at }y=0,\quad \text{and}\quad v_{2}=0\quad \text{at }y=1, & \displaystyle\end{eqnarray}$$
 $$\begin{eqnarray}\displaystyle & \displaystyle \text{No flux: }C_{y}=0\quad \text{at }y=0,\quad \text{and}\quad M_{y}=0\quad \text{at }y=0. & \displaystyle\end{eqnarray}$$
Non-dimensional parameters arising in the model formulation. Key to parameter names in table –
 $n$
: thickness ratio;
 $r$
: density ratio;
 $m$
: viscosity ratio;
 $Re$
: Reynolds number (note that
 $Re=Re_{1}=(m/r)Re_{2}$
);
 $We$
: Weber number;
 $Ca$
: capillary number;
 $Fr$
: Froude number;
 $Bo$
: Bond number;
 $Ma$
: Marangoni number;
 $Pe_{s}$
,
 $Pe_{b}$
,
 $Pe_{m}$
: Peclét numbers (surface, bulk, micelle);
 $Bi$
: Biot number. The following parameters are also defined:
 $r_{j}=\unicode[STIX]{x1D70C}_{j}/\unicode[STIX]{x1D70C}_{1}$
and
 $m_{j}=\unicode[STIX]{x1D707}_{j}/\unicode[STIX]{x1D707}_{1}$
,
 $j=1,2$
, such that
 $r_{1}=1$
,
 $r_{2}=r$
and
 $m_{1}=1$
,
 $m_{2}=m$
.

2.3.2 Coupling conditions at the interface
Continuity of horizontal and vertical velocities at the interface gives
 $$\begin{eqnarray}u_{1}=u_{2},\quad v_{1}=v_{2}\quad \text{at}\quad y=h(x,t),\end{eqnarray}$$
and the kinematic condition (2.4) becomes
 $$\begin{eqnarray}v_{1}=h_{t}+u_{1}h_{x}.\end{eqnarray}$$
The dimensionless forms of the normal and tangential stress jumps at the interface (2.6) are respectively given by
 $$\begin{eqnarray}\displaystyle & \displaystyle \left[-p_{j}(1+h_{x}^{2})+\frac{2r_{j}}{Re_{j}}\left(h_{x}^{2}u_{jx}+v_{jy}-h_{x}(u_{jy}+v_{jx})\right)\right]_{2}^{1}=\frac{\unicode[STIX]{x1D6FE}}{We}\frac{h_{xx}}{\sqrt{1+h_{x}^{2}}}, & \displaystyle\end{eqnarray}$$
 $$\begin{eqnarray}\displaystyle & \displaystyle \left[\vphantom{\frac{2r_{j}}{Re_{j}}}4m_{j}h_{x}u_{jx}+m_{j}(h_{x}^{2}-1)(u_{jy}+v_{jx})\right]_{2}^{1}=-\frac{\unicode[STIX]{x1D6FE}_{x}}{Ca}\sqrt{1+h_{x}^{2}}. & \displaystyle\end{eqnarray}$$
 $$\begin{eqnarray}\unicode[STIX]{x1D6FE}=1+\unicode[STIX]{x1D6FD}_{s}\ln (1-\unicode[STIX]{x1D6E4}),\end{eqnarray}$$
where parameter
 $\unicode[STIX]{x1D6FD}_{s}$
measures the sensitivity of interfacial tension to changes in the surface surfactant concentration. The transport equation for the interfacial surfactant concentration is
 $$\begin{eqnarray}\displaystyle \unicode[STIX]{x1D6E4}_{t}+\frac{h_{x}h_{tx}}{1+h_{x}^{2}}\unicode[STIX]{x1D6E4}+\frac{1}{\sqrt{1+h_{x}^{2}}}\left(\sqrt{1+h_{x}^{2}}\,u_{I}\unicode[STIX]{x1D6E4}\right)_{x}=\frac{1}{Pe_{s}}\frac{1}{\sqrt{1+h_{x}^{2}}}\left(\frac{\unicode[STIX]{x1D6E4}_{x}}{\sqrt{1+h_{x}^{2}}}\right)_{x}+J_{b}, & & \displaystyle \nonumber\\ \displaystyle & & \displaystyle\end{eqnarray}$$
with the flux boundary conditions at the interface becoming
 $$\begin{eqnarray}\frac{-C_{y}+h_{x}C_{x}}{\sqrt{1+h_{x}^{2}}}=Pe_{b}\unicode[STIX]{x1D6FD}_{b}J_{b}\quad \text{and}\quad -M_{y}+h_{x}M_{x}=0\quad \text{at}\quad y=h(x,t),\end{eqnarray}$$
and the non-dimensional flux
 $J_{b}$
given by
 $$\begin{eqnarray}J_{b}=Bi\left(K_{b}C(1-\unicode[STIX]{x1D6E4})-\unicode[STIX]{x1D6E4}\right).\end{eqnarray}$$
The dimensionless total mass of surfactant is
 $$\begin{eqnarray}{\mathcal{M}}=\frac{1}{\unicode[STIX]{x1D6FD}_{b}L}\int _{0}^{L}\int _{0}^{h}(C+M)\,\text{d}y\,\text{d}x+\frac{1}{L}\int _{0}^{L}\unicode[STIX]{x1D6E4}\,\text{d}x,\end{eqnarray}$$
where the domain length
 $L$
is also scaled in non-dimensional units (by writing
 $L=HL^{\ast }$
and then dropping the superscript star from
 $L^{\ast }$
).
The model derived in this section reduces to the insoluble surfactant problem by applying one of the limits:
(i)
 $Bi\rightarrow 0$
, found when there is no desorption from the interface to the bulk, i.e.
$k_{d}\rightarrow 0$
(Booty & Siegel Reference Booty and Siegel2010; Wang, Siegel & Booty Reference Wang, Siegel and Booty2014). This condition is equivalent to setting the flux
$J_{b}=0$
in (2.28) and (2.29);
(ii)
$\unicode[STIX]{x1D6FD}_{b}\gg 1$
, which is essentially equivalent to condition (i), see first equation in (2.29) (Jensen & Grotberg Reference Jensen and Grotberg1993; Oron, Davis & Bankoff Reference Oron, Davis and Bankoff1997; Edmonstone et al.
Reference Edmonstone, Craster and Matar2006; Craster et al.
Reference Craster, Matar and Papageorgiou2009);(iii)
$K_{b}\gg 1$
, corresponding to the molecules being attracted to the interface, i.e.
$k_{a}\gg k_{d}$
(Craster et al.
Reference Craster, Matar and Papageorgiou2009).


In place of conditions (ii) and (iii), we could instead satisfy
 $R_{b}\gg 1$
, where
 $R_{b}$
is a new parameter defined by
 $$\begin{eqnarray}R_{b}=\unicode[STIX]{x1D6FD}_{b}K_{b}=\frac{\unicode[STIX]{x1D6E4}_{\infty }}{HC_{CMC}}\cdot \frac{k_{a}}{k_{d}}\frac{C_{CMC}}{\unicode[STIX]{x1D6E4}_{\infty }}=\frac{k_{a}}{Hk_{d}}.\end{eqnarray}$$
As we will see in later sections, this combined parameter
 $R_{b}$
will often appear in the stability conditions of this problem. A similar observation has been made by Karapetsas & Bontozoglou (Reference Karapetsas and Bontozoglou2013) in a related liquid film flow with soluble surfactants.
3 Linear stability analysis
3.1 Equilibrium state
At equilibrium both fluid layers have uniform thicknesses, with the interface located at
 $y=h_{0}$
. The basic flow in each fluid layer
 $j=1,2$
is the standard two-fluid Couette–Poiseuille flow and is given by
 $$\begin{eqnarray}\displaystyle & \displaystyle \bar{u}_{1}(y)=qy^{2}+wy,\quad \bar{v}_{1}=0,\quad \bar{p}_{1}(x,y)=p_{0}-\frac{1}{Fr^{2}}(y-h_{0})-Kx, & \displaystyle\end{eqnarray}$$
 $$\begin{eqnarray}\displaystyle & \displaystyle \bar{u}_{2}(y)=\frac{q}{m}y^{2}+\frac{w}{m}y+b,\quad \bar{v}_{2}=0,\quad \bar{p}_{2}(x,y)=p_{0}-\frac{r}{Fr^{2}}(y-h_{0})-Kx, & \displaystyle\end{eqnarray}$$
where
 $p_{0}$
is the undisturbed constant pressure at the interface and the rest of the coefficients are given by
 $$\begin{eqnarray}\displaystyle & \displaystyle q=-\frac{1}{2}ReK=-\frac{GH^{2}}{2\unicode[STIX]{x1D707}_{1}U},\quad w=\frac{m-q(1+h_{0}^{2}(m-1))}{1+h_{0}(m-1)}, & \displaystyle\end{eqnarray}$$
 $$\begin{eqnarray}\displaystyle & \displaystyle b=\frac{(m-1)}{m}\left(\frac{mh_{0}-qh_{0}(1-h_{0})}{1+h_{0}(m-1)}\right). & \displaystyle\end{eqnarray}$$
Parameter
 $q$
represents the effect of the pressure gradient. We can define a new parameter for the dimensionless shear rate
 $s$
by
 $$\begin{eqnarray}s:=\bar{u}_{1}^{\prime }(h_{0})=2qh_{0}+w,\end{eqnarray}$$
which is equal to the slope of the basic velocity at the interface; we will see later that this shear parameter plays a crucial role in the stability of the problem.
The equilibrium state for the surfactant can be found by setting
 $J_{b}=0$
,
 $J_{m}=0$
in (2.30) and (2.22), resulting in
 $$\begin{eqnarray}\bar{C}=\frac{\bar{\unicode[STIX]{x1D6E4}}}{K_{b}(1-\bar{\unicode[STIX]{x1D6E4}})},\quad \bar{C}^{N}=\bar{M},\end{eqnarray}$$
where concentrations
 $\bar{\unicode[STIX]{x1D6E4}}$
,
 $\bar{C}$
,
 $\bar{M}$
are constants (note that
 $\bar{C}$
is bounded, hence
 $\bar{\unicode[STIX]{x1D6E4}}<1$
). The total surfactant mass is
 $$\begin{eqnarray}{\mathcal{M}}=\frac{h_{0}}{\unicode[STIX]{x1D6FD}_{b}}(\bar{C}+\bar{M})+\bar{\unicode[STIX]{x1D6E4}}.\end{eqnarray}$$
For any given mass
 ${\mathcal{M}}$
, we can find the equilibrium concentration
 $\bar{\unicode[STIX]{x1D6E4}}$
by substituting for
 $\bar{M}$
and then
 $\bar{C}$
from (3.3).
3.2 Linearised equations of motion
The interest of this work is to study the linear stability properties of the flow. To formulate the stability problem, we first consider small disturbances (denoted with a hat decoration) to the equilibrium state as follows
 $$\begin{eqnarray}\left(\begin{array}{@{}c@{}}h(x,t)\\ \boldsymbol{u}_{j}(x,y,t)\\ p_{j}(x,y,t)\\ \unicode[STIX]{x1D6E4}(x,t)\\ C(x,y,t)\\ M(x,y,t)\end{array}\right)=\left(\begin{array}{@{}c@{}}h_{0}\\ \bar{\boldsymbol{u}}_{j}(y)\\ \bar{p}_{j}(x,y)\\ \bar{\unicode[STIX]{x1D6E4}}\\ \bar{C}\\ \bar{M}\end{array}\right)+\left(\begin{array}{@{}c@{}}{\hat{h}}(x,t)\\ \hat{\boldsymbol{u}}_{j}(x,y,t)\\ \hat{p}_{j}(x,y,t)\\ \hat{\unicode[STIX]{x1D6E4}}(x,t)\\ {\hat{C}}(x,y,t)\\ \hat{M}(x,y,t)\end{array}\right).\end{eqnarray}$$
The incompressible condition (2.19a ) allows us to write the fluid velocities in terms of derivatives of scalar streamfunctions, i.e.
 $$\begin{eqnarray}\hat{\boldsymbol{u}}_{j}=(\hat{u} _{j},\hat{v}_{j})=\left(\frac{\unicode[STIX]{x2202}\hat{\unicode[STIX]{x1D6F9}}_{j}}{\unicode[STIX]{x2202}y},-\frac{\unicode[STIX]{x2202}\hat{\unicode[STIX]{x1D6F9}}_{j}}{\unicode[STIX]{x2202}x}\right),\quad j=1,2.\end{eqnarray}$$
The perturbation variables are then written in a normal-mode form
 $$\begin{eqnarray}\hspace{-48.36958pt}\left(\begin{array}{@{}c@{}}{\hat{h}}(x,t)\\ \hat{\unicode[STIX]{x1D6F9}}_{j}(x,y,t)\\ \hat{p}_{j}(x,y,t)\\ \hat{\unicode[STIX]{x1D6E4}}(x,t)\\ {\hat{C}}(x,y,t)\\ \hat{M}(x,y,t)\end{array}\right)=\left(\begin{array}{@{}c@{}}\tilde{h}\\ \tilde{\unicode[STIX]{x1D6F9}}_{j}(y)\\ \tilde{p}_{j}(y)\\ \tilde{\unicode[STIX]{x1D6E4}}\\ \tilde{C}(y)\\ \tilde{M}(y)\end{array}\right)\text{e}^{\text{i}k(x-ct)},\end{eqnarray}$$
where
 $k$
is the (real) wavenumber,
 $c$
is the wave speed (generally a complex value) and the tilde variables define the amplitude vector. The amplification or growth rate is therefore given by
 $\unicode[STIX]{x1D706}=k\text{Im}(c)$
and hence stability is determined by the sign of
 $\text{Im}(c)$
: a negative sign yields exponential decay of perturbations, while a positive sign means linear instability.
Linearisation of the kinematic equation (2.25) gives
 $$\begin{eqnarray}\tilde{h}=\frac{\tilde{\unicode[STIX]{x1D6F9}}_{1}(h_{0})}{c-\bar{u}_{1}(h_{0})}=\frac{\tilde{\unicode[STIX]{x1D6F9}}_{1}(h_{0})}{\tilde{c}},\end{eqnarray}$$
where
 $\tilde{c}=c-\bar{u}_{1}(h_{0})$
defines the velocity of the moving disturbance relative to the unperturbed interfacial velocity. Equation (3.6) will used in the remaining equations to eliminate
 $\tilde{h}$
in terms of
 $\tilde{\unicode[STIX]{x1D6F9}}_{1}(h_{0})$
. Substituting perturbations (3.5) in the Navier–Stokes equations (2.19b
)–(2.19c
) and boundary conditions (2.23a)–(2.23b), (after eliminating the pressure) results in the Orr–Sommerfeld boundary value problem for the streamfunction disturbance in each fluid, given by
 $$\begin{eqnarray}\displaystyle & & \displaystyle \left(\tilde{\unicode[STIX]{x1D6F9}}_{j}^{\prime \prime \prime \prime }(y)-2k^{2}\tilde{\unicode[STIX]{x1D6F9}}_{j}^{\prime \prime }(y)+k^{4}\tilde{\unicode[STIX]{x1D6F9}}_{j}(y)\right)\nonumber\\ \displaystyle & & \displaystyle \qquad =\text{i}kRe_{j}\left[(\bar{u}_{j}(y)-c)\left(\tilde{\unicode[STIX]{x1D6F9}}_{j}^{\prime \prime }(y)-k^{2}\tilde{\unicode[STIX]{x1D6F9}}_{j}(y)\right)-\bar{u}_{j}^{\prime \prime }(y)\tilde{\unicode[STIX]{x1D6F9}}_{j}(y)\right],\quad j=1,2,\end{eqnarray}$$
 $$\begin{eqnarray}\tilde{\unicode[STIX]{x1D6F9}}_{1}(0)=\tilde{\unicode[STIX]{x1D6F9}}_{1}^{\prime }(0)=0,\quad \tilde{\unicode[STIX]{x1D6F9}}_{2}(1)=\tilde{\unicode[STIX]{x1D6F9}}_{2}^{\prime }(1)=0,\end{eqnarray}$$
where primes denote differentiation with respect to
 $y$
. The linearised conditions for vertical and horizontal velocity continuity (2.24) at the interface
 $y=h_{0}$
are
 $$\begin{eqnarray}\tilde{\unicode[STIX]{x1D6F9}}_{1}(h_{0})=\tilde{\unicode[STIX]{x1D6F9}}_{2}(h_{0}),\quad \tilde{\unicode[STIX]{x1D6F9}}_{1}^{\prime }(h_{0})-\tilde{\unicode[STIX]{x1D6F9}}_{2}^{\prime }(h_{0})=\left(\frac{1}{m}-1\right)\frac{s}{\tilde{c}}\tilde{\unicode[STIX]{x1D6F9}}_{1}(h_{0}).\end{eqnarray}$$
Inserting disturbances (3.5) into (2.26) and using the leading-order momentum equations (2.19), yields the linearised normal stress jump at the interface
 $$\begin{eqnarray}\displaystyle & & \displaystyle \left(m\tilde{\unicode[STIX]{x1D6F9}}_{2}^{\prime \prime \prime }(h_{0})-\tilde{\unicode[STIX]{x1D6F9}}_{1}^{\prime \prime \prime }(h_{0})\right)+\text{i}krRe\left(\tilde{c}\,\tilde{\unicode[STIX]{x1D6F9}}_{2}^{\prime }(h_{0})+\bar{u}_{2}^{\prime }(h_{0})\tilde{\unicode[STIX]{x1D6F9}}_{2}(h_{0})\right)-3k^{2}\left(m\tilde{\unicode[STIX]{x1D6F9}}_{2}^{\prime }(h_{0})-\tilde{\unicode[STIX]{x1D6F9}}_{1}^{\prime }(h_{0})\right)\nonumber\\ \displaystyle & & \displaystyle \qquad -\,\text{i}kRe\left(\tilde{c}\,\tilde{\unicode[STIX]{x1D6F9}}_{1}^{\prime }(h_{0})+\bar{u}_{1}^{\prime }(h_{0})\tilde{\unicode[STIX]{x1D6F9}}_{1}(h_{0})\right)=-\frac{\text{i}k}{Ca}\frac{\tilde{\unicode[STIX]{x1D6F9}}_{1}(h_{0})}{\tilde{c}}(\bar{\unicode[STIX]{x1D6FE}}k^{2}+Bo),\end{eqnarray}$$
where
 $\bar{\unicode[STIX]{x1D6FE}}=1+\unicode[STIX]{x1D6FD}_{s}\ln (1-\bar{\unicode[STIX]{x1D6E4}})$
is the equilibrium surface-tension value, and the corresponding tangential stress jump
 $$\begin{eqnarray}\left(m\tilde{\unicode[STIX]{x1D6F9}}_{2}^{\prime \prime }(h_{0})-\tilde{\unicode[STIX]{x1D6F9}}_{1}^{\prime \prime }(h_{0})\right)+k^{2}\left(m\tilde{\unicode[STIX]{x1D6F9}}_{2}(h_{0})-\tilde{\unicode[STIX]{x1D6F9}}_{1}(h_{0})\right)=\text{i}k\frac{Ma}{(1-\bar{\unicode[STIX]{x1D6E4}})}\tilde{\unicode[STIX]{x1D6E4}}.\end{eqnarray}$$
Equation (3.7d
) is simplified through cancellation of the second and fourth terms (and by using velocity continuity (3.7c
)) when the fluids have equal densities, i.e. for
 $r=1$
. Note that with the exception of the right-hand side surfactant term in the tangential stress equation (3.7e
), the rest of the linear hydrodynamic system (3.7) up to here is identical to that obtained by Yih (Reference Yih1967) for the stability of multi-layer flow without surfactant.
What is left is to linearise the transport equations for the surfactant. This is achieved by first substituting perturbations (3.5) into equation (2.28), providing the following linear equation for the interfacial surfactant concentration disturbance
 $$\begin{eqnarray}\tilde{\unicode[STIX]{x1D6E4}}\left(-\text{i}k\tilde{c}+\frac{k^{2}}{Pe_{s}}+Bi(K_{b}\bar{C}+1)\right)-BiK_{b}(1-\bar{\unicode[STIX]{x1D6E4}})\tilde{C}(h_{0})=-\text{i}k\bar{\unicode[STIX]{x1D6E4}}\left(\frac{s}{\tilde{c}}\tilde{\unicode[STIX]{x1D6F9}}_{1}(h_{0})+\tilde{\unicode[STIX]{x1D6F9}}_{1}^{\prime }(h_{0})\right).\end{eqnarray}$$
Finally, the convection–diffusion equations (2.20)–(2.21) for the monomers and micelles in the bulk and the relevant boundary conditions (2.23c), (2.29) are linearised; the resulting system for the disturbance in the monomer concentration reads
 $$\begin{eqnarray}\displaystyle & \displaystyle \tilde{C}^{\prime \prime }(y)-k^{2}\tilde{C}(y)-\text{i}kPe_{b}(\bar{u}_{1}(y)-c)\tilde{C}(y)-Pe_{b}K_{m}\left(N\bar{C}^{N-1}\tilde{C}(y)-\tilde{M}(y)\right)=0, & \displaystyle\end{eqnarray}$$
 $$\begin{eqnarray}\displaystyle & \displaystyle \tilde{C}^{\prime }(0)=0,\quad \tilde{C}^{\prime }(h_{0})+Pe_{b}\unicode[STIX]{x1D6FD}_{b}BiK_{b}(1-\bar{\unicode[STIX]{x1D6E4}})\tilde{C}(h_{0})=Pe_{b}\unicode[STIX]{x1D6FD}_{b}Bi(K_{b}\bar{C}+1)\tilde{\unicode[STIX]{x1D6E4}}, & \displaystyle\end{eqnarray}$$
 $$\begin{eqnarray}\displaystyle & \displaystyle \tilde{M}^{\prime \prime }(y)-k^{2}\tilde{M}(y)-\text{i}kPe_{m}(\bar{u}_{1}(y)-c)\tilde{M}(y)+Pe_{m}K_{m}\left(N\bar{C}^{N-1}\tilde{C}(y)-\tilde{M}(y)\right)=0, & \displaystyle \nonumber\\ \displaystyle & & \displaystyle\end{eqnarray}$$
 $$\begin{eqnarray}\displaystyle & \displaystyle \tilde{M}^{\prime }(0)=0,\quad \tilde{M}^{\prime }(h_{0})=0. & \displaystyle\end{eqnarray}$$
At this point we should point out that the linear system (3.7)–(3.10) in effect only depends on parameter
 $R_{b}=\unicode[STIX]{x1D6FD}_{b}K_{b}$
and not on
 $\unicode[STIX]{x1D6FD}_{b}$
or
 $K_{b}$
individually; this can be seen by scaling
 $\tilde{C}\rightarrow \unicode[STIX]{x1D6FD}_{b}\tilde{C}$
(
 $\tilde{M}$
needs to be also scaled appropriately) and noting that the factor
 $(K_{b}\bar{C}+1)$
can be written in terms of
 $\bar{\unicode[STIX]{x1D6E4}}$
only (by applying the equilibrium equation (3.3)).
3.3 Expansions for long waves
Previous studies on multi-layer flows have shown that the interface is susceptible to long-wave instability, i.e. instability to disturbances with large wavelength. That motivates us to look for a similar instability in multi-layer flows with soluble surfactant, and hence we introduce the following expansions for long waves (i.e. small wavenumber
 $k$
),
 $$\begin{eqnarray}\displaystyle & \displaystyle c=c_{0}+kc_{1}+\cdots \,, & \displaystyle\end{eqnarray}$$
 $$\begin{eqnarray}\displaystyle & \displaystyle \tilde{\unicode[STIX]{x1D6F9}}_{j}(y)=\tilde{\unicode[STIX]{x1D6F9}}_{j,0}(y)+k\tilde{\unicode[STIX]{x1D6F9}}_{j,1}(y)+\cdots \,, & \displaystyle\end{eqnarray}$$
 $$\begin{eqnarray}\displaystyle & \displaystyle \tilde{\unicode[STIX]{x1D6E4}}=\tilde{\unicode[STIX]{x1D6E4}}_{0}+k\tilde{\unicode[STIX]{x1D6E4}}_{1}+\cdots \,, & \displaystyle\end{eqnarray}$$
 $$\begin{eqnarray}\displaystyle & \displaystyle \tilde{C}(y)=\tilde{C}_{0}(y)+k\tilde{C}_{1}(y)+\cdots \,, & \displaystyle\end{eqnarray}$$
 $$\begin{eqnarray}\displaystyle & \displaystyle \tilde{M}(y)=\tilde{M}_{0}(y)+k\tilde{M}_{1}(y)+\cdots \,. & \displaystyle\end{eqnarray}$$
 $k$
, and most importantly obtain wave speeds
 $c_{0}$
,
 $c_{1}$
which will provide information of the stability properties of the problem. The leading-order variables in the case of bulk concentrations beyond the CMC are found to be algebraically rather complicated, and therefore the remaining of this section will consider bulk concentrations below the CMC (with
 $\tilde{M}=0$
) for the simplicity of presentation.
3.3.1 Hydrodynamic system at
$O(1)$

The hydrodynamic system (3.7) at leading order in
 $k$
is unaware of the presence of surfactant and the solution is exactly the same as the one found by Yih (Reference Yih1967). The leading-order relative velocity of interfacial waves is
 $$\begin{eqnarray}\tilde{c}_{0}=c_{0}-\bar{u}_{1}(h_{0})=\frac{2(1-m)n^{2}s}{m^{2}+4mn+6mn^{2}+4mn^{3}+n^{4}},\end{eqnarray}$$
where the thickness ratio
 $n$
is connected to the undisturbed lower fluid thickness
 $h_{0}$
through
 $n=(1-h_{0})/h_{0}$
.
3.3.2 Surfactant system at
$\text{O}(1)$

The surfactant equations (3.8)–(3.9) at leading order in
 $k$
read
 $$\begin{eqnarray}\displaystyle & \displaystyle \tilde{\unicode[STIX]{x1D6E4}}_{0}(K_{b}\bar{C}+1)-K_{b}\tilde{C}_{0}(h_{0})(1-\bar{\unicode[STIX]{x1D6E4}})=0, & \displaystyle\end{eqnarray}$$
 $$\begin{eqnarray}\displaystyle & \displaystyle \tilde{C}_{0}^{\prime \prime }(y)=0, & \displaystyle\end{eqnarray}$$
 $$\begin{eqnarray}\displaystyle & \displaystyle \tilde{C}_{0}^{\prime }(0)=0,\quad \tilde{C}_{0}^{\prime }(h_{0})+Pe_{b}\unicode[STIX]{x1D6FD}_{b}BiK_{b}(1-\bar{\unicode[STIX]{x1D6E4}})\tilde{C}_{0}(h_{0})=Pe_{b}\unicode[STIX]{x1D6FD}_{b}Bi(K_{b}\bar{C}+1)\tilde{\unicode[STIX]{x1D6E4}}_{0}. & \displaystyle\end{eqnarray}$$
 $\tilde{C}_{0}^{\prime }(h_{0})=0$
and (3.13a
) can be then used to provide a condition for
 $\tilde{C}(h_{0})$
in terms of
 $\tilde{\unicode[STIX]{x1D6E4}}_{0}$
. Integrating equation (3.13b
) twice in
 $y$
gives
 $$\begin{eqnarray}\tilde{C}_{0}(y)=\frac{\tilde{\unicode[STIX]{x1D6E4}}_{0}}{K_{b}(1-\bar{\unicode[STIX]{x1D6E4}})^{2}},\end{eqnarray}$$
which shows that the leading-order perturbation of the bulk concentration is constant across the fluid. Interestingly, this solution for
 $\tilde{C}_{0}$
is identical to the leading-order bulk disturbance found in liquid film flow down an inclined plate (Karapetsas & Bontozoglou Reference Karapetsas and Bontozoglou2014). This is unsurprising considering that the leading-order surfactant system is unaware of the presence of the second fluid.
3.3.3 Surfactant system at
$O(k)$

The bulk disturbance equation and boundary conditions at the next order are
 $$\begin{eqnarray}\displaystyle & \displaystyle \tilde{C}_{1}^{\prime \prime }(y)-\text{i}Pe_{b}(\bar{u}_{1}(y)-c_{0})\tilde{C}_{0}=0, & \displaystyle\end{eqnarray}$$
 $$\begin{eqnarray}\displaystyle & \displaystyle \tilde{C}_{1}^{\prime }(0)=0,\quad \tilde{C}_{1}^{\prime }(h_{0})+Pe_{b}\unicode[STIX]{x1D6FD}_{b}BiK_{b}(1-\bar{\unicode[STIX]{x1D6E4}})\tilde{C}_{1}(h_{0})=Pe_{b}\unicode[STIX]{x1D6FD}_{b}Bi(K_{b}\bar{C}+1)\tilde{\unicode[STIX]{x1D6E4}}_{1}. & \displaystyle\end{eqnarray}$$
 $$\begin{eqnarray}\displaystyle \tilde{C}_{1}(y) & = & \displaystyle \text{i}\tilde{C}_{0}\left[Pe_{b}\left(\frac{q}{12}(y^{4}-h_{0}^{4})+\frac{w}{6}(y^{3}-h_{0}^{3})-\frac{c_{0}}{2}(y^{2}-h_{0}^{2})\right)\right.\nonumber\\ \displaystyle & & \displaystyle \left.+\,\frac{1}{\unicode[STIX]{x1D6FD}_{b}BiK_{b}(1-\bar{\unicode[STIX]{x1D6E4}})}\left(-\frac{q}{3}h_{0}^{3}-\frac{w}{2}h_{0}^{2}+c_{0}h_{0}\right)-\text{i}\frac{\tilde{\unicode[STIX]{x1D6E4}}_{1}}{\tilde{\unicode[STIX]{x1D6E4}}_{0}}\right],\end{eqnarray}$$
where the terms
 $\tilde{\unicode[STIX]{x1D6E4}}_{0}$
,
 $\tilde{\unicode[STIX]{x1D6E4}}_{1}$
still need to be found. To obtain
 $\tilde{\unicode[STIX]{x1D6E4}}_{0}$
we need to consider the interfacial surfactant equation at
 $O(k)$
, and after some algebraic manipulations this is found to be (given for
 $q=0$
)
 $$\begin{eqnarray}\tilde{\unicode[STIX]{x1D6E4}}_{0}=\tilde{\unicode[STIX]{x1D6E4}}_{0}^{ins}{\mathcal{S}},\end{eqnarray}$$
with
 $$\begin{eqnarray}\displaystyle & \displaystyle \tilde{\unicode[STIX]{x1D6E4}}_{0}^{ins}=\frac{m(m^{2}+4mn+6mn^{2}+4mn^{3}+n^{4})(m+3mn+3n^{2}+n^{3})\bar{\unicode[STIX]{x1D6E4}}}{2s(m-1)^{2}n^{2}(n^{2}+2mn+m)}, & \displaystyle\end{eqnarray}$$
 $$\begin{eqnarray}\displaystyle & \displaystyle {\mathcal{S}}=\left(1-{\displaystyle \frac{(n^{2}+m+2n)^{2}}{4(m-1)n^{2}(n+1)^{2}(1-\bar{\unicode[STIX]{x1D6E4}})^{2}R_{b}}}\right)^{-1}, & \displaystyle\end{eqnarray}$$
where we have assumed that
 $m\neq 1$
. The first factor
 $\tilde{\unicode[STIX]{x1D6E4}}_{0}^{ins}$
in (3.17a
) is identical to the leading-order perturbation in the corresponding insoluble problem, and the second factor
 ${\mathcal{S}}$
tends to 1 in the insoluble limit
 $R_{b}\gg 1$
, as expected. The solution for
 $\tilde{\unicode[STIX]{x1D6E4}}_{1}$
is found by solving the interfacial surfactant equation at
 $\text{O}(k^{2})$
but it is too lengthy to be given here. Having obtained
 $\tilde{\unicode[STIX]{x1D6E4}}_{0}$
and
 $\tilde{\unicode[STIX]{x1D6E4}}_{1}$
, the leading-order and first-order perturbations for the bulk concentration
 $\tilde{C}_{0}(y)$
in (3.14) and
 $\tilde{C}_{1}(y)$
in (3.16) are then fully determined.
3.3.4 Hydrodynamic system at
$\text{O}(k)$

Analytic calculations for the hydrodynamic system at
 $\text{O}(k)$
are algebraically very cumbersome so the symbolic software Maple is employed in order to find the first-order perturbation of the wave speed
 $c_{1}$
; for
 $Re=0$
,
 $Bo=0$
,
 $q=0$
the solution is
 $$\begin{eqnarray}c_{1}=\text{i}c^{ins}{\mathcal{S}},\end{eqnarray}$$
with
 $$\begin{eqnarray}c^{ins}=-\frac{(m+3mn+3n^{2}+n^{3})(m-n^{2})Ma\bar{\unicode[STIX]{x1D6E4}}}{4(n+1)(m^{2}+4mn+6mn^{2}+4mn^{3}+n^{4})(m-1)(1-\bar{\unicode[STIX]{x1D6E4}})},\end{eqnarray}$$
the corresponding insoluble component. The solution for
 $c_{1}$
is purely imaginary and hence provides the leading-order expression for the growth rate
 $\unicode[STIX]{x1D706}=k\text{Im}(c)$
, given by
 $k^{2}\text{Im}(c_{1})=c^{ins}{\mathcal{S}}k^{2}$
. Since the soluble component
 ${\mathcal{S}}$
tends to 1 in the limit
 $R_{b}\gg 1$
, the growth rate reduces to the insoluble rate. As mentioned before, the expression (3.18a
) for the growth rate only depends on parameter
 $R_{b}=\unicode[STIX]{x1D6FD}_{b}K_{b}$
through
 ${\mathcal{S}}$
given in (3.17c
) and not on parameters
 $\unicode[STIX]{x1D6FD}_{b}$
or
 $K_{b}$
individually.
It is important to note that expressions (3.17) and (3.18) are only valid for
 $m\neq 1$
and
 $R_{b}\neq R_{b}^{\ast }$
, where
 $$\begin{eqnarray}R_{b}^{\ast }=\frac{(n^{2}+m+2n)^{2}}{4(m-1)n^{2}(n+1)^{2}(1-\bar{\unicode[STIX]{x1D6E4}})^{2}},\end{eqnarray}$$
(provided that
 $m>1$
). At
 $m=1$
it was shown by Frenkel & Halpern (Reference Frenkel and Halpern2002) and Halpern & Frenkel (Reference Halpern and Frenkel2003) for the corresponding insoluble problem that the long-wave expansion for the wave speed is not regular, but the first-order term in the expansion is of
 $\text{O}(k^{1/2})$
instead of
 $\text{O}(k)$
. This happens because in this particular limit, the linear term in the quadratic equation that determines the wave speed
 $c$
does not contribute to the leading-order solution in
 $k$
. We have proved that a similar result holds when
 $R_{b}=R_{b}^{\ast }$
, in which case the first-order perturbation of the wave speed is given by
 $$\begin{eqnarray}\pm \frac{1}{2}(1+\text{i})\sqrt{\frac{s(m+3mn+3n^{2}+n^{3})(m-n^{2})(n^{2}+m+2n)^{2}n^{2}Ma\bar{\unicode[STIX]{x1D6E4}}}{(m^{2}+4mn+6mn^{2}+4mn^{3}+n^{4})^{3}(n+1)(1-\bar{\unicode[STIX]{x1D6E4}})}}\;k^{1/2}.\end{eqnarray}$$
3.3.5 Second (Marangoni) mode
The mode found above is a ‘hydrodynamic mode’, in the sense that it exists independently of the presence of surfactant; this mode is known to be stable in the Stokes flow limit and in the absence of surfactant (Yih Reference Yih1967) but it is generally unstable for non-zero Reynolds number. Several authors in the past have reported a second ‘Marangoni mode’, associated with the surfactant concentration at the interface and coming from the interfacial transport equation (e.g. Frenkel & Halpern Reference Frenkel and Halpern2002; Pereira & Kalliadasis Reference Pereira and Kalliadasis2008; Karapetsas & Bontozoglou Reference Karapetsas and Bontozoglou2014). We can find the corresponding Marangoni mode for this problem by expanding the wave speed as in (3.11a
) and introducing expansions for the streamfunctions
 $\tilde{\unicode[STIX]{x1D6F9}}_{j}$
with a leading term of order
 $\unicode[STIX]{x1D6FC}^{-1}$
(we note that the expansion is the same as in the insoluble problem, see Frenkel & Halpern (Reference Frenkel and Halpern2002)), while the surfactant concentrations
 $\tilde{\unicode[STIX]{x1D6E4}}$
and
 $\tilde{C}$
are expanded with a leading term of order
 $\unicode[STIX]{x1D6FC}^{-2}$
. We obtain the following solution for the wave speed at leading order
 $$\begin{eqnarray}c_{0}=\frac{(3R_{b}(1-\bar{\unicode[STIX]{x1D6E4}})^{2}(n+1)+2)(ns-q+s)-\frac{1}{2}s(n+1)}{3(R_{b}(1-\bar{\unicode[STIX]{x1D6E4}})^{2}(n+1)+1)(n+1)^{2}},\end{eqnarray}$$
whereas the expression of the
 $\text{O}(k)$
term
 $c_{1}$
is rather unwieldy and will be omitted. Clearly, the leading-order wave speed
 $c_{0}$
is real and therefore the growth rate
 $\unicode[STIX]{x1D706}=k\text{Im}(c)$
passes through
 $k=0$
. In the insoluble limit
 $R_{b}\gg 1$
, the above expression
 $c_{0}\rightarrow -qh_{0}^{2}+sh_{0}=qh_{0}^{2}+wh_{0}$
(upon setting
 $n=(1-h_{0})/h_{0}$
and using (3.2)) which is equal to the undisturbed interfacial velocity
 $\bar{u}_{1}(h_{0})$
.
Long-wave predictions for the two dominant modes and for varying viscosity ratio
 $m$
. The parameter values used are
 $n=1.5$
(
 $h_{0}=0.4$
),
 $\bar{\unicode[STIX]{x1D6E4}}=0.5$
,
 $Bi=1$
,
 $K_{b}=10$
,
 $\unicode[STIX]{x1D6FD}_{b}=1$
(i.e.
 $R_{b}=\unicode[STIX]{x1D6FD}_{b}K_{b}=10$
),
 $Re=0$
,
 $Bo=0$
,
 $Ca=0.1$
,
 $Ma=0.1$
,
 $Pe_{s}=1\times 10^{8}$
,
 $Pe_{b}=100$
. Thick solid lines demonstrate the soluble modes and thin dash-dotted lines the corresponding insoluble modes. The vertical asymptotes at
 $m^{\ast }=1.3056$
and
 $m=1$
indicate the values of
 $m$
at which the growth rates change asymptotic behaviour.

The second mode has a similar form as (3.18); it also includes the solubility factor
 ${\mathcal{S}}$
(defined in (3.17c
)) and exhibits a different asymptotic behaviour at critical point
 $R_{b}^{\ast }$
, similar to the first mode presented in § 3.3. Here we discuss the behaviour of these two modes as the viscosity ratio
 $m$
varies. In figure 4, the two long-wave modes are shown with solid lines and the corresponding insoluble modes are shown with dash-dotted lines – note that the vertical asymptotes do not signify a breakup of the long-wave theory but rather a change in the asymptotic expansion as discussed above. Both modes are seen to change stability as the boundary
 $m=m^{\ast }>1$
is crossed, but the overall system always remains unstable in the vicinity of
 $m^{\ast }$
(similar to the behaviour of the corresponding insoluble system at
 $m=1$
). The critical point
 $m^{\ast }$
exists as long as
 $R_{b}>1/(1-\bar{\unicode[STIX]{x1D6E4}})^{2}n^{2}$
and tends to 1 in the insoluble limit
 $R_{b}\gg 1$
.
3.3.6 Other normal modes
The analogous insoluble problem admits only two normal modes under conditions of Stokes flow. Both of these modes vanish when the disturbance has infinite wavelength, that is when
 $k=0$
. When the surfactant is soluble there is an infinite number of modes that originate from the bulk transport equation (3.9) – see appendix A for a method of obtaining these modes in the case of Stokes flow. Two modes exactly pass through the origin
 $k=0$
but all the other modes reach a constant (negative) value at
 $k=0$
; further analysis of these remaining modes is provided in appendix B.
4 Numerical solutions for arbitrary wavenumbers
4.1 Numerical method
A general solution of the linear eigenvalue problem (3.7)–(3.10) for perturbations of arbitrary wavelengths can only be obtained numerically. Here we use the Chebyshev collocation method which requires to first map each fluid region to the canonical interval
 $[-1,1]$
. This is achieved by performing a
 $y$
-coordinate transformation to new coordinates
 $y_{1},~y_{2}\in [-1,1]$
defined by
 $$\begin{eqnarray}y_{1}=1-\frac{2y}{h_{0}},\quad \text{for}\quad 0\leqslant y\leqslant h_{0},\quad \text{and}\quad y_{2}=\frac{2y-1-h_{0}}{1-h_{0}},\quad \text{for}\quad h_{0}\leqslant y\leqslant 1,\end{eqnarray}$$
with the interface located at
 $y_{1}=y_{2}=-1$
. The streamfunctions
 $\tilde{\unicode[STIX]{x1D6F9}}_{1}$
,
 $\tilde{\unicode[STIX]{x1D6F9}}_{2}$
and surfactant concentrations
 $\tilde{C}$
,
 $\tilde{M}$
are then written in terms of Chebyshev expansions (Orzag Reference Orzag1971; Boomkamp et al.
Reference Boomkamp, Boersma, Miesen and Beijnon1997)
 $$\begin{eqnarray}\tilde{\unicode[STIX]{x1D6F9}}_{j}(y_{j})=\mathop{\sum }_{\ell =0}^{N_{j}}\tilde{\unicode[STIX]{x1D713}}_{j\ell }T_{\ell }(y_{j}),\quad \tilde{C}(y_{1})=\mathop{\sum }_{\ell =0}^{N_{1}}\tilde{c}_{\ell }T_{\ell }(y_{1}),\quad \tilde{M}(y_{1})=\mathop{\sum }_{\ell =0}^{N_{1}}\tilde{m}_{\ell }T_{\ell }(y_{1}),\end{eqnarray}$$
where
 $T_{\ell }(y_{j})$
is the
 $\ell \text{th}$
Chebyshev polynomial of the first kind and
 $N_{1}$
,
 $N_{2}$
are appropriately chosen truncation levels for each fluid layer
 $j=1,2$
. The total number of unknowns considered is
 $3N_{1}+N_{2}+5$
, comprising
 $N_{1}+1$
expansion coefficients
 $\tilde{\unicode[STIX]{x1D713}}_{1\ell }$
,
 $N_{2}+1$
coefficients
 $\tilde{\unicode[STIX]{x1D713}}_{2\ell }$
,
 $N_{1}+1$
coefficients
 $\tilde{c}_{\ell }$
,
 $N_{1}+1$
coefficients
 $\tilde{m}_{\ell }$
and
 $\tilde{\unicode[STIX]{x1D6E4}}$
. The linearised set of equations (3.7)–(3.10) is assembled into a system
 $(\boldsymbol{{\mathcal{A}}}\boldsymbol{\cdot }\boldsymbol{x})=c(\boldsymbol{{\mathcal{B}}}\boldsymbol{\cdot }\boldsymbol{x})$
, where
 $\boldsymbol{{\mathcal{A}}}$
,
 $\boldsymbol{{\mathcal{B}}}$
are square matrices of size
 $3N_{1}+N_{2}+5$
. The linear system then becomes a finite-dimensional generalised eigenvalue problem for the complex eigenvalue
 $c=c_{r}+\text{i}c_{i}$
and the associated eigenvector. The solution of this system provides the growth rate
 $\unicode[STIX]{x1D706}=kc_{i}$
for any wavenumber
 $k$
.
In practice, the two Orr–Sommerfeld equations are solved with
 $N_{1}-3$
and
 $N_{2}-3$
interior collocation points, respectively, while the bulk and micelle concentration equations are solved at
 $N_{1}-1$
interior points each. The remaining 13 equations come from the boundary conditions (3.7b
)–(3.7e
), (3.8), (3.9b
), (3.10b
). Note that some of the boundary conditions do not contain the eigenvalue
 $c$
and so a number of rows in
 $\boldsymbol{{\mathcal{B}}}$
are zero, making the matrix singular. The singularity in
 $\boldsymbol{{\mathcal{B}}}$
in general leads to the emergence of spurious eigenvalues (Dongarra, Straughan & Walker Reference Dongarra, Straughan and Walker1996), which were carefully eliminated in order to obtain accurate numerical results. This was achieved in one of the following ways: (i) by removing the null rows and columns and obtaining a reduced system; or (ii) by using the built-in generalised eigenvalue solver eig in MATLAB, which implements a QZ algorithm. Computations with both of these methods have been carried out with eigenvalues being in excellent agreement in both cases.
The system at hand has an infinite number of eigenvalues and associated eigenfunctions for non-zero values of the Reynolds number. In the Stokes flow approximation,
 $Re=0$
, the corresponding problem with insoluble surfactant has precisely two eigenvalues. As already mentioned, the problem with soluble surfactant considered here has infinitely many eigenvalues even for Stokes flow; the two dominant modes are identified and demonstrated in the numerical results that follow in this section.
To validate the code and check its numerical accuracy, a number of test cases were simulated and numerical solutions were compared to available results from the literature. As a first test case, growth rates were obtained for multi-layer Couette or Poiseuille flow with an interface that is devoid of surfactants, and comparisons with results presented in Renardy (Reference Renardy1985) and Yiantsios & Higgins (Reference Yiantsios and Higgins1988) showed excellent agreement. A further check was performed by computing growth rates for single-layer or multi-layer flow with insoluble surfactant at the interface and recovering those obtained by Halpern & Frenkel (Reference Halpern and Frenkel2003), Blyth & Pozrikidis (Reference Blyth and Pozrikidis2004a
) and Pereira & Kalliadasis (Reference Pereira and Kalliadasis2008). We have also solved a modified code for liquid film flow in the presence of soluble surfactant and growth rates were confirmed to be identical to those found by Karapetsas & Bontozoglou (Reference Karapetsas and Bontozoglou2013). Furthermore, in the case of multi-layer flow with soluble surfactant it was verified that the code reproduces the results of an independently written code for the corresponding insoluble problem when
 $Bi=0$
, or
 $Bi\ll 1$
and
 $R_{b}\gg 1$
.
As a final validation case we compared the numerically computed growth rates to the long-wave asymptotic solutions presented in § 3.3. Figure 5 demonstrates an example, where the two dominant modes calculated using the Chebyshev method are shown with solid black lines and the long-wave predictions are portrayed with red circles. Clearly the numerical and asymptotic growth rate curves become indistinguishable as they approach the origin. We verified that this is indeed the case for all other results presented next.
Comparison of the two dominant growth rates with the long-wave analysis, for
 $m=0.5$
,
 $n=10$
(equivalently,
 $h_{0}=1/11$
),
 $\bar{\unicode[STIX]{x1D6E4}}=0.5$
,
 $Bi=1$
,
 $K_{b}=1$
,
 $\unicode[STIX]{x1D6FD}_{b}=1$
(i.e.
 $R_{b}=\unicode[STIX]{x1D6FD}_{b}K_{b}=1$
). The solid black lines are the numerical results obtained using Chebyshev collocation method and the circles are the asymptotic results found analytically for long waves. Parameter values for
 $Re$
,
 $Bo$
,
 $Ca$
,
 $Ma$
,
 $Pe_{s}$
,
 $Pe_{b}$
are the same as in figure 4.

4.2 Numerical results
The primary aim of this section is to identify the effect of surfactant solubility and sorption kinetics on the stability of the interface, in order to distinguish the stability properties of multi-layer flow with soluble surfactant from those of the equivalent flow where the surfactant is treated as insoluble. The degree of surfactant solubility is represented in the mathematical model by parameter
 $R_{b}$
, with
 $R_{b}\ll 1$
being highly soluble in the bulk and
 $R_{b}\gg 1$
nearly insoluble (we have confirmed that
 $\unicode[STIX]{x1D6FD}_{b}$
or
 $K_{b}$
do not affect the numerical results individually but only through the parameter
 $R_{b}=\unicode[STIX]{x1D6FD}_{b}K_{b}$
, as expected). A measure of sorption kinetics is provided by the Biot number
 $Bi$
, with
 $Bi\ll 1$
corresponding to surfactant leaving the interface very slowly and
 $Bi\gg 1$
indicating a fast desorption rate towards the bulk fluid. We will investigate the influence of the two parameters
 $Bi$
,
 $R_{b}$
on the stability properties of the system and explore how these properties are affected when the bulk concentration becomes larger than the CMC.
Considering the large number of dimensionless parameters involved in the problem at hand (table 1), it is practical to fix some of these parameters in the numerical simulations. All the results presented in this section will be for Stokes flow,
 $Re=0$
, and unless otherwise specified the following parameters will be kept fixed:
 $r=1$
,
 $Bo=0$
,
 $Ca=0.1$
,
 $Ma=0.1$
,
 $Pe_{s}=1\times 10^{8}$
,
 $Pe_{b}=100$
,
 $Pe_{m}=100$
,
 $K_{m}=1$
(note that the last two parameters are relevant only in the presence of micelles).
4.2.1 Bulk concentrations below the CMC
Frenkel & Halpern (Reference Frenkel and Halpern2002) showed that the interface between two viscous fluids under Stokes flow conditions exhibits long-wave instability in the presence of insoluble surfactant, but only if an underlying shear is imposed. We investigated if the related problem with soluble surfactant follows the same behaviour and indeed we found that the problem is stable to small disturbances of any wavelength if the basic flow shear is removed. This result was shown using both numerical calculations of the linearised system and long-wave analysis with shear rate
 $s=0$
(results not shown for brevity). It is therefore imperative that an underlying shear flow is present for this problem to exhibit any kind of instability to interfacial disturbances. The rest of the results presented in this section will accordingly employ a non-zero shear,
 $s\neq 0$
, given by (3.2).
We start the numerical investigation by considering a parameter set that supports instability when the surfactant is mostly attracted to the interface (i.e. insoluble or nearly insoluble) and slowly strengthen the effect of surfactant solubility or sorption kinetics by varying parameters
 $R_{b}$
or
 $Bi$
. Figures 6 and 7(a) use
 $m=0.5$
,
 $n=10$
(
 $h_{0}=1/11$
) and
 $\bar{\unicode[STIX]{x1D6E4}}=0.5$
, which corresponds to an unstable interface in the case of insoluble surfactant (since
 $m<n^{2}$
, see Frenkel & Halpern (Reference Frenkel and Halpern2002)). In figure 6, the effect of solubility parameter
 $R_{b}$
on the stability of the interface is displayed. For small and fixed
 $Bi=0.01$
(figure 6
a), the dominant growth rate is close to the one for the insoluble problem when
 $R_{b}=100$
(shown with a thick solid line); decreasing
 $R_{b}=10,1,0.2,0.1$
reduces the cutoff wavenumber and eventually stabilises the problem. The growth rates are seen to pass through the origin and to have a non-monotonic behaviour even after they are stabilised, with instability established for sufficiently long waves only. For larger
 $Bi=1$
, the stabilisation occurs at a higher value of
 $R_{b}$
and is monotonic as
 $R_{b}$
decreases (figure 6
b shows the two most significant modes for each value of
 $R_{b}=10,2,1,0.5$
). When
 $R_{b}$
becomes smaller than the value
 $R_{b}=0.25$
(not shown in the figure), the two curves cross each other and the second mode becomes dominant (but both modes remain stable). Fixing
 $R_{b}=5$
and increasing
 $Bi=0.001,0.0025,0.005,0.01$
reduces the range of unstable wavenumbers (but only by a small amount) as shown in figure 7(a), whereas larger values of the Biot number leave the growth rate curves unaffected. In the large Biot number limit the transport is controlled by diffusion and the interface–bulk exchange kinetics are in equilibrium (Booty & Siegel Reference Booty and Siegel2010).
Growth rate curves for decreasing values of
 $R_{b}$
and all other parameters fixed, specifically
 $m=0.5$
,
 $n=10$
(i.e.
 $h_{0}=1/11$
) and
 $\bar{\unicode[STIX]{x1D6E4}}=0.5$
, with the corresponding insoluble surfactant problem being unstable. Panel (a) shows the dominant growth rate for fixed
 $Bi=0.01$
and
 $R_{b}=100,10,1,0.2,0.1$
. Panel (b) uses fixed
 $Bi=1$
and depicts the two most significant modes for each value of
 $R_{b}=10,2,1,0.5$
. Parameter values for
 $Re$
,
 $Bo$
,
 $Ca$
,
 $Ma$
,
 $Pe_{s}$
,
 $Pe_{b}$
remain the same as in figure 4.

Dominant growth rates for different values of (a) the Biot number,
 $Bi$
, and (b) the equilibrium surfactant concentration at the interface,
 $\bar{\unicode[STIX]{x1D6E4}}$
. The rest of the parameters take the values
 $m=0.5$
,
 $n=10$
(i.e.
 $h_{0}=1/11$
) corresponding to an unstable insoluble problem. In panel (a),
 $R_{b}=5$
and
 $\bar{\unicode[STIX]{x1D6E4}}=0.5$
are fixed, while in panel (b)
 $R_{b}=1$
and
 $Bi=1$
are fixed. Parameter values for
 $Re$
,
 $Bo$
,
 $Ca$
,
 $Ma$
,
 $Pe_{s}$
,
 $Pe_{b}$
remain the same as in figure 4.

A particularly interesting result is seen when varying the equilibrium surfactant concentration at the interface,
 $\bar{\unicode[STIX]{x1D6E4}}$
. In the insoluble problem, increasing the basic concentration
 $\bar{\unicode[STIX]{x1D6E4}}$
would make the problem more unstable by increasing the cutoff wavenumber. Here this is not the case, as illustrated in figure 7(b) for fixed
 $R_{b}=1$
,
 $Bi=1$
and
 $\bar{\unicode[STIX]{x1D6E4}}=0.1,0.3,0.5,0.7,0.9$
(again,
 $m=0.5$
,
 $n=10$
); clearly the growth rates follow a non-monotonic behaviour as
 $\bar{\unicode[STIX]{x1D6E4}}$
is varied, with instability supported only for
 $\bar{\unicode[STIX]{x1D6E4}}<0.723$
. An increase in the basic concentration
 $\bar{\unicode[STIX]{x1D6E4}}$
enhances the range of instability as long as the concentration is small and between
 $0<\bar{\unicode[STIX]{x1D6E4}}<0.42$
. Further increase in
 $\bar{\unicode[STIX]{x1D6E4}}$
beyond the value 0.42 is seen to diminish the interval of unstable wavenumbers and leads to complete stabilisation at
 $\bar{\unicode[STIX]{x1D6E4}}=0.723$
. A similar behaviour has been reported in the study of falling film flow in the presence soluble surfactant, see Karapetsas & Bontozoglou (Reference Karapetsas and Bontozoglou2013).
The next set of results demonstrate that surfactant solubility can destabilise a system which is stable for insoluble surfactant. The flow with insoluble surfactant is known to be stable when
 $m\geqslant n^{2}$
(Frenkel & Halpern Reference Frenkel and Halpern2002); computations are hence performed for
 $m=3$
and
 $n=1.5$
(i.e.
 $h_{0}=0.4$
), so as to satisfy this condition. Parameter
 $\bar{\unicode[STIX]{x1D6E4}}$
is fixed to the value
 $0.5$
while
 $\bar{C}$
is found by (3.3). Figure 8 illustrates the growth rates for fixed
 $R_{b}=1$
and increasing
 $Bi=0.001,0.01,0.025,0.1,1$
. The thick solid line for
 $Bi=0.001$
is nearly identical to the insoluble growth rate and is stable, but as the Biot number increases the growth rates become unstable. For larger values of the Biot number the growth rate curves are found to be nearly indistinguishable from the curve for
 $Bi=1$
. Results for varied
 $R_{b}$
are considered next and we fix
 $Bi=1$
. Figure 9(a) depicts the dominant growth rate for
 $R_{b}=100,10,3,2,1$
. Lowering
 $R_{b}$
from a large value
 $R_{b}=100$
decreases the stable dominant mode and at the same time increases the second most dangerous mode which is also stable (not shown in the figure). This behaviour persists until around
 $R_{b}^{c}=2.4426$
, at which point the two growth rates become almost identical in a small region near the origin but both are stable (although the dominant growth rate curve has an inflection point). The dominant mode eventually crosses the
 $k$
-axis and becomes unstable at the critical value
 $R_{b}^{s}=2.4312$
. These results are in line with the predictions of the long-wave theory, as can be seen in figure 9(b): there are two negative modes for
 $R_{b}>R_{b}^{s}$
, which are seen to cross each other at
 $R_{b}^{c}=2.4426$
and the second mode is positive between
 $R_{b}^{\ast }<R_{b}<R_{b}^{s}$
, where
 $R_{b}^{\ast }=2.42$
(as given by (3.19)) is shown with a vertical asymptote in the figure. At the value
 $R_{b}^{\ast }=2.42$
the long-wave expansion has a different form, according to the discussion in § 3.3.4. The system is unstable for all
 $0<R_{b}<R_{b}^{\ast }$
, but as
 $R_{b}\rightarrow 0$
the positive growth rate tends to 0 from above, i.e. it becomes almost neutral.
Dependence of the dominant growth rates on the Biot number for
 $m=3$
,
 $n=1.5$
(i.e.
 $h_{0}=0.4$
),
 $\bar{\unicode[STIX]{x1D6E4}}=0.5$
and
 $R_{b}=1$
(the corresponding insoluble problem is stable since
 $m\geqslant n^{2}$
). The thick solid line for
 $Bi=0.001$
is almost identical to the insoluble growth rate. Parameter values for
 $Re$
,
 $Bo$
,
 $Ca$
,
 $Ma$
,
 $Pe_{s}$
,
 $Pe_{b}$
remain the same as in figure 4.

(a) Numerically computed growth rate curves and (b) analytical long-wave predictions for varying
 $R_{b}$
. The parameter values used are
 $m=3$
,
 $n=1.5$
(
 $h_{0}=0.4$
),
 $\bar{\unicode[STIX]{x1D6E4}}=0.5$
and
 $Bi=1$
(the corresponding insoluble problem is stable since
 $m\geqslant n^{2}$
). The blue solid lines in panel (b) refer to the leading-order analytical solution (3.18) while the orange dotted lines correspond to the second mode mentioned in § 3.3.6. The vertical asymptote at
 $R_{b}^{\ast }=2.42$
signifies the value of
 $R_{b}$
at which the growth rates change asymptotic behaviour according to (3.20). Parameter values for
 $Re$
,
 $Bo$
,
 $Ca$
,
 $Ma$
,
 $Pe_{s}$
,
 $Pe_{b}$
remain the same as in figure 4.

Growth rate curves demonstrating mid-wave instability for different values of
 $Bi$
and
 $R_{b}$
, with the rest parameters taking the values
 $m=17$
,
 $n=4$
(
 $h_{0}=0.2$
),
 $\bar{\unicode[STIX]{x1D6E4}}=0.1$
,
 $Ca=1$
,
 $Ma=8$
. In panel (a)
 $R_{b}=0.1$
is fixed and in panels (b,c) the Biot number is fixed to
 $Bi=0.1$
and
 $Bi=1$
, respectively. Parameter values for
 $Re$
,
 $Bo$
,
 $Pe_{s}$
,
 $Pe_{b}$
remain the same as in figure 4.

All the results presented so far considered some parametric sets which support instability for sufficiently long waves. However it has been found by Halpern & Frenkel (Reference Halpern and Frenkel2003) that when the surfactant is insoluble, it is possible for instability to exist in a finite interval of wavenumbers bounded below away from the origin (the so-called mid-wave instability), while long and short waves are stable. We find a similar result here for soluble surfactant (note that the mid-wave instability has also been reported for related systems in Picardo et al. (Reference Picardo, Radhakrishna and Pushpavanam2016) and Frenkel et al. (Reference Frenkel, Halpern and Schweiger2019b
)). In figure 10 we take
 $m=17$
,
 $n=4$
(i.e.
 $h_{0}=0.2$
) and
 $\bar{\unicode[STIX]{x1D6E4}}=0.5$
; for these parameter values, the insoluble problem is long wave stable since
 $m\geqslant n^{2}$
but exhibits mid-wave instability. The numerically computed growth rates for fixed
 $R_{b}=0.1$
and increasing
 $Bi=0.001,0.01,0.1,1,10$
are shown in figure 10(a). The range of unstable wavenumbers reduces as the Biot number increases but only until
 $Bi=0.526$
, above which the instability interval vanishes and the system is stabilised. Keeping the Biot number fixed to
 $Bi=0.1$
while lowering
 $R_{b}=100,10,1,0.1,0.01$
reduces the length of the unstable wavenumber interval, until around
 $R_{b}=0.081$
when long-wave instability also arises – see figure 10(b) and the inset therein. A similar study but now for larger
 $Bi=1$
with decreasing
 $R_{b}=100,1,0.5,0.1,0.05$
depicts that the range of wavenumbers which support instability is reduced until the critical value
 $R_{b}=0.126$
, below which the interface becomes completely stable (figure 10
c). The problem remains stable as far as
 $R_{b}=0.081$
, at which value instability for long waves emerges (note that this critical value is the same for both values of
 $Bi$
shown here as the mode that becomes unstable is independent of the Biot number (cf. § 3.3.4)).
4.2.2 Bulk concentrations above the CMC
If the surfactant concentration in the bulk exceeds the CMC, micelles are formed in the lower fluid. In the case where the interface is not subject to any shear, the system is found to be stable to perturbations of any wavelength. For non-zero shear rate,
 $s\neq 0$
, we conducted numerical experiments aiming to determine the effect of micelle formation on the stability of the flow. This is achieved by changing the amount of available surfactant mass at the equilibrium state,
 ${\mathcal{M}}$
, starting with bulk concentrations below the CMC (for small
 ${\mathcal{M}}$
) and gradually increasing the concentration until
 $\bar{C}>1$
so that the bulk monomer concentration is above the CMC. Given a value for the total mass
 ${\mathcal{M}}$
, we find from (3.3), (3.4) that
 $\bar{\unicode[STIX]{x1D6E4}}$
satisfies a polynomial of degree
 $N+1$
, with only one physically acceptable real root in the range
 $0<\bar{\unicode[STIX]{x1D6E4}}<1$
, so that the equilibrium state is unique.
Dominant growth rates for different values of the total mass
 ${\mathcal{M}}$
and micelle sizes (a)
 $N=10$
and (b)
 $N=50$
. The rest of the parameters take the values
 $m=0.5$
,
 $n=10$
(i.e.
 $h_{0}=1/11$
),
 $K_{m}=1$
,
 $Pe_{m}=100$
and parameter values for
 $Bi$
,
 $R_{b}$
,
 $Re$
,
 $Bo$
,
 $Ca$
,
 $Ma$
,
 $Pe_{s}$
,
 $Pe_{b}$
remain the same as in figure 4.
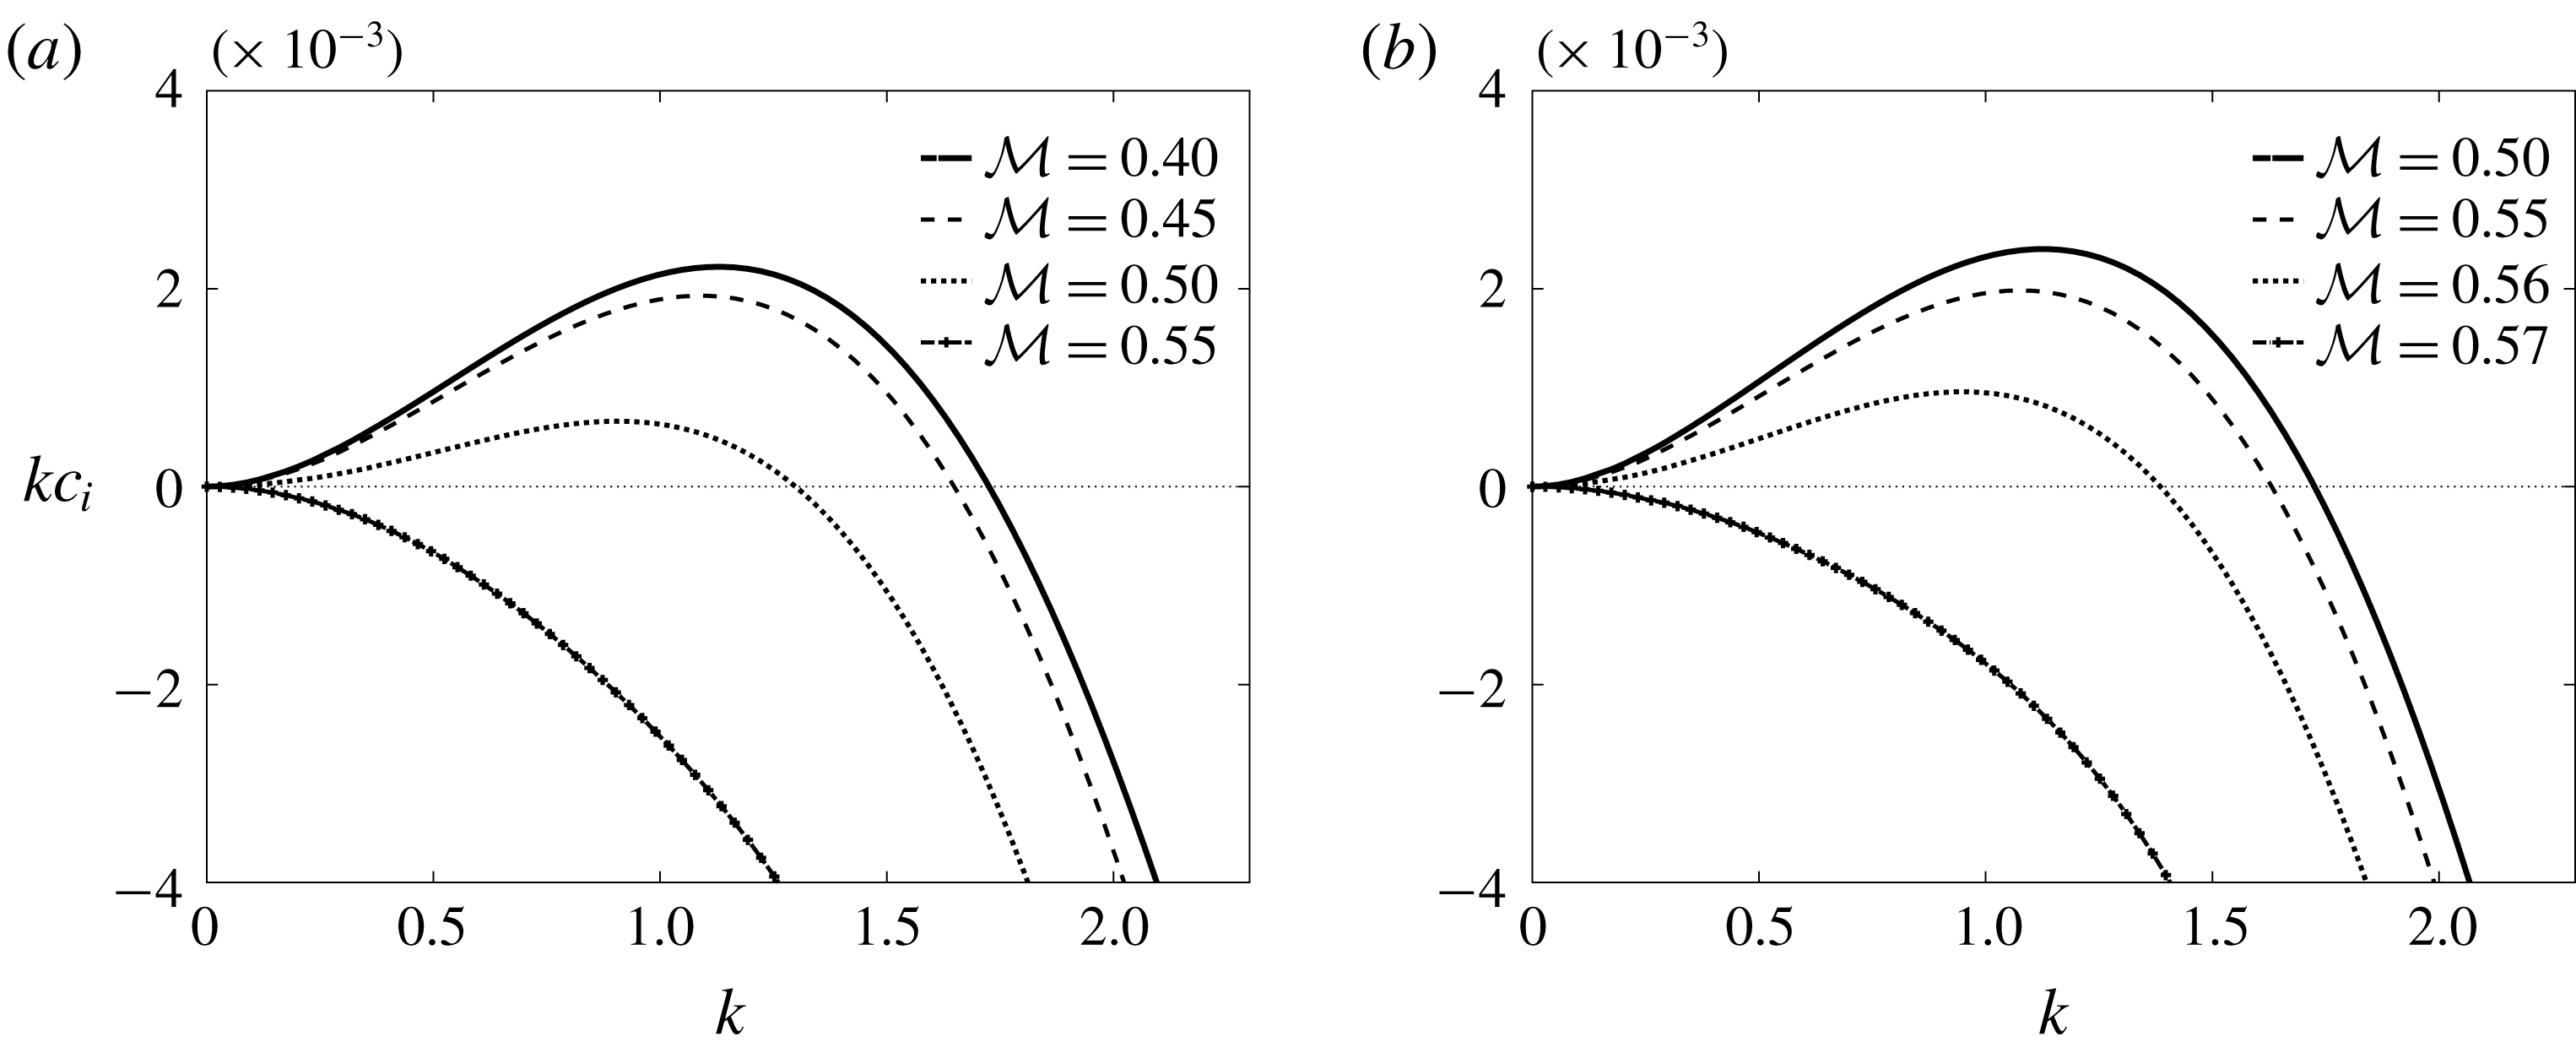
Figure 11 shows the dominant growth rates for various values of the surfactant mass,
 ${\mathcal{M}}$
, and for two different micelle sizes
 $N=10$
and
 $N=50$
(we also set
 $m=0.5$
,
 $n=10$
). While the available mass is relatively small, we find that the growth rate curves are indistinguishable from the corresponding curves found in the absence of micelles; this is physically anticipated as at low mass availability the bulk concentration is small and below the CMC. For the chosen parametric set and
 $N=10$
, this is true for approximately
 ${\mathcal{M}}\leqslant 0.3$
. Increasing the mass diminishes the range of unstable wavenumbers and stabilises the system for
 ${\mathcal{M}}\geqslant 0.519$
(figure 11
a). When the preferred micelle size is larger at
 $N=50$
, more mass needs to be available to stabilise the interface, as shown in figure 11(b). The growth rate remains identical to the equivalent soluble one (obtained for
 $\tilde{M}=0$
) up to
 ${\mathcal{M}}=0.4$
, but a rather rapid transition to stabilisation is seen as the surfactant mass increases to
 ${\mathcal{M}}=0.57$
. The final stable growth rate for large
 ${\mathcal{M}}$
is confirmed to be identical to the growth rate for a clean system without surfactant.
Equilibrium surfactant concentrations
 $\bar{\unicode[STIX]{x1D6E4}}$
,
 $\bar{C}$
,
 $\bar{M}$
against available mass of surfactant
 ${\mathcal{M}}$
, found from (3.4) with
 $N=50$
,
 $h_{0}=1/11$
,
 $\unicode[STIX]{x1D6FD}_{b}=1$
,
 $K_{b}=1$
.

The latter observation is confirmed in figure 12 which illustrates the variation of surfactant concentrations
 $\bar{\unicode[STIX]{x1D6E4}}$
,
 $\bar{C}$
,
 $\bar{M}$
at equilibrium as functions of the total mass
 ${\mathcal{M}}$
, for micelle size
 $N=50$
. It is noteworthy that micelles only start to form for mass higher than approximately
 ${\mathcal{M}}=0.57$
, after which both
 $\bar{C}$
and
 $\bar{\unicode[STIX]{x1D6E4}}$
saturate to constant values while
 $\bar{M}$
keeps increasing (the saturated values are approximately
 $\bar{C}\rightarrow 1$
and
 $\bar{\unicode[STIX]{x1D6E4}}\rightarrow 0.5$
). This implies that as soon as the micellisation starts, the adsorption and desorption processes are suspended, leaving the interface at a constant surface concentration while any additional mass causes the micelle concentration to grow (Burlatsky et al.
Reference Burlatsky, Atrazhev, Dmitriev, Sultanov, Timokhina, Ugolkova, Tulyani and Vincitore2013). The stabilising action of micelles is physically associated with the plateau in the interfacial tension for bulk concentrations beyond the CMC (see figure 3), consequently the multi-layer Stokes flow is expected to be stable (similarly to the surfactant-free problem with constant surface tension).
In cases with
 $m\geqslant n^{2}$
, it is observed that the formation of micelles reduces the range of unstable wavenumbers and drives the growth rates towards zero; this is found to be true even for large values of mass
 ${\mathcal{M}}$
or micelle size
 $N$
(data not shown), and was corroborated using the long-wave asymptotic results.
5 Conclusions
We have presented a mathematical model for the dynamics of a two-layer surfactant-laden flow that allows for surfactant present at high concentrations (above or below the CMC). The model comprises governing equations for the hydrodynamics and appropriate transport equations for the surfactant concentration at the interface, the concentration of monomers in the bulk fluid and the micelle concentration. It accounts for all the salient physical effects, including inertia, density stratification, viscosity contrast, Marangoni stresses, surface and bulk diffusion, adsorption and desorption kinetics and micellar dis/assembly kinetics. In the limit of vanishing desorption or rapid adsorption rates, the model reduces to that of Kalogirou (Reference Kalogirou2018) for a two-layer flow with an insoluble surfactant.
We have performed a linear stability analysis and solved the resulting Orr–Sommerfeld eigenvalue problem to determine the growth rate. This was done analytically in the limit of long-wave disturbances (assuming surfactant concentrations below the CMC) and numerically for perturbations of arbitrary wavelengths using a Chebyshev collocation method. We note that while the Orr–Sommerfeld system includes inertia and gravitational effects, in our results we excluded both of these. The numerical investigation focused on the effect of surfactant solubility and/or sorption kinetics on the stability of the interface by varying the two key parameters:
 $R_{b}$
, which is the ratio of the adsorption rate to the desorption rate; or
 $Bi$
, which is proportional to the rate of desorption.
We have presented numerical results for Stokes flow and for bulk concentrations below or above the CMC. In both cases, short waves were seen to be stable as expected due to the action of surface tension forces (Hooper & Boyd Reference Hooper and Boyd1987), but disturbances of long or intermediate wavelengths were found to be unstable under certain conditions; we have referred to these as long-wave and mid-wave instabilities, respectively. The instability due to a soluble surfactant is manifested provided that a non-zero shear rate is maintained at the interface. We have analysed the effect of sorption kinetics or surfactant solubility by either increasing the Biot number
 $Bi$
or reducing the value of
 $R_{b}$
, respectively. It was found that a flow that is long wave unstable in the presence of insoluble surfactant may be stable if the surfactant is soluble (of concentration below the CMC). Karapetsas & Bontozoglou (Reference Karapetsas and Bontozoglou2014) suggested that the stabilisation due to surfactant solubility is connected to a near 90
 $^{\circ }$
phase shift between the interface displacement and the mass flux
 $J_{b}$
(see their figure 3); this has the effect of redistributing surfactant at the interface so as to stabilise the system. We have confirmed that a similar phase shift is observed here. In particular, the maxima in the eigenfunction of the interfacial disturbance occur at almost the same spatial locations as the maxima of the interfacial concentration disturbance, and this mitigates the Marangoni forces. In the case where the corresponding flow with insoluble surfactant is stable (
 $m\geqslant n^{2}$
), the role of soluble surfactant was found to be destabilising. In this case, the maxima in the interface displacement and the minima in the interfacial concentration disturbance almost coincide, leading to the intensification of the local Marangoni stresses. Interestingly, long-wave instability was found to co-exist with mid-wave instability at specific parametric sets.
When the lower fluid is not the most viscous fluid, i.e. for
 $m\geqslant 1$
, the long-wave approximation of the dominant growth rate has been seen to change asymptotic behaviour from
 $k^{2}$
to
 $k^{3/2}$
at certain values of the parameters (such as
 $R_{b}=R_{b}^{\ast }$
or
 $m=m^{\ast }$
). This was confirmed both numerically and analytically and is similar to what Halpern & Frenkel (Reference Halpern and Frenkel2003) found for multi-layer flows with insoluble surfactant.
The solubility factor
 ${\mathcal{S}}$
in (3.17c
) is less than one for
 $m<1$
, causing the reduction of the leading-order interfacial concentration
 $\tilde{\unicode[STIX]{x1D6E4}}_{0}$
and hence weakening the action of the Marangoni forces. Factor
 ${\mathcal{S}}$
becomes smaller (but always remains positive) as
 $R_{b}$
is reduced, therefore the attenuation of the Marangoni stresses has a stabilising influence as the solubility effects become stronger. We also note that as the critical points
 $R_{b}=R_{b}^{\ast }$
or
 $m=m^{\ast }$
are crossed, factor
 ${\mathcal{S}}$
changes sign, resulting in a 180
 $^{\circ }$
change in phase of the interface concentration
 $\tilde{\unicode[STIX]{x1D6E4}}_{0}$
; the two dominant modes also change sign (and phase), thus the system is always unstable in the vicinity of the boundary points (cf. figures 4 and 9
b). For
 $R_{b}>R_{b}^{\ast }$
or
 $m>m^{\ast }$
, the solubility factor
 ${\mathcal{S}}$
is greater than one, and therefore the Marangoni effects are strengthened with increasing solubility.
When the total mass of surfactant is small, the surfactant concentration in the bulk remains below the CMC. For higher values of available mass, the bulk concentration eventually becomes larger than the CMC, micelles start to form and their action is seen to stabilise the system very rapidly. Any additional mass only increases the concentration of micelles while the interface and bulk concentrations saturate to constant values. Consequently at surfactant concentrations beyond the CMC, the interface is virtually at a constant surface tension, the Marangoni stresses are eliminated and the system behaves as if it was clean (and in the case of Stokes flow, it is stable).
This work represents the first attempt to examine the stability of a multi-layer flow with soluble surfactants beyond the CMC, by incorporating the presence of micelles as well as their formation and break up. The proposed mathematical model provides a useful framework for modelling the nonlinear dynamics of interfaces in multi-layer flows with surfactant above the CMC. This study can motivate experimental work to investigate the predictions of the linear stability theory, as well as nonlinear simulations to examine the dynamics beyond the linear regime. Such nonlinear investigations are currently in progress.
Acknowledgements
A.K. acknowledges funding by a Leverhulme Trust Early Career Fellowship and the Faculty of Science at the University of East Anglia. We would also like to acknowledge Professor C. Breward for helpful discussions.
Appendix A. Solution for Stokes flow
In the case of Stokes flow,
 $Re=0$
, the Orr–Sommerfeld equations (3.7a
) can be solved exactly and the streamfunctions take the form
 $$\begin{eqnarray}\tilde{\unicode[STIX]{x1D6F9}}_{j}(y)=\unicode[STIX]{x1D6FC}_{j,1}\cosh ky+\unicode[STIX]{x1D6FC}_{j,2}\,y\cosh ky+\unicode[STIX]{x1D6FC}_{j,3}\sinh ky+\unicode[STIX]{x1D6FC}_{j,4}\,y\sinh ky,\end{eqnarray}$$
with coefficients
 $\unicode[STIX]{x1D6FC}_{j,\ell }$
,
 $j=1,2$
,
 $\ell =1,\ldots ,4$
. In the absence of a pressure gradient, i.e. for
 $q=0$
, the transport equation for the bulk concentration can be solved in terms of Airy functions, with the solution given by
 $$\begin{eqnarray}\tilde{C}(y)=b_{1}\text{Ai}\left((\text{i}ksPe_{b})^{1/3}\left(y-\frac{c}{s}-\frac{\text{i}k}{sPe_{b}}\right)\right)+b_{2}\text{Bi}\left((\text{i}ksPe_{b})^{1/3}\left(y-\frac{c}{s}-\frac{\text{i}k}{sPe_{b}}\right)\right),\end{eqnarray}$$
where
 $b_{1}$
,
 $b_{2}$
are arbitrary constants. When
 $q\neq 0$
the solution of the bulk equation involves parabolic cylinder functions, but study of that case is not pursued here.
The linear system in § 3.2 can be then written as an eigenvalue problem of the form
 $$\begin{eqnarray}\boldsymbol{{\mathcal{M}}}\boldsymbol{\cdot }\boldsymbol{x}=\mathbf{0},\end{eqnarray}$$
where the matrix
 $\boldsymbol{{\mathcal{M}}}$
depends on the eigenvalue
 $c$
and the eigenvector
 $\boldsymbol{x}=(\unicode[STIX]{x1D6FC}_{1,1},\unicode[STIX]{x1D6FC}_{1,2},\unicode[STIX]{x1D6FC}_{1,3},\unicode[STIX]{x1D6FC}_{1,4},\unicode[STIX]{x1D6FC}_{2,1},\unicode[STIX]{x1D6FC}_{2,2},\unicode[STIX]{x1D6FC}_{2,3},\unicode[STIX]{x1D6FC}_{2,4},b_{1},b_{2},\tilde{\unicode[STIX]{x1D6E4}})^{T}$
holds the unknown coefficients. The non-trivial solution can be found by setting the determinant of
 $\boldsymbol{{\mathcal{M}}}$
to zero and solving the resulting transcendental equation for
 $c$
. In general, numerical computation (e.g. Newton’s method) is needed to obtain the growth rates, but we can check on the analysis of § 3.3 by considering a long-wave expansion for
 $c=c_{0}+kc_{1}+\cdots \,$
and solving only for the two leading-order terms
 $c_{0}$
and
 $c_{1}$
. At
 $\text{O}(1)$
, we find two solutions for
 $c_{0}$
which coincide with the expressions found earlier in (3.12) and (3.21). Solving at the next order
 $\text{O}(k)$
provides two solutions for
 $c_{1}$
. Motivated by the results of § 3.3.4, we can also consider a more general expansion of the form
 $c=c_{0}+k^{1/2}c_{1/2}+kc_{1}+\cdots \,$
. We find that the term
 $c_{1/2}$
vanishes if
 $R_{b}\neq R_{b}^{\ast }$
, in which case we obtain a regular expansion as before, but the term remains in the expansion when
 $R_{b}=R_{b}^{\ast }$
. In the latter situation, we find the solution given in (3.20).
Appendix B.
The following expansion for the wave speed is introduced
 $$\begin{eqnarray}c=\frac{1}{k}c_{-1}+c_{0}+kc_{1}+\cdots \,,\end{eqnarray}$$
motivated by the numerically computed growth rate
 $\unicode[STIX]{x1D706}=kc_{i}$
which is found to have a non-zero value at
 $k=0$
. The linear bulk concentration system (3.9) at leading order in
 $k$
becomes (assuming we are below the CMC)
 $$\begin{eqnarray}\displaystyle & \displaystyle \tilde{C}^{\prime \prime }(y)+\text{i}Pe_{b}c_{-1}\tilde{C}(y)=0, & \displaystyle\end{eqnarray}$$
 $$\begin{eqnarray}\displaystyle & \displaystyle \tilde{C}^{\prime }(0)=0,\quad \tilde{C}^{\prime }(h_{0})+\frac{\text{i}c_{-1}Pe_{b}\unicode[STIX]{x1D6FD}_{b}BiK_{b}(1-\bar{\unicode[STIX]{x1D6E4}})}{(\text{i}c_{-1}-Bi(K_{b}\bar{C}+1))}\tilde{C}(h_{0})=0, & \displaystyle\end{eqnarray}$$
 $c_{-1}$
, given by
 $$\begin{eqnarray}\text{i}c_{-1}({\mathcal{C}}\tan ({\mathcal{C}}h_{0})-Pe_{b}\unicode[STIX]{x1D6FD}_{b}BiK_{b}(1-\bar{\unicode[STIX]{x1D6E4}}))-Bi(K_{b}\bar{C}+1){\mathcal{C}}\tan ({\mathcal{C}}h_{0})=0,\end{eqnarray}$$
with
 $$\begin{eqnarray}{\mathcal{C}}=(1+\text{i})\sqrt{\frac{Pe_{b}c_{-1}}{2}}.\end{eqnarray}$$
It is not possible to solve this equation analytically, but solutions can be obtained using Maple for specific values of the parameters.



