I. INTRODUCTION
Biomimetic mineralization is the replication of a biological template into an inorganic structural or functional material and provides a powerful tool to create complex material structures.Reference Will, Zollfrank, Kaindl, Sieber and Greil1–Reference Fan, Chow and Zhang3 These can include detailed structural features, such as undercuts, gradients, or continuous networks, which can only be elaborately produced with conventional top–down fabrication methods.Reference Bhushan4, Reference Zampieri, Schwieger, Zollfrank and Greil5 Natural functional materials are interesting templates for converting them into inorganic materials for a wide range of materials for various applications.Reference Fan, Chow and Zhang3, Reference Zampieri, Schwieger, Zollfrank and Greil5–Reference Paris, Burgert and Fratzl10
Wood is such a natural structural and functional material comprising several levels of hierarchy.Reference Fengel and Wegener11 Tracheids with diameters of 10–20 μm (latewood) or 30–40 μm (earlywood) are the dominating structural features of the xylems of softwoods such as spruce (Picea abies) or pine (Pinus silvestris).Reference Wagenführ12 The wood xylem cell walls are composed of helically oriented cellulose fibril arrays embedded in a biopolymer matrix of lignin and hemicelluloses, which function as a connective intermediate.Reference Fengel and Wegener13, Reference Fahlen and Salmen14 Several models have been proposed for the spatial arrangement of the biopolymer components in the wood cell wall.Reference Fahlen and Salmen14–Reference Sell and Zimmermann17 In native spruce wood, the fibril arrays have diameters of roughly 10–20 nmReference Fahlen and Salmen14 and are composed of elementary cellulose fibrils of about 2.5 nm in diameter,Reference Jakob, Fengel, Tschegg and Fratzl18 embedded in a hemicellulose and lignin matrix. In the dominatingly thick S2 cell wall layer of normal spruce early-sapwood, the cellulose fibrils are arranged parallel and their angle with respect to the cell axis is between 3° and 5°.Reference Gierlinger, Luss, Koenig, Konnerth, Eder and Fratzl19, Reference Lichtenegger, Reiterer, Stanzl-Tschegg and Fratzl20 They, therefore, form a group of helices wound around the cell lumen.
The replication of wood and its structural features on the hierarchical level of the cells has been successfully demonstrated in a wide range of materials,Reference Byrne21, Reference Greil22 prominently carbon,Reference Paris, Zollfrank and Zickler23, Reference Zollfrank and Fromm24 silicon carbide,Reference Sieber, Hoffmann, Kaindl and Greil25 silicon/silicon carbide,Reference Zollfrank and Sieber26, Reference Greil, Lifka and Kaindl27 or silica.Reference Drum28 However, the replication of the wood structure on all levels of hierarchy down to the fibril level could so far only be successfully achieved in very few investigations. Some of the authors of this study have recently been able to synthesize for the first time a ceria/zirconia ceramic replica with nanometer precision this way.Reference Deshpande, Burgert and Paris29 Other workers were able to produce silica replicates of wood, but they were either rather vague on the actual nature of the samples produced, suggesting that no monolithic samples were producedReference Persson, Hafren, Fogden, Daniel and Iversen30 or did claim, but not conclusively show the replication of the fibril structure of the templates used.Reference Shin, Liu, Chang, Nie and Exarhos31 Nanometer-scale replication is, however, thought to be the key to novel functional properties based on hierarchical structuring, such as for instance actuatorsReference Paris, Burgert and Fratzl10 or optical devices.Reference Shopsowitz, Qi, Hamad and MacLachlan32
In this work, a general pathway for the production of monolithic, hierarchically structured wood replicas is given with the example of the target material silica. Chemical treatment procedures on wood templates are systematically investigated, leading to full silica replication of the various structural features of wood down to the fibril level of hierarchy. It is shown how opening the cell walls and keeping them in a swollen state enables a uniform deposition of the silica precursor over the whole cross section of the template cell walls, which is essential for true replication.
II. EXPERIMENTAL
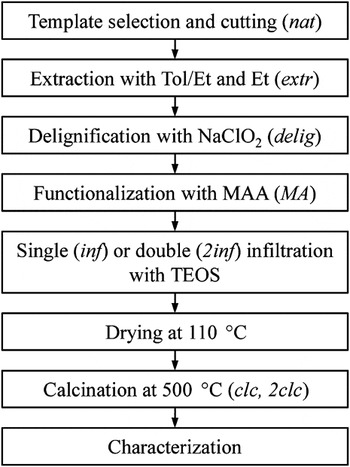
Thin sections of wood were cut with a microtome (RM2255; Leica, Wetzlar, Germany). The chemicals used in this work are ethanol [(Et; purity 99.9%), VWR, Darmstadt, Germany], N,N-dimethylacetamide [(DMAc; purity 99.0%), Sigma-Aldrich Chemie, Steinheim, Germany], toluene [(Tol; purity 99.9%), Merck, Darmstadt, Germany], acetic acid (purity >99.9%; Merck), sodium chlorite (purity ∼80%; Roth, Karlruhe, Germany), maleic acid anhydride [(MAA; purity 99%), Merck], triethylamine [(TEA; purity 99.5%), Fluka, St. Gallen, Switzerland], and tetraethyl orthosilicate [(TEOS; purity 99.8%), Merck]. All chemicals were used as received. Figure 1 gives an overview of the complete template processing and the sample names used in this work.
Chart of the sample preparation and names (in brackets) of the templates obtained from different processing steps.

The wood samples (either cubes with side lengths of 1 cm or radial thin sections of 300-μm thickness) were cut from the sapwood of spruce trees, weighed, and subsequently subjected to a series of chemical treatments. In a first step, 150 g of wood was washed by extraction with 500 mL of a 2:1 by weight mixture of toluene and ethanol and then with the same amount of pure ethanol for 6 h each using a Soxhlet apparatus. Templates obtained in this manner are called extr in this manuscript. All samples were stored in ethanol between the processing steps to prevent drying effects. This also facilitated supercritical drying for microstructure analysis after each step. For any treatment, 1 g of wood was placed in the respective solution and a mild vacuum from a water-jet pump was applied for half an hour. Following the treatment, they were immediately extracted with ethanol to remove residual treatment solution. A number of templates were delignified with 1.4 g of sodium chlorite and 0.5 g of acetic acid in 23.1 g of water at a temperature of 70 °C. Delignification solutions were renewed after 3 h and the samples treated for another 3 h. Templates obtained in this manner are named delig. Some of these were further modified with 2.4 g of MAA in 5.4 g of DMAc with 0.13 g of TEA as the catalyst for 1 h at a temperature of 100 °C. Templates obtained in this manner are termed MA. Finally, extr, delig and MA templates were infiltrated with a solution of 1.0 g TEOS in 8.0 g Et. They were kept at 50 °C until the Et had evaporated and the TEOS had been soaked up by the samples, after which they were dried at 85 and 110 °C. TEOS-infiltrated samples are termed as inf. Samples were calcined at 500 °C with a heating rate of 60 °C/h, introducing holding times of 0.5 h at 200, 330, and 470 °C. Additionally, calcinations at 750 °C were performed for comparison. The samples calcined at 500 °C are named clc. Other samples were twice infiltrated with TEOS and are called 2inf and 2clc, if calcined. Templates that were not infiltrated are termed nat. To assess the structures of samples from earlier processing stages, they were taken from their ethanol storage container and supercritically dried (Samdri-PVT-3D; Tousimis, Rockville, MD) to preserve their original pore structure.
Thermogravimetric analysis (TGA) and differential thermal analysis (DTA) curves were simultaneously recorded in air with a heating rate of 300 °C/h on a combined TGA/DTA device (STA 409; Netzsch Gerätebau, Selb, Germany). The linear shrinkages in axial, radial, and tangential directions (Δl ax,Δl rad,Δl tan); mass losses (Δm); and geometrical densities (ρ geom) of samples from each processing step were determined and related to those of the original, untreated templates by ΔX = X 1/X 0 − 1, with X = (l ax;l rad;l tan;m). For this, the wood cubes were used to maximize the number of wood cells measured. The strut densities (ρ strut) of the same samples were analyzed using a helium pycnometer (AccuPyc 1330; Particle and Surface Sciences, Gosford, Australia). From ρ geom and ρ strut, the porosity (P) of the materials was calculated by P = 1 − ρ geom/ρ strut.
Samples were transferred onto a sample holder covered with conductive carbon paste (Leit-C; Plano, Marburg, Germany) and sputtered with gold for scanning electron microscopy (SEM) analyses (Quanta 200; FEI, Hillsboro, OR). The SEM imaging was carried out at an acceleration voltage of 20 kV.
For transmission electron microscopy (TEM) imaging, noncalcined samples were embedded in LR White resin (SPI Supplies, West Chester, OH) using a gentle vacuum and with subsequent hardening at 75 °C for 3 days. The embedded samples were trimmed with a steel razor blade and then cut with an ultramicrotome (UC6; Leica Microsystems, Bannockburn, IL) to 80-nm-thick sections. Calcined samples were embedded and ground down to a thickness of 10 μm, then thinned by ion beam (PIPS691; Gatan, Pleasanton, CA). A TEM (CM30; Philips, Einhoven, The Netherlands) operated at an acceleration voltage of 300 kV and with an attached charge-coupled device camera (FastScan-F114; Tietz Video and Image Processing Systems, Gauting, Germany) was used for imaging. Energy-dispersive x-ray analysis [(EDX) ISIS30; Oxford Instruments, Abingdon, United Kingdom) was used to investigate the chemical composition of the TEOS-infiltrated wood cell wall.
Small-angle x-ray scattering (SAXS) experiments were performed using a pinhole camera (NanoSTAR; Bruker AXS, Karlsruhe, Germany). The system was operated with a sealed copper tube generator at 1.2 kW. The Cu Kα radiation was selected using cross-coupled Göbel mirrors (Bruker AXS, Germany). The samples were measured, where possible, at six different positions to expose earlywood and latewood. Only one sample, ext clc, was too fragmented to allow a scan and was measured at just one position. The two-dimensional (2D) scattering patterns were collected at a sample-detector distance of 1048 mm using a charge-coupled device detector (HiSTAR; Bruker AXS, Germany). X-ray transmissions were determined from the intensities recorded from a piece of glassy carbon.
The 2D scattering patterns were evaluated in two ways. First, they were multiplied by sin(χ), where χ is the angle between a direction on the detector plane and the fiber direction, to assure a pattern that results in a spherically averaged scattering curve, assuming fiber symmetry of the samples. Based on these 2D data, the scattering curve I(q) was calculated by azimuthal integration, where q = 4π/λ∙sinθ/2 (λ = wave length, θ = scattering angle) is the absolute value of the scattering vector.Reference Jakob, Tschegg and Fratzl33 Second, the 2D data were integrated radially where all the points within one degree and within a q-range from 1.14 to 1.90 nm−1 were grouped within one bin resulting in the intensity function I(χ).
Radii of gyration of the fiber cross sections were calculated from the slope of a representation of ln[I(q)q] versus q 2 within the q-range from 0.112 to 0.219 nm−1.Reference Porod, Glatter and Kratky34 The I(q) curves were transformed into real space using the indirect Fourier transformation technique,Reference Glatter35–Reference Glatter37 resulting in pair distance distribution functions of the whole structure and in pair distance distribution curves of the cross sections of the fibers. An orientation parameter ρ was determined by approximating two Lorentzian peaks on a constant background to the I(χ) function. Then, ρ was defined as the area under the peaks relative to the total area under I(χ). If the height of the fitted peaks was less than 2.5 times the mean height of the noise on the data, the orientation parameter was set to 0 to avoid interpretation of statistical fluctuations.
III. RESULTS AND DISCUSSION
A. Dimensional and mass changes
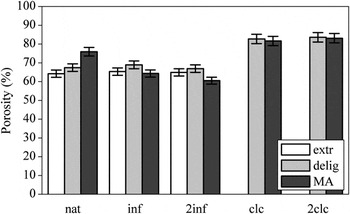
The dimensions of the extremely brittle extr clc and extr 2clc samples could not be determined because of lack of availability of monolithic samples. Evaluation of the delignified samples showed that the delignification method used in this work resulted in Δl ax = −0.2%, Δl rad = −2.3%, Δl tan = −2.9%, and Δm = −9.6%, as determined from delignified and supercritically dried samples. The reported amount of cellulose, hemicelluloses, and lignin in spruce wood is 53, 13, and 29 wt%Reference Klason38 or 42, 26, and 27 wt%, respectively.Reference Hagglund39 These wood components are closely associated within the wood structure, which explains discrepancies in the quantification of their composition.Reference Salmen and Olsson40 With regard to the observed mass loss due to the delignification treatment utilized in this work, this means that roughly a third of the total amount of lignin was removed. The maximum fraction of lignin that could be removed by this method was found to be 65%.Reference Ahlgren, Yean and Goring41 The fact that less lignin was removed in this work is conclusive, as a complete removal was not desired. Instead, the templates were delignified just to the point at which they still showed structural integrity. The MAA functionalization step led to Δl ax = +0.4%, Δl rad = +4.9%, Δl tan = +7.5%, and Δm = +6.0%, which was below the swelling values and mass gains determined in earlier works.Reference Timar, Maher, Irle and Mihai42, Reference Zollfrank, Kladny, Sieber and Greil43 It is proposed that this is due to the lignin removal performed in this work: nondelignified wood offers more material for the swelling with DMAc, whereas the open spaces created by the delignification are nonswelling “dead space.” From the strut densities obtained by helium pycnometry and from the geometrical densities of the samples, their porosities were calculated (Fig. 2). The expected increase in porosity of the nat templates from extr over delig to MA is due to the formation of cellulose fibril interstitial space through the removal of lignin and their subsequent increase by modification with MAA. The decrease in porosity during infiltration by the filling of these interstitials is equally expected. The high porosities of the final calcined materials are due to the removal of the remaining biopolymers from the template.
Porosities of the samples from different processing steps.

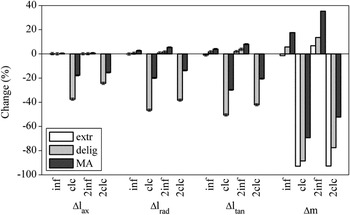
During the infiltrations, all templates showed anisotropic swelling (Fig 3). This is due to the cellulose fibril orientation in the templates, which allows almost no stretching in axial direction, i.e., close to parallel to the orientation of the stiff fibrils. It did, however, allow for the uptake of material into the fibril interstitials. This further increased the distance between the fibrils, which swelled the templates radially and tangentially.Reference Sebe, Tingaut, Safou-Tchiama, Petraud, Grelier and Jeso44 The even larger swelling in tangential direction is also due to the cellulose fibril orientations, as demonstrated recently.Reference Burgert, Eder, Gierlinger and Fratzl45 The MA templates showed the highest porosities (75.9%) before the infiltration and the lowest porosities (64.3%) and largest swelling (Δl ax = +0.4%, Δl rad = +2.7%, Δl tan = +4.0%) and mass gains (Δm = +17.7%) afterwards. This confirms the successful increase of the fibril interstitials in these templates and their subsequent filling with TEOS. Mass gains from the infiltration of silica sol–gel precursors into wood templates up to 20% were reported, matching the findings of this work.Reference Miyafuji, Kokaji and Saka46, Reference Fu and Zhao47 For 2inf samples, a higher swelling (Δl ax = +0.7%, Δl rad = +5.4%, Δl tan = +8.0%) and mass gain (Δm = +35.4%) were observed. Despite the higher swelling, a reduction of the porosities to 60.5% was observed, indicating the deposition of further material during the second infiltrations. The extr templates showed almost no swelling and mass change after one infiltration (extr inf), but a significantly larger mass increase and swelling after the second one (extr 2inf). It is suggested that the first infiltration and subsequent drying mechanically opened the cell walls, facilitating the uptake of TEOS during the second infiltration. Cracking of the wood cell wall during drying is a known process that has been reported in literature.Reference Jungnikl, Paris, Fratzl and Burgert48, Reference Burgert, Eder, Fruehmann, Keckes, Fratzl and Stanzl-Tschegg49 It was also shown that the MAA functionalization effectively reduced the shrinkages of the final materials by 64% (Δl rad in MA 2clc) in relation to the delig templates and increased the final masses of the 2inf samples by 213%, a phenomenon that was also reported by others.Reference Zollfrank, Kladny, Sieber and Greil43, Reference Rowell50
Dimensional and mass changes of the samples from different processing steps.

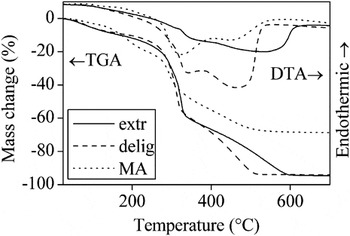
The thermal properties of 2inf templates, assessed by simultaneous TGA/DTA analysis showed the mass losses and according DTA signals typical for cellulosic materials (Fig. 4).Reference Beall51 The starting temperatures of the same mass loss processes in the twice infiltrated materials vary depending on the type of template used. The extr 2inf samples exhibited delayed mass losses owing to their still-intact lignin matrix, which restricts the transport of volatiles. In the MA 2inf samples, the mass losses and according DTA signals were found at lower temperatures, most likely due to their more porous structure. The final mass losses at temperatures above 600 °C are in agreement with those determined from templates calcined regularly in furnaces (Fig. 3). The most striking difference between the TGA curves of the three different templates is the strongly reduced mass loss of the MA-functionalized infiltrated templates upon calcinations. This mass loss is due to their much higher TEOS uptake on infiltration, as discussed earlier. There appears to be a discrepancy between the mass gained during the infiltrations and the mass remained after calcinations, the latter being higher. This discrepancy is because all measurements were related to the original, completely untreated templates. This was necessary because the samples were kept wet throughout processing. With the mass loss during delignification determined to be ∼10%, the mass gains of delignified samples add up to within 4.3% (delig inf), 3.1% (MA inf), 1.1% (delig 2inf), and 2.5% (MA 2inf) of their residual mass after calcination. This good correlation also illustrates the complete removal of the biological templates by the calcination process. Another indicator for this is the brilliant whiteness of calcined samples. As the first mass loss process in cellulosic materials is the transformation of carbon compounds to graphitic carbon, any residual carbon in the samples would most likely be dark in color.Reference Branca and Di Blasi52 The TGA of the extr 2inf sample shows a final mass loss that is finished only at 600 °C, which suggests that the maximum calcination temperature of 500 °C used in this work might be too low. However, the calcinations were carried out using a furnace cycle that included holding at 500 °C for 2 h. By contrast, the TGA/DTA measurements were performed under constant heating. This further illustrates the importance of a slow and adapted furnace cycle to remove all organic material from the samples.
Thermogravimetric analysis/differential thermal analysis profiles of delig 2inf samples.

B. Electron microscopy
SEM micrographs of the infiltrated templates and calcined materials are shown (Fig. 5), but those of the original templates are omitted for brevity. The extracted templates had 4.5 ± 1.5-μm (determined graphically from 10 central cell walls) thick, intact cell walls in agreement with the reported cell wall thickness in coniferous earlywood.Reference Fengel and Wegener13, Reference Burgert, Eder, Fruehmann, Keckes, Fratzl and Stanzl-Tschegg53 Micrographs of pieces of extr 2clc samples showed a distorted microstructure with only remnants of their former wood structure [Fig. 5(b)]. The micrographs also showed silica beads with diameters of 1 μm on the former cell wall structures. These were already observed in extr 2inf samples [Fig. 5(a)] and were formed by the TEOS that did not enter the cell walls, as observed in common silica precursor systems.Reference Stoeber, Fink and Bohn54 It is evident that lignin in the cell walls limits the uptake of TEOS, leading only to a coating. The extr 2inf samples had a cell wall thickness of 4.8 ± 1.5 μm. SEM micrographs of delig nat templates revealed cell walls with the expected signs of chemical attack.Reference Stoll and Fengel55 The compound middle lamella that contains much more lignin than the cell S2 layer appeared to be excessively damaged.Reference Gierlinger, Luss, Koenig, Konnerth, Eder and Fratzl19, Reference Fromm, Rockel, Lautner, Windeisen and Wanner56 Also, the overall thickness of the cell wall was reduced to 4.2 ± 0.8 μm, indicated in literature as the removal of lignin.Reference Fengel and Stoll57 The delig 2inf samples again showed thicker cell walls (6.3 ± 2.3 μm) than their extr 2inf counterparts [Fig. 5(c)]. After calcination to delig 2clc, the cellular wood structure was well replicated with silica, with a cell wall thickness of 2.5 ± 0.6 μm [Fig. 5(d)]. The MA nat templates did also show a degraded cell wall structure, with a thickness of 4.8 ± 1.4 μm. It was greatly enlarged to 12.0 ± 2.3 μm after infiltration to MA 2inf [Fig. 5(e)] and led to a perfect positive replica with 4.2 ± 0.7-μm-thick cell walls after calcination to MA 2clc [Fig. 5(f)]. Consequently, thorough removal of lignin without distorting the structural integrity of the wood was determined to be a very important step in synthesizing hierarchical ceramics from wood, in agreement with earlier findings reported in literature.Reference Deshpande, Burgert and Paris29
Scanning electron micrographs of (a) extr 2inf, (b) extr 2clc, (c) delig 2inf, (d) delig 2clc, (e) MA 2inf, and (f) MA 2clc.

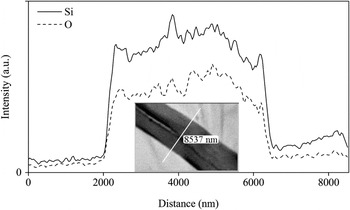
The TEM was run in scanning mode (STEM) and in combination with EDX to assess the locations of silicon and oxygen within the infiltrated cell walls. From line scans of 2inf samples (Fig. 6), it was determined that the silica was homogeneously deposited within the cell walls, confirming the good penetration of the infiltration solution and, therefore, the success of the sol composition.
Silicon and oxygen content of a delig 2inf cell wall determined by STEM–EDX linescan of a cross section (inset) to illustrate the distribution of condensed silica over an infiltrated cell-wall cross section.

C. Small-angle x-ray scattering
The calculation of the spherically averaged scattering curves was based on the assumption that the fibers within the wood tissue are predominantly oriented in a direction almost parallel to the cell axis. This is true if the scattering contribution from the S2 layer of the cell wall dominates the overall scattering and if there is only a slight tilt between the orientation of the stem and the orientation of the fibers within the S2 wall (small fibril angle). This assumption is generally true for spruce wood, as the S2 layer makes up 79% of the cell wall in earlywood and 86% in latewood.Reference Fengel and Stoll58 Because there is no splitting of the peaks in the I(χ) functions, the fibril angle is taken to be less than 5°, justifying the assumption.
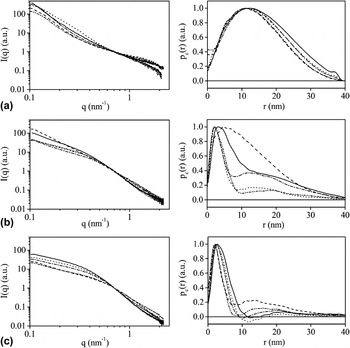
The SAXS profile of the extr nat template [Fig. 7(a), left] shows the typical strong decrease of I(q) with increasing q, but few other distinct features. Fourier transformation into real space [Fig. 7(a), right] revealed that the size of most of the structures seen is considerably larger than the experimental resolution. There is a small shoulder at distances of about 5 nm, which is also seen in the scattering by a hump between 1 nm−1 and 2 nm−1, indicating the presence of fibrillar structures. This structure is hardly visible due to the low electron density contrast between the biopolymers composing the wood tissue. Therefore, the scattering was presumably dominated by the contrast between the biopolymers and cracks that might have been formed upon drying the samples.Reference Jungnikl, Paris, Fratzl and Burgert48 Infiltration of extracted templates with TEOS (extr inf and extr 2inf) did not change the scattering pattern significantly, suggesting that TEOS hardly penetrates into the cell wall. In the scattering patterns of the calcined samples (extr clc and extr 2clc), the fibrillar structures with radius 5 nm had completely disappeared. In the case of nanofibrillar templating, one would have expected a strong contrast between the resulting silica structures and the pores, where the organic components had been. The absence of a clearly visible nanostructure in the scattering data indicates that any structural details at the nanometer scale had been completely lost.
Scattering curves (left) and cross section pair distance distribution functions (right) of (a) extr, (b) delig, and (c) MA. nat (solid), inf (dotted), clc (dashed), 2inf (dash-dotted), 2clc (dash-dot-dotted). All curves shown are from earlywood.

Delignification caused a large change in contrast between the remaining cellulose fibrils and their surroundings, which is now assumed to be mostly porous space. The scattering curves [Fig. 7(b), left] and their real space analogues [Fig. 7(b), right] show typical features of distinctly elongated, rod-like structures, i.e., fibrils. The mean diameter of these structures is estimated to be ∼12 nm, but larger scattering structures were also present. This length scale is fully compatible with the size of cellulose fibrils in wood.Reference Fahlen and Salmen14 Infiltration of the delig nat templates to delig inf resulted in structures that are very similar to the templates. The diameter of these structures is still ∼12 nm and only the decreased contrast reduced the detectability of neighboring structures. The sample that had been infiltrated twice (delig 2inf) showed the same features. These samples, however, led to different structures after calcination (delig 2clc). In the calcined delig inf samples (delig clc), the nanostructures were mostly lost [Fig. 7(b), right, dashed line]. A shoulder in the pair distance distribution function at ∼4 nm indicates that small parts of the original structure may have been preserved. By contrast, the delig 2clc sample showed structures that are very similar to those found in the delig inf and 2inf samples. The diameter of these fibrils is about 10 nm, but most importantly, there are few larger structures present.
Functionalization of delignified templates with MAA did not change the nanoscale structure significantly [Fig. 7(c)]. The scattering patterns correspond to the typical elongated structures with a diameter of ∼12 nm. These structures remained basically unaltered by infiltration with TEOS, regardless if it is performed once or twice (MA inf and MA 2inf). This structure was also largely preserved after calcination (MA clc and MA 2clc). It is noted that, in contrast to the delignified sample, here also the only once infiltrated sample led to a preservation of the entire nanoscale structure after calcination.
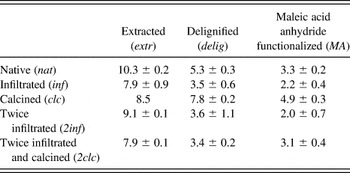
The radii of gyration of the cross sections were calculated to derive better estimates of the diameters of the fibrillar structures (Table I). Even though the radius of gyration is strictly interpretable only for dilute systems, it is known to give reliable size estimates also for densely packed structures.Reference Fratzl and Lebowitz59 The radii of gyration plotted in Fig. 8 agree well with the general trend outlined above. R g is above 6 nm if nanostructures cannot be clearly identified due to low contrast or structure loss after calcinations. This is the case for all the samples based on the extr template and for the delig clc sample. Values between 4 and 6 nm as in the delig nat and the MA clc sample indicate samples that also show some larger structures besides the elongated nanostructures discussed earlier. If the radius of gyration of the cross section is below 6 nm, then the presence of fibrillar structures is dominant. This is the case for the delignified samples after infiltration with TEOS (delig inf and 2inf) and for all 2clc samples except extr. It is also the case for the MA inf and MA 2inf samples.
Radii of gyration of the cross sections from different processing steps.

Radii of gyration of the rod-like cross sections calculated from small-angle x-ray scattering measurements (nm).

Besides the nanostructure size, the orientation parameter ρ gives additional and complementary information on the preservation of the original fibrillar orientation in the final calcined materials (Fig. 9). The orientation ρ is high (≥0.4) for all templates and for the infiltrated samples, as they all contain the fibrillar nanostructures. Calcination of the samples based on the extracted templates leads to very low values of ρ, indicating again the complete loss of nanostructural features. It should be noted that the large q values used for the calculation of the orientation parameter correspond to small structures and are, therefore, not due to drying cracks, which are also essentially parallel to the cell axis (at low q values, the scattering spectra and corresponding pair distance distribution functions are very similar). The delig inf samples partly lost their orientation after calcination, but orientation was preserved in the delig 2clc samples. This is in excellent agreement with the observations from the analysis of the radial scattering profiles. If the samples were functionalized with MAA, there is no marked change in orientation for the various steps investigated, indicating this treatment as optimal for the preservation of the complete wood structure. The delig 2clc, MA clc, and MA 2clc silica materials are, therefore, cellular and also nanoporous solids, with the nanoscale pores closely following the former cellulose fibril orientation.
Orientation parameters from different processing steps.

The influence of larger amounts of the TEOS solution during a single infiltration relative to multiple infiltrations was tested on delignified wood. If one uses double the usual amount, one obtains after calcination a structure with a pair-distance distribution function that is similar to the delig clc sample at small distances. This function decays at larger distances faster than the one that was infiltrated with the standard concentration. However, the overall size of the structures is, with a radius of gyration of the cross section of 5.8 ± 0.2 nm, considerably larger than in the case of sample delig 2clc. A further increase in amount reduced the size of the structures further, but even at an amount that is 10 times the original one, the radius of gyration of the cross section is 4.4 ± 0.5 nm. This is still larger than the value of 3.6 ± 0.3 nm that is found for the delig 2clc sample. Also, the orientation parameter did not change significantly for the single infiltrations with multiple amounts.
D. Condensation reaction
Condensation reactions of TEOS include the water-producing (1), and the ethanol-producing (2), mechanisms, with x being the degree of hydrolysis.Reference Assink and Kay60, Reference Brinker and Scherer61


The samples were infiltrated with an anhydrous mixture of ethanol and TEOS. This was done to minimize x and to restrict the condensation mechanism to the 20 times slower ethanol-producing reaction,Reference Assink and Kay60 hereby reducing the rate of silica formation in the infiltration solution. The effectiveness of this approach could be observed by the stability of the Et/TEOS sol, which stayed clear during the complete immersion process. Instead, TEOS was soaked up by the delignified cell walls as shown by the swelling of the wood cell walls determined by SEM, the STEM–EDX analyses of infiltrated thin sections and as reported in literature.Reference Saka, Sasaki and Tanahashi62 If a single TEOS molecule is considered to be a tetrahedron with one of the hydrogen atoms from the terminating methyl group at each corner, one can, from bond lengths and geometrical considerations and ignoring rotations along the single bonds, calculate its size. The maximum side length of this tetrahedron is 770 pm and the distance from one corner to the opposite plane 667 pm, which is sufficiently small to enter the elementary fibril interstitials of 2–3 nm. If the TEOS was hydrolyzed and condensed before penetrating the cell wall, its oligomeric units would conclusively not have been able to enter the interstitial space. This was confirmed by early experiments using a classical StöberReference Stoeber, Fink and Bohn54 sol–gel system, whose comparatively large colloidal particles could not enter the wood cell walls and, therefore, did not yield monolithic biotemplated specimens after calcination. The infiltration of TEOS into wood might give rise to two additional condensation reactions involving wood methylol groups as shown in Eqs.(3)Reference Fu, Zhao and Chun63 and (4).


The amount of TEOS infiltrated into wood samples was chosen as to provide 1 mol of TEOS per mol of glucose units in the cellulose fibrils to assess the ability of the process to equally deposit the silica in the template. The homogeneities of the calcined materials (Fig. 5) and the even distribution of silicon in infiltrated materials (Fig. 6) illustrate the success of this approach. Similar approaches have been used in the past to improve the photostability and fire resistance of wood.Reference Saka and Yakake64, Reference Saka and Ueno65 It was found that silica in wood cell walls stabilizes the cell walls against moisture swelling.Reference Saka, Sasaki and Tanahashi62 This effect was found to be stronger with more amount of silica deposited. In this work, it was also found that the use of a larger amount of TEOS, as opposed to several infiltrations, had a pronouncedly different effect and did not replicate the cellulose fibrils in a satisfactory manner when calcined.
IV. SUMMARY AND CONCLUSIONS
This work reports on the successful replication of the nanoscale structure of wood in calcined silica materials, while retaining the whole hierarchical structure of the monolithic samples. Nanoscale replication was unambiguously verified by SAXS, demonstrating fibrillar structures of 2- to 4-nm radius oriented parallel to the original cellulose fibrils. The opening of spaces between the cellulose fibrils by delignification and maintaining a constantly swollen state of the samples during the infiltration of the silica precursor were found to be crucial for the replication of the wood templates on all hierarchical levels. Another important finding was that one infiltration cycle was insufficient to perfectly replicate the structure on the nanometer scale. It appeared to be most effective to perform several infiltrations with a lower amount of TEOS. The functionalization with MAA further improved the process by reducing the shrinkage of the samples and by increasing the uptake of material during infiltration. It is proposed that by adhering to the principles used in this work, different material systems mimicking cellulosic structures down to a nanometer scale with improved mechanical and functional properties can be prepared. The material obtained may show promising new functionalities based on its helical nanometer pore structure, for example, for the separation of chiral molecules or for the use as humidity-driven actuators. This is put forward as a subject of further research.
ACKNOWLEDGMENTS
This work was performed as part of Project IX “Hierarchically structured porous ceramics and composites from nanocasting of plant cell walls” in the framework of the priority program SPP1420 of the German Research Foundation (Deutsche Forschungsgemeinschaft). The grant of our project and the financial aid allocated to our work through SPP1420 is gratefully acknowledged. We also thank Ingo Burgert and Annemarie Martins from the Max Planck Institute of Colloids and Interfaces, Potsdam: Ingo Burgert for providing the wood samples and for many fruitful discussions, and Annemarie Martins for preparing the wood sections.