I. INTRODUCTION
The shape, size, and crystallinity of nanoparticles have significant influences on their electrical and optical properties and hence it is essential to be able to control particle size and shape, as well as their distributions and crystallinity,Reference Centi and Perathoner1–Reference Nirmal and Brus5 which requires a detailed understanding of the mechanisms of nucleation and growth, as well as such processes as aggregation and coarsening.
Although the movement of electrons and holes in semiconductor materials is primarily dominated by the well-known quantum confinement, the transport properties related to phonons and photons are largely influenced by the size, geometry, and crystallinity of the materials.Reference Kongkanand and Kamat6–Reference Murray, Kagan and Bawendi11 A variety of ideas for morphological control have been introducedReference Scher, Soc, Manna and Alivisatos12–Reference Garcia and Tello31 based on: (i) a mixture to bind them selectively to the crystallographic faces for CdS,Reference Scher, Soc, Manna and Alivisatos12 (ii) monomer concentration and ligand effects for CdSe,Reference Peng, Manna, Yang, Wickham, Scher, Kadavanich and Alivisatos13 (iii) growth rate with controlled heating rate for CoFe2O4,Reference Song and Zhang14 (iv) biological routes in peptide sequence for FePt,Reference Reiss, Mao, Solis, Ryan, Thomson and Belcher15 (v) controlled removal of protecting organic stabilizer for CdTe,Reference W Yu, Wang and Peng16–Reference Tang, Kotov and Giersig18 (vi) anodic alumina used as a template,Reference Masuda and Fukuda19, Reference Masuda, Yamada, Satoh, Asoh, Nakao and Tamamura20 (vii) anodic oxidation of titanium metal for producing nanotube arrays,Reference Shankar, Basham, Allam, Varghese, Mor, Feng, Paulose, Seabold, Choi and Grimes21–Reference Lin, Yu and Chien24 (viii) the “oriented attachment” mechanism for nanoparticles,Reference Penn and Banfield25, Reference Banfield, Welch, Zhang, Ebert and Penn26 (ix) electrospun nanorods,Reference Fujihara, Kumar, Jose, Ramakrishna and Uchida27 (x) utilization of supercritical carbon dioxide,Reference Lucky, Medina-Gonzalez and Charpentier28 and (xi) synthesis of high-purity anatase TiO2 single crystals with a large percentage of reactive {001} facets.Reference Yang, Sun, Qiao, Zou, Liu, Smith, Cheng and Lu29, Reference Yang, Liu, Qiao, Sun, Jin, Smith, Zou, Cheng and Lu30 On the basis of the above strategies, a number of methods have been developed to control the shape of nanocrystals.
Titanium dioxide has great potential for effective utilization of solar energy with photovoltaicsReference Grätzel32–Reference Bessho, Zakeeruddin, Yeh, Diau and Grätzel38 and water splitting devices,Reference Fujishima and Honda39, Reference Kudo and Miseki40 which will help to ease the energy crisis significantly and provide the most promising material for electrodes of dye-sensitized solar cells (DSSCs). It is very important to control the shape of nanosize titania materials to achieve the desired properties for high efficiency. Recently, noticeable progress was reported in the field of shape control as described above. Yang et al. achieved the synthesis of high-purity anatase TiO2 single crystals with reactive {101} facets by using hydrofluoric acid as a capping agent and also reported a solvothermal method to synthesize high-quality anatase TiO2 single-crystal nanosheets.Reference Yang, Sun, Qiao, Zou, Liu, Smith, Cheng and Lu29, Reference Yang, Liu, Qiao, Sun, Jin, Smith, Zou, Cheng and Lu30 The high reactivity of {001} facets makes these single crystals highly photocatalytically active. Their work is to fabricate crystals with a large percentage of {001} facets, but unfortunately not to achieve shape control of single anatase TiO2 crystals with {101} facets, which is desirable for DSSCs. Titania nanotube arraysReference Shankar, Basham, Allam, Varghese, Mor, Feng, Paulose, Seabold, Choi and Grimes21–Reference Lin, Yu and Chien24 and electrospun nanorodsReference Fujihara, Kumar, Jose, Ramakrishna and Uchida27 are not single crystals, but polycrystals, resulting in the existence of a grain boundary, causing electron traps. Lucky et al. showed that ZrO2-modified TiO2 nanorods and tubular structures were successfully synthesized via a surfactant-free sol–gel route using supercritical carbon dioxide, which provides higher solvating power and increased supersaturation levels, leading to smaller particles and higher particle growth reactions.Reference Lucky, Medina-Gonzalez and Charpentier28 Their aim is to synthesize an appropriate catalyst. Tumcharern et al. reported that the composite of TiO2–multiwalled carbon nanotubes contributes to a significant improvement in the energy-conversion efficiency of DSSCs.Reference Sawatsuk, Chindaduang, Sae-kung, Pratontep and Tumcharern35 They achieved 10.29% power conversion efficiency, indicating that highly conductive materials mixed with TiO2 nanoparticles can improve power conversion efficiency significantly. To create an ideal electrode of DSSCs, high crystallinity to facilitate the migration of electrons/holes, together with a large surface area for photoreactions and a suitable band structure are important. We have synthesized highly crystallized nanoscale one-dimensional titania materials such as a network structure of titania nanowiresReference Adachi, Murata, Takao, Jiu, Sakamoto and Wang41 and titania nanorods,Reference Jiu, Isoda, Wang and Adachi42 which were confirmed to result in highly efficient DSSCs.Reference Kurata, Mori, Isoda, Jiu, Tsuchiya, Uchida and Adachi43–Reference Adachi, Jiu, Isoda, Mori and Uchida45
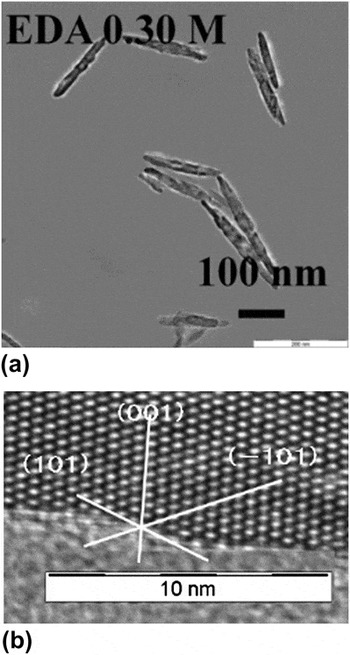
The images of high-resolution transmission electron microscopy (HRTEM)Reference Kurata, Mori, Isoda, Jiu, Tsuchiya, Uchida and Adachi43, Reference Yoshida, Jiu, Nagamatsu, Nemoto, Kurata, Adachi and Isoda46 showed extremely high crystalline features of nanorods, as shown in Fig. 1. A highly magnified HRTEM image [Fig. 1(b)] demonstrates the well-regulated alignment of titanium atoms in the crystalline anatase structure with almost no lattice defects. The TiO2 anatase (101) face, (−101) face, and (001) face are clearly observed. The longitudinal direction of the nanorod is along the c-direction, and the lattice spacing of 0.35 nm for the {101} plane and that of 0.95 nm for the (001) plane agree quite well with the corresponding values recorded in JCPDS. Therefore, the electron transport rate in titania nanorods is expected to be very rapid, producing highly efficient DSSCs by using titania nanorods as materials for electrodes. So far we have achieved power conversion efficiency ranging from 8.52Reference Kurata, Mori, Isoda, Jiu, Tsuchiya, Uchida and Adachi43 to 8.93%Reference Yoshida, Jiu, Nagamatsu, Nemoto, Kurata, Adachi and Isoda46 using these nanorods as DSSC electrodes. Synthesis of highly crystallized nanorods with the well-regulated alignment of titanium atoms as shown in Fig. 1 is very rare, although many advanced synthetic methods have been reported. To realize further improvement of conversion efficiency, we investigated how to control the shape and size of these nanorods, which maintained their extremely high crystalline features after changing in shape and size. To control the size and shape of nanorods, we first investigated their formation process under the most suitable condition for making nanorods, called the “standard condition” hereafter, the results of which were detailed in a previous article.Reference Kurata, Mori, Isoda, Jiu, Tsuchiya, Uchida and Adachi43
(a) Highly dispersed titania nanorods obtained with the help of acetylacetone and (b) highly crystallized features of the nanorods demonstrated by high-resolution transmission electron microscopy (HRTEM) image.

In this article, we present the effects of both the concentrations of reactants, especially ethylenediamine (EDA), and the temperature change on the formation processes of nanorods, together with the reported results under the standard condition. In particular, size and shape control of highly crystallized titania nanorods was proposed and carried out based on the findings from the studies of the formation mechanism.
II. EXPERIMENTAL
The experimental procedure under the standard condition was described in detail in our previous articles.Reference Jiu, Isoda, Wang and Adachi42, Reference Kurata, Mori, Isoda, Jiu, Tsuchiya, Uchida and Adachi43 Here, we summarize the essential part of the standard procedure and describe the modifications. First, a 10 wt% aqueous solution of block copolymer F127 [(PEO)106-(PPO)70-(PEO)106] was prepared using deionized pure water (Millipore Milli-Q, Billerica, MA). Cetyltrimethylammonium bromide (CTAB) was dissolved in F127 solution at 308 K at a fixed concentration of CTAB, 0.055 M. In some modifications, synthesis was carried out without CTAB. EDA was added as a basic catalyst and also as a shape director.Reference Sugimoto, Zhou and Muramatsu47 The concentration of EDA was 0.25 M in the standard condition; in modified conditions, the EDA concentration was varied from 0 to 0.5 M to examine its effects. After a transparent solution was obtained, tetra-isopropyl orthotitanate (TIPT; 0.25 M) was added to the solution with stirring. This solution was stirred for half a day in the standard condition. The solution, including white precipitates obtained by hydrolysis and condensation reactions of TIPT, was then transferred to a Teflon autoclave sealed with a stainless steel lid and reacted at 433 K for the desired period. In modified cases, the reaction temperature was varied from 413 to 433 K to investigate its effects on the reaction mechanism. When acetylacetone (acac) was used to modify TIPT by binding acac to the Ti atom of TIPT, transparent solutions were obtained after 1-week stirring before the hydrothermal reaction. The reaction product obtained under hydrothermal conditions at the desired time was washed with isopropyl alcohol and deionized pure water, followed by separating the reaction product by centrifugation (Kokusan H-40F Shizuoka, Japan). After washing, the obtained sample was dried in a vacuum for 24 h (EYELA Vacuum Oven VOS-450-SD, Tokyo, Japan). To observe variations in the shape and crystalline structure of reaction products upon calcination, the obtained sample was also calcined at 723 K for 2 h.
The reaction products were characterized by x-ray diffraction (XRD) (Rigaku goniometer RINT 2500, Tokyo, Japan), transmission electron microscopy (TEM) and HRTEM (JEOL 200CX and JEOL JEM-2100F, Tokyo, Japan), and scanning electron microscopy (SEM) (JEOL JSM-7500FA).
III. RESULTS AND DISCUSSION
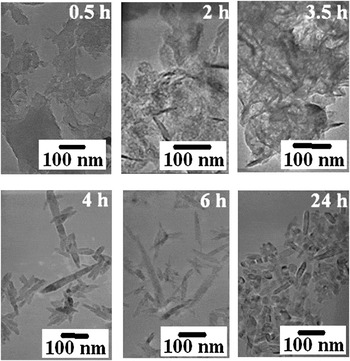
First, the formation processes under the standard condition are briefly described before comparing the experimental results and discussing the effects of various modifications under modified conditions. Typical TEM images of reaction products at 0.5, 2, 3.5, 4, 6, and 24 h under the standard conditionReference Kurata, Mori, Isoda, Jiu, Tsuchiya, Uchida and Adachi43 are shown in Fig. 2. At 0.5 h, only a film-like structure was observed. At 2 h, the shape of reaction products was still mostly film like, while some deep black wedge-shaped structure partly appeared. At 3.5 h, the main structure was still film like, with uneven light and dark patches observed. At 4 h, however, only rod-shaped products were observable, indicating clearly that the film-like shape with an amorphous-like structure changed to nanorod-shaped titania with a clear anatase phase between 3.5 and 4 h. After 6 h, only the nanorod shape was observed. The morphology changed very slowly with time after 6 h.
Transmission electron microscopy (TEM) images of reaction products at 0.5, 2, 3.5, 4, 6, and 24 h under standard condition.Reference Kurata, Mori, Isoda, Jiu, Tsuchiya, Uchida and Adachi43

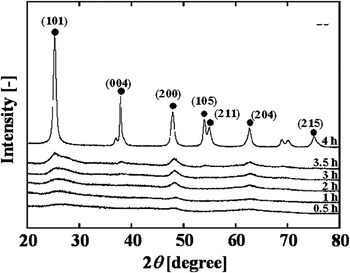
Figure 3 shows the variation in XRD spectra from 0.5 to 4 h under the standard condition,Reference Kurata, Mori, Isoda, Jiu, Tsuchiya, Uchida and Adachi43 i.e., [TIPT] = 0.25 M, [F127] = 10 wt%, [CTAB] = 0.055 M, [EDA] = 0.25 M and 433 K. In the initial stage of reaction, XRD spectra showed almost no clear peak, indicating that the TiO2 formed was amorphous. From 2 to 3.5 h, tiny and broad anatase peaks appeared, but the main structure of titania was still amorphous like. During 3.5 to 4 h, a drastic change in the XRD spectrum was detected, signifying the evolution from an amorphous-like to clear anatase crystalline structure. From 4 to 24 h, XRD spectra showed no appreciable changes.
Variation in x-ray diffraction (XRD) spectra of reaction products from 0.5 to 4 h under standard condition.Reference Kurata, Mori, Isoda, Jiu, Tsuchiya, Uchida and Adachi43

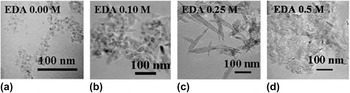
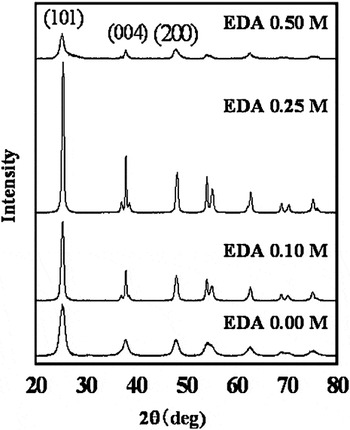
Figure 4 shows the effects of EDA concentration on the shape of reaction products under 433 K for 6 h. As the concentration reached 0.25 M (i.e., the value used under the standard condition, and thus as expected), only nanorods were observed to form, whereas at an EDA concentration as high as 0.5 M, the observed products were unexpectedly film-like titanate. The corresponding XRD spectra for the given series of samples are shown in Fig. 5. When the EDA concentration was 0 M, typical anatase peaks were obtained where the (004) peak was lower than the (200) peak, indicating the spherical shape observed in Fig. 4(a). When the EDA concentration was 0.25 M, a clear anatase spectrum was observed with a higher (004) peak in comparison to the (200) peak, signifying the formation of titania nanorods. For [EDA] = 0.1 M, an intermediate spectrum between those of 0 and 0.25 M was observed due to the formation of a particle–rod mixture, as discussed above [see Fig. 4(b)]. When [EDA] = 0.5 M, a weak amorphous-like spectrum was obtained, corresponding to the observation of a film-like structure in Fig. 4(d). These results signify that there should be an optimum EDA concentration for controlling the formation rate of titania nanorods at ≈0.25 M, above which, specifically at as high as 0.5 M, the reaction rate tends to slow down; that is, the morphological transition is delayed. Such inference could be made by referring to the morphology transformation as depicted in Fig. 2 under the standard condition with [EDA] = 0.25 M.
TEM images of reaction products synthesized at different ethylenediamine (EDA) concentrations by hydrothermal method. Reaction conditions: 433 K, 6 h.

XRD spectra of the same samples shown in Fig. 4.

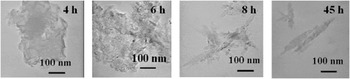
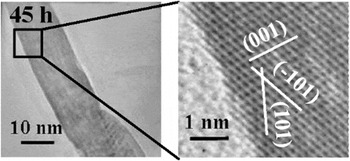
To further investigate the formation processes of titania nanorods at this high EDA concentration of 0.5 M, we carried out a series of experiments to evaluate the time course of the formation process; the results are shown in Fig. 6. A film-like structure was observed up to 6 h, as stated above; after 8 h, however, only a rod shape was identifiable, signifying that the transformation from the amorphous film-like structure to the anatase titania nanorods has been almost completed by this time. Figure 7 shows TEM and HRTEM images of the reaction product obtained at 45 h. Since the ordered alignment of titania atoms in the anatase structure could be clearly seen, we recognized that highly crystallized titania anatase nanorods were formed.
TEM images of reaction products obtained at different reaction times for [EDA] = 0.5 M. The remaining reaction conditions were the same as in the standard condition.

TEM and HRTEM images of reaction product obtained at 45 h under [EDA] = 0.5 M.

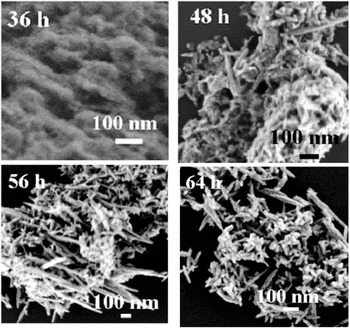
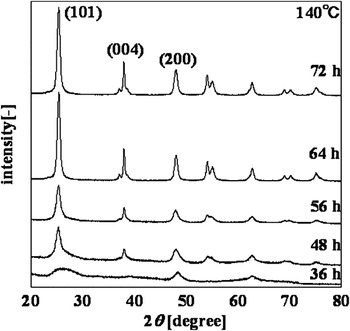
The effect of temperature reduction was examined by obtaining the time course of the formation processes at 413 K based on SEM images and XRD measurements; the results are shown in Figs. 8 and 9, respectively. As shown in Fig. 8, the film-like structure was still observed even at 36 h. The XRD spectrum obtained at 36 h shows no significant peaks, i.e., amorphous-like phase formation, which was observed under the standard condition only up to 3.5 h (see Fig. 3); therefore, the reaction rate at 413 K became significantly slower. From SEM images, coexistence of titania nanorods and film was observed until 56 h, which was never recognized at the standard reaction temperature of 433 K. Only titania nanorods were finally observed after 64 h. SEM images obtained at 64 h show a wide distribution in the length of nanorods from roughly 10 to 600 nm, implying that the nucleation and growth of nanorods proceed concurrently because of the slow reaction rate at 413 K. The XRD spectrum at 48 h, on the other hand, shows anatase peaks, although each peak is not high. Peak height increased gradually with time up to 64 h. This observation suggests again the coexistence of amorphous-like films and titania nanorods. The peak becomes higher with an increase in the fraction of titania nanorods up to 64 h.
Scanning electron microscopy (SEM) images of reaction products obtained under the condition of 413 K at various times.

XRD patterns of the same reaction products in Fig. 8.

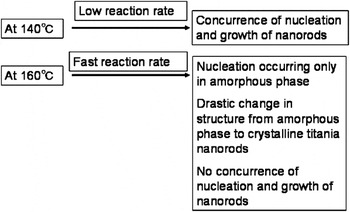
The observations and measurements made on temperature change described above are summarized in Fig. 10. At 413 K, the reaction rate is low, resulting in the concurrent nucleation and growth of nanorods. At 433 K, on the other hand, the reaction occurs rapidly, resulting in (i) the prevalence of nucleation almost exclusively in the amorphous phase in the early reaction stage, (ii) a drastic change from the amorphous phase to crystalline titania anatase nanorods, and (iii) no concurrence of nucleation and growth of nanorods. These findings give some suggestions for strategies for size and shape control.
Effects of temperature on the characteristics of formation processes at 413 and 433 K.

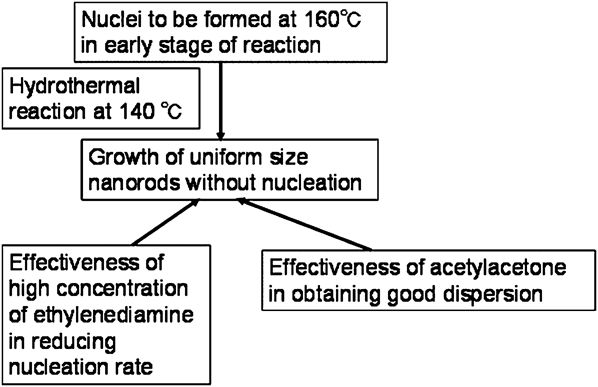
The proposed strategy is given in Fig. 11. Nuclei should be generated at a higher temperature of 433 K in the early stage of reaction. Nuclei forming coincidently should be reacted at a reduced temperature of 413 K under hydrothermal conditions without further nucleation. Then, growth of nanorods with rather uniform size and shape is expected with the aid of a high concentration of EDA to effectively reduce their nucleation rate. In addition, the effectiveness of acac in obtaining good dispersion of nanorods can be used, as mentioned later.
Strategy for size and shape control of titania nanorods.
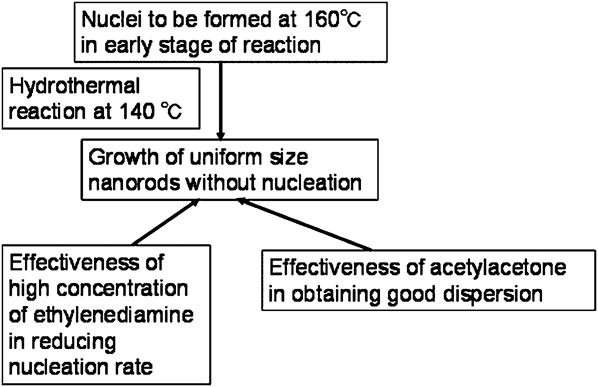
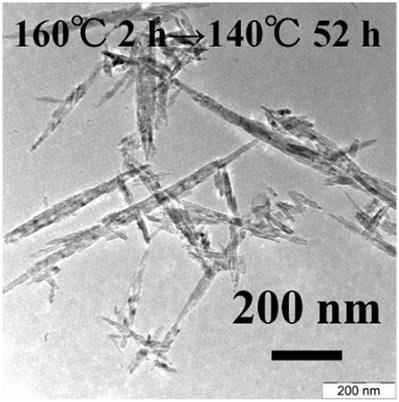
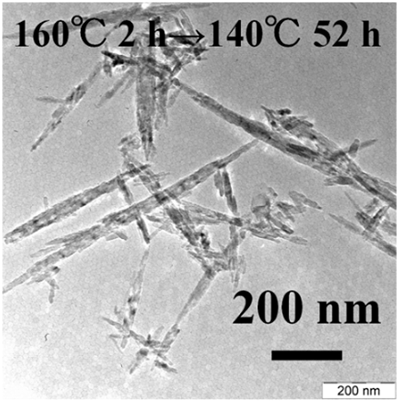
The specific preparation procedures were as follows. The even formation of nuclei was attempted at 433 K under the standard condition via the hydrothermal reaction for 2 h before being cooled down to room temperature. EDA was then added at a concentration of 0.5 M to selectively reduce the nucleation rate. A formation reaction with these precursory nuclei was successively carried out at 413 K under hydrothermal conditions for 52 h; the reaction conditions were as follows: 0.25 M TIPT, 0.055 M CTAB, 10 wt% F127, and 0.5 M EDA. A TEM image of the obtained nanorods is shown in Fig. 12. At over 800 nm, long, high aspect ratio nanorods were obtained. In comparison to the nanorod images at 433 K at 24 h shown in Fig. 2 and at 413 K at 64 h in Fig. 8, the nanorods obtained based on the proposed shape control strategy were improved, despite the presence of some shorter nanorods, which stem from the not completely avoidable occurrence of nucleation during the formation reaction.
TEM image of shape-controlled nanorods prepared based on the strategy given in Fig. 11.
The effect of the addition of acac was examined separately. In the experiments, the same moles of acac and TIPT were mixed to make a 1:1 complex. The complex was added to an aqueous solution of 10 wt% F127 containing 0.3–0.5 M EDA but no CTAB. The solution was stirred for 1 week at room temperature. The solution became transparent after 1 week of stirring, which was never observed in the absence of acac. Adding acac must therefore have a critical effect on dispersion. An example of the nanorods thus obtained is shown in Fig. 1 (top) under the condition of 0.3 M EDA. Very good dispersion of titania nanorods was achieved, and the highly crystallized state was apparent, as demonstrated in the high-resolution image in Fig. 1 (bottom). Since acac is known to adsorb onto the surface of titania anatase crystals,Reference Connor, Dobson and McQuillan48 adsorbed acac molecules could prevent the aggregation of titania nanorods, resulting in such good dispersion. Also, since acac is expected to affect the formation mechanism, utilization of acac might improve the shape control method of nanorods.
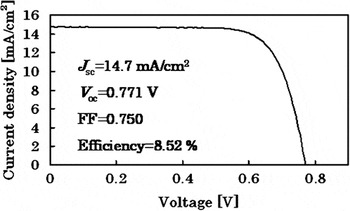
The application of highly crystallized titania nanorods for making DSSCs has already been reported.Reference Kurata, Mori, Isoda, Jiu, Tsuchiya, Uchida and Adachi43, Reference Yoshida, Jiu, Nagamatsu, Nemoto, Kurata, Adachi and Isoda46 A titania electrode made of titania nanorods was successfully fabricated as follows. Complex electrodes were prepared by the repetitive coating–calcining process: three layers of titania nanoparticlesReference Jiu, Wang, Sakamoto, Takao and Adachi49, Reference Jiu, Isoda, Adachi and Wang50 were first coated on fluorine-doped tin oxide (FTO) conducting glass, followed by seven layers of mixed gel composed of titania nanorods and P-25. High light-to-electricity conversion efficiencies of 8.52–8.93% were achieved, as exemplified in Fig. 13. We are now trying to achieve much higher power conversion efficiency by utilizing shape-controlled highly crystallized titania nanorods with high dispersion as titania electrodes of DSSCs.
I–V curve for complex dye-sensitized solar cell (DSSC) electrode consisting of highly crystallized titania nanorods, P-25, and titania nanoparticles.

IV. CONCLUSIONS
The size and shape control of highly crystallized titania nanorods were investigated based on the effects of both the concentration of EDA and the reaction temperature on the formation mechanism.
(1) EDA had a role in changing the shape from titania spherical particles to nanorods. The reaction to form nanorods became slower at higher EDA concentration, i.e., [EDA] >0.5 M, because of restricted nucleus formation.
(2) Temperature reduction from 433 to 413 K slowed down the reaction rate greatly. Quite different formation processes of titania nanorods were observed at 413 K in comparison with those at 433 K: (i) coexistence of amorphous-like films and crystalline titania nanorods and (ii) concurrent proceeding of nucleation and particle growth.
(3) Long and high aspect ratio titania nanorods were synthesized using the strategy of shape control based on the findings mentioned above, i.e., nuclei formation in the early stage of reaction at 433 K and hydrothermal reaction at 413 K under [EDA] = 0.5 M.