The term ‘Affective Disorders’ is used for a group of mental diseases with a primary disturbance of affect from which all the other symptoms (are) . . . derived . . . . The illness has a secondary characteristic: periodicity. In typical cases, . . . depression of mood alternates with free intervals in which there is a complete return to the normal [(Mayer-Gross et al., Reference Mayer-Gross, Slater and Roth1954) p. 187].
The focus of research in the genetics of major depression (MD) has shifted in recent years from genetic-epidemiological to molecular genetic designs. As the sample size requirements for genome-wide association or sequencing studies of complex psychiatric disorders like MD have become clearer (Sullivan et al., Reference Sullivan, Agrawal, Bulik, Andreassen, Borglum, Breen, Cichon, Edenberg, Faraone, Gelernter, Mathews, Nievergelt, Smoller and O'Donovan2018), questions have arisen about the utility of proxies for the interview-based assessment of lifetime MD that could be collected more cheaply and expeditiously in very large samples. Two such potential proxies are current depressive symptoms and the personality trait of Neuroticism (Eysenck, Reference Eysenck1953; Major Depressive Disorder Working Group of the Psychiatric GWAS Consortium et al., Reference Wray and Sullivan2018). Both of these measures can be easily collected by self-report and have been shown to be substantially correlated with each other and with a clinical diagnosis of MD in a range of samples (Boyd et al., Reference Boyd, Weissman, Thompson and Myers1982; Hirschfeld et al., Reference Hirschfeld, Klerman, Clayton and Keller1983; Jardine et al., Reference Jardine, Martin and Henderson1984; Bech et al., Reference Bech, Jorgensen, Jeppesen, Loldrup and Vanggaard1986; Fergusson et al., Reference Fergusson, Horwood and Lawton1989; Kendler et al., Reference Kendler, Neale, Kessler, Heath and Eaves1993; Major Depressive Disorder Working Group of the Psychiatric GWAS Consortium et al., Reference Wray and Sullivan2018). For genetic studies, however, the question is not the degree of phenotypic resemblance but rather the degree to which these measures reflect genetic risk factors for MD. Prior twin and molecular genetic studies have suggested modest to moderate genetic correlations between lifetime MD and neuroticism (Kendler et al., Reference Kendler, Gatz, Gardner and Pedersen2006; Kendler and Myers, Reference Kendler and Myers2010; Lo et al., Reference Lo, Hinds, Tung, Franz, Fan, Wang, Smeland, Schork, Holland, Kauppi, Sanyal, Escott-Price, Smith, O'Donovan, Stefansson, Bjornsdottir, Thorgeirsson, Stefansson, McEvoy, Dale, Andreassen and Chen2017) and current self-report depressive symptoms (Foley et al., Reference Foley, Neale and Kendler2001).
Both depressive symptoms and Neuroticism are measures of negative affect which have been central to the concept of MD since its articulation as a distinct psychiatric disorder in the 19th century (Berrios, Reference Berrios and Paykel1982, Reference Berrios, Georgotas and Cancro1988; Jackson, Reference Jackson1986). However, as pointed out in the quote above (Mayer-Gross et al., Reference Mayer-Gross, Slater and Roth1954), MD has another critical dimension – its periodicity – which was central to Emil Kraepelin's concept of manic-depressive illness from which our concept of MD derives (Kraepelin, Reference Kraepelin and Quen1990; Trede et al., Reference Trede, Salvatore, Baethge, Gerhard, Maggini and Baldessarini2005) and is not well captured by these self-report measures. If the genetic predisposition to experience periodic mood states (and the associated neuro-vegetative and cognitive changes) is not identical to the more generic vulnerability of negative affect, these self-report measures will not capture the full spectrum of genetic risk for MD.
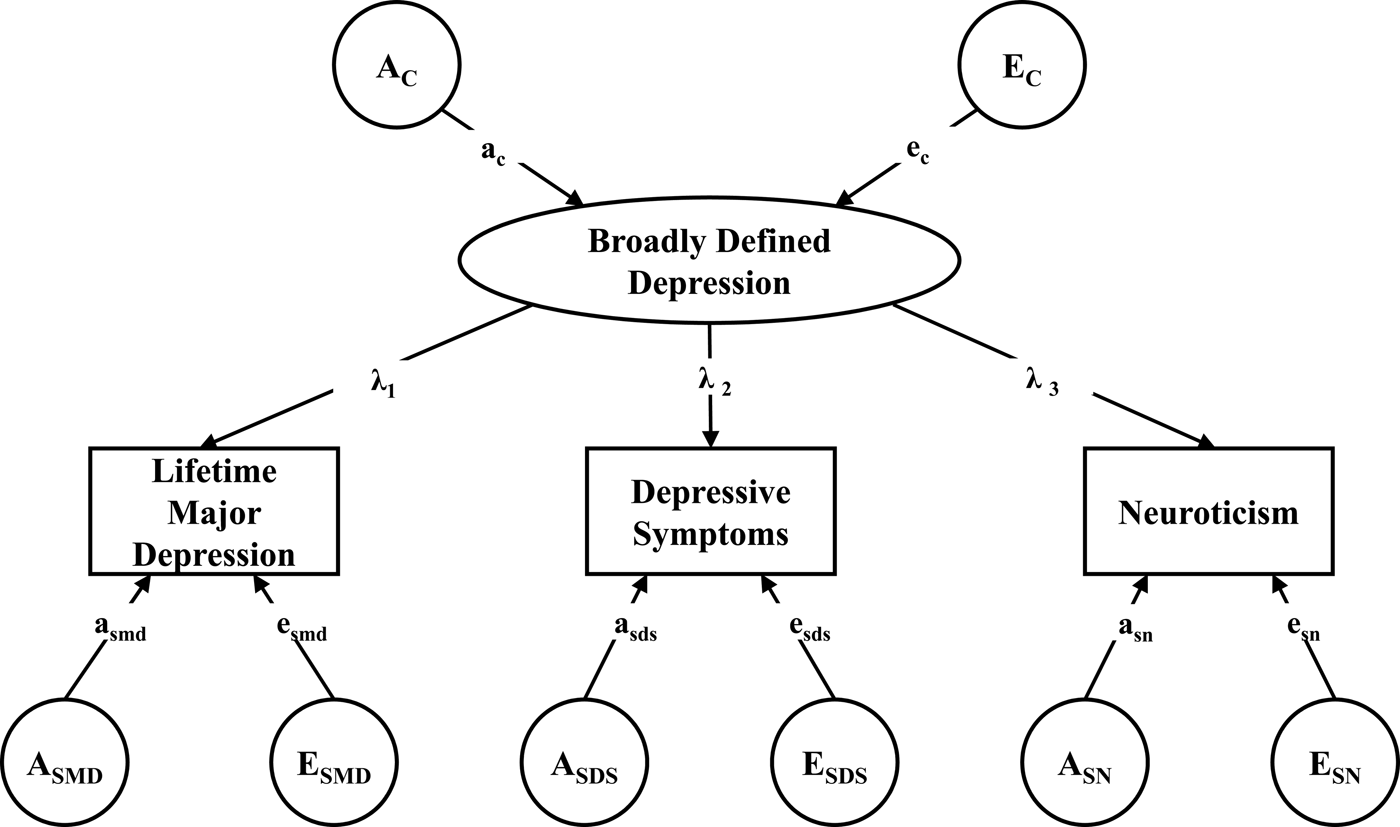
In this paper, we address this question using three large population-based twin samples in which lifetime MD was assessed at personal interview along with self-report levels of current depressive symptoms and Neuroticism assessed by self-report. The model that we employ (Fig. 1) assumes a latent liability to ‘Broadly Defined Depression’ which is in turn indexed by three measures: lifetime MD, depressive symptoms and Neuroticism. Results of this model permit us to decompose the sources of genetic and environmental risk for these three indices into those that arise from the shared latent liability to broad depression v. those specific to the individual measures. Our focus here is on the results for MD, that is the degree to which genetic risk factors for MD result from genetic effects specific to MD v. from genetic risk factors reflecting broad defined depression.
A Common Pathway Model Depicting the Genetic and Environmental Relationship between ‘Broadly Defined Depression’ and measures of life-time major depression (MD), self-report depressive symptoms (DS) and self-report Neuroticism (SN). Capital ‘A’ and ‘E’ reflect additive genetic and unique environmental effects, respectively. The subscript ‘C’ reflects the common factor and ‘S’ the phenotype specific effects. So EC refers to the unique environmental effect for the negative affect common factor while ASMD refers to the genetic effect specific to MD. Lower-case ‘a’ and ‘e’ refer to the path coefficients (standardized regression coefficients) that reflect genetic and unique environmental effects. The lambda paths (λ) reflect the loadings of major depression, self-report DS and SN on the common factor of negative affect.

Methods
Samples
Virginia participants derived from two inter-related samples of Caucasian same-sex twin pairs who participated in the Virginia Adult Twin Study of Psychiatric and Substance Use Disorders. As detailed elsewhere (Kendler and Prescott, Reference Kendler and Prescott2006), subjects were ascertained from the population-based Virginia Twin Registry. Cohort 1 included same-sex female–female twin pairs born 1934–1974, who were eligible if both members responded to a mailed questionnaire in 1987–1988. This cohort was interviewed 4 times in person or by telephone from 1987 to 1997, with cooperation rates ranging from 85 to 93%. In this paper, we utilized data from waves 1 and 3 when the mean (s.d.) ages of female twins were, respectively, 30.1 (7.6) and 35.1 (7.5). Cohort 2 consisted of male–male/male–female pairs (birth years 1940–1974) ascertained directly from registry records. In these analyses, we only utilize the male–male pairs from this cohort. The first interview was completed largely by phone in 1993–1996 and was followed by the 2nd wave of interviews conducted largely face to face in 1994–1998, with a response rate of 83%. For the two waves of the male–male twin sample, the mean ages were 35.5 (9.1) and 37.0 (9.1), respectively.
Informed consent was obtained prior to all personal interviews and assent prior to all phone interviews. The study was approved by the Virginia Commonwealth University IRB. Zygosity was determined by discriminate function analyses using standard twin questions validated against DNA genotyping in 496 pairs with a predicted error rate of under 2% (Kendler and Prescott, Reference Kendler and Prescott1999).
We studied two cohorts from the volunteer-based Australian Twin Registry (ATR). Cohort 1 comprises data collected between 1988 and 1992 targeting all adult twin pairs born between 1893 and 1964 [age 41.2 9 (12.8), 61.0% females] (2) who had completed an earlier survey between 1980 and 1982. A small number of Cohort 1 twin pairs (N = 236) were not surveyed between 1988 and 1992 because their information was partially missing in the 1980–1982 survey. These twins were subsequently surveyed between 1990 and 1992 using the same questionnaire. Cohort 2 comprises data collected between 1990 and 1992 (N = 3646) targeting younger adult twins born between 1964 and 1971 [age 23.2 (2.2), 65.6% females]. In these analyses, as with the Virginia sample, we only included same-sex pairs from the Australian cohorts.
This ATR study was approved by the Queensland Institute of Medical Research Human Research Ethics Committee and the storage of the data follows national regulations regarding personal data protection. All participants provided informed consent. Lifetime Diagnostic and Statistical Manual (DSM)-IV major depressive disorder diagnoses were obtained from the two adult cohorts in two telephone interview follow-up studies conducted in 1992–1993 and 1996–2000, respectively (Judd, Reference Judd1997). Zygosity of twins was decided based on standard questions and validated against DNA testing with a predicted error rate of under 5% (Martin and Martin, Reference Martin and Martin1975; Ooki et al., Reference Ooki, Yamada, Asaka and Hayakawa1990).
Assessments
Neuroticism was assessed in all samples by Eysenck's short-form scale (Eysenck et al., Reference Eysenck, Eysenck and Barrett1985). Current depressive symptoms were assessed ‘over the last 30 days’ by 10 items from the depression subscale of the symptom checklist (SCL) 90 (Derogatis et al., Reference Derogatis, Lipman and Covi1973) in the Virginia Sample and ‘recently’ in the Australian samples by combining seven depression items from the Delusions-Symptoms-States Inventory (Foulds and Bedford, Reference Foulds and Bedford1975; Bedford and Deary, Reference Bedford and Deary1997) with five depression items from the SCL-90 (Eysenck et al., Reference Eysenck, Eysenck and Barrett1985). In all samples, binary diagnoses of lifetime MD were subsequently assessed by phone interview utilizing DSM-IV criteria. In the Virginia sample, interviewers were trained mental health professionals (psychiatric social workers and psychologists) utilizing a modified structured clinical interview (Spitzer and Williams, Reference Spitzer and Williams1985), while in the Australia sample, they were trained lay interviewers utilizing the Semi-Structured Assessment for the Genetics of Alcoholism [SSAGA42 (Wender et al., Reference Wender, Kety, Rosenthal, Schulsinger, Ortmann and Lunde1986)]. Interviews were conducted blind to cotwin status.
To avoid occasion-specific measurement biases, depressive symptoms and Neuroticism were measured at a different time than lifetime MD, separated by at least 1 and 2 years in the Virginia and Australian samples, respectively.
Statistical analysis
For structural equation modeling, lifetime history of MD was a binary variable while Neuroticism and depression symptom scores were converted to three level ordinal variables. Arbitrary cut-offs were applied separately by sample and sex to generate approximately equal sample sizes in the three ordinal categories. To maximize comparability across our three samples, we required that each member of a twin pair to be included in the analysis had to have at least one non-missing variable.
The final Virginia sample for analysis included 503 monozygotic female pairs, 347 dizygotic female pairs, 847 monozygotic male pairs, and 639 dizygotic male pairs. Thus, there were 1700 females, mean age (s.d.) of 29.9 (7.5) at FF1 and 35.0 (7.5) at FF3, and 2972 males, mean age 35.3 (9.2) at MF1 and 36.8 (9.1) at MF2.
The Australian sample 1 included 818 monozygotic female pairs, 462 dizygotic female pairs, 336 male monozygotic pairs, and 183 dizygotic male pairs. The mean age for 2560 females was 43.2 (14.4) and for the 1038 males 39.8 (12.6). The Australian sample 2 included 373 monozygotic female pairs, 253 dizygotic female pairs, 185 male monozygotic pairs, and 128 dizygotic male pairs. The mean age for both the 1252 females and 626 males were 23.2 (2.1).
Mx was used to obtain maximum likelihood estimates of the parameters of a common factor twin model, which assumes a common latent variable for lifetime MD, depression symptoms, and Neuroticism phenotypes having a genetic component (AC), a shared environment component (CC), and an environmental component unique to each twin (EC), where the subscript ‘c’ stands for ‘common’ (Neale et al., Reference Neale, Boker, Xie and Maes2003). Furthermore, the variance specific to each of our variables were also partitioned into A, C, and E components labeled as (AS), a shared environment component (CS), and an environmental component unique to each twin (ES), where the subscript ‘s’ stands for ‘specific.’ Three models were fitted, a full ACE model where all parameters were estimated, an AE model where all C paths were fixed at 0 and a CE model where all A paths were fixed to zero. From the best fit model, we then estimated the heritability of each phenotype as well as the proportion of the heritability for each phenotype that was shared v. not shared with the common factor. The best-fitting model, which reflected the optimal balance of complexity and explanatory power, was chosen by Akaike's Information Criterion (AIC) (Akaike, Reference Akaike1987). Likelihood-based confidence intervals were obtained using the procedure described by Neale and Miller (Reference Neale and Miller1997).
A follow-up mega-analysis was conducted to examine the consistency and robustness of the common pathway model parameters across the three samples. A six-group model for MZ and DZ twins was created for this purpose. Separate sex definition variable regression coefficients were specified to moderate the common factor indicator variable means. Since by default all thresholds are expressed as deviations from their respective item mean, a single-sex effect is estimated for all within item thresholds. Four models were fitted and statistically compared. ACE, AE, and CE models were first estimated in the joint model for each sample to determine a ‘best’ fitting model. The parameters of these models were the same as those previously described. The fourth and pivotal model imposes equality constraints on all the key parameters of the model (i.e. common and specific A and E paths and the three psychometric common factor loadings). Comparing this constrained model with one that allows free parameters in each of the samples is a concise test of whether the biometric and psychometric structural effects are statistically equivalent. The freely available OpenMx R package version 2.9.9.1 (Neale et al., Reference Neale, Hunter, Pritikin, Zahery, Brick, Kirkpatrick, Estabrook, Bates, Maes and Boker2016) implemented in the R environment 3.4.1 (R Development Core Team, 2018) was used to obtain parameter estimates using a full information maximum likelihood raw data approach. Model comparisons were evaluated using the difference in the −2 loglikelihood which is asymptotically distributed as chi-square and the difference between fitted model AIC values (Akaike, Reference Akaike1987).
Results
Lifetime prevalence for MD in Virginia, and first and second Australian samples were, respectively, 29.7, 24.5 and 29.0% for MD. Mean Neuroticism in Virginia and first and second Australian samples were, respectively, 3.30 (s.d. = 3.10), 4.43 (s.d. = 3.21), and 5.12 (s.d. = 3.22).
Phenotypic correlations
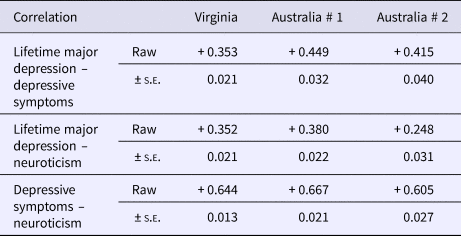
Table 1 shows the phenotypic polychoric correlations between MD, depressive symptoms and Neuroticism in our three samples. Correlations between lifetime MD and current depressive symptoms range from +0.35 to +0.45, while between MD and Neuroticism, the range is +0.25 to +0.38. Correlations between our two quantitative indices of negative affect were much higher and similar for all samples (+0.61 to +0.67).
Phenotypic correlations and standard errors (s.e.) between lifetime major depression, depressive symptoms and neuroticism inVirginia and two Australian twin samples

Common factor model fitting results
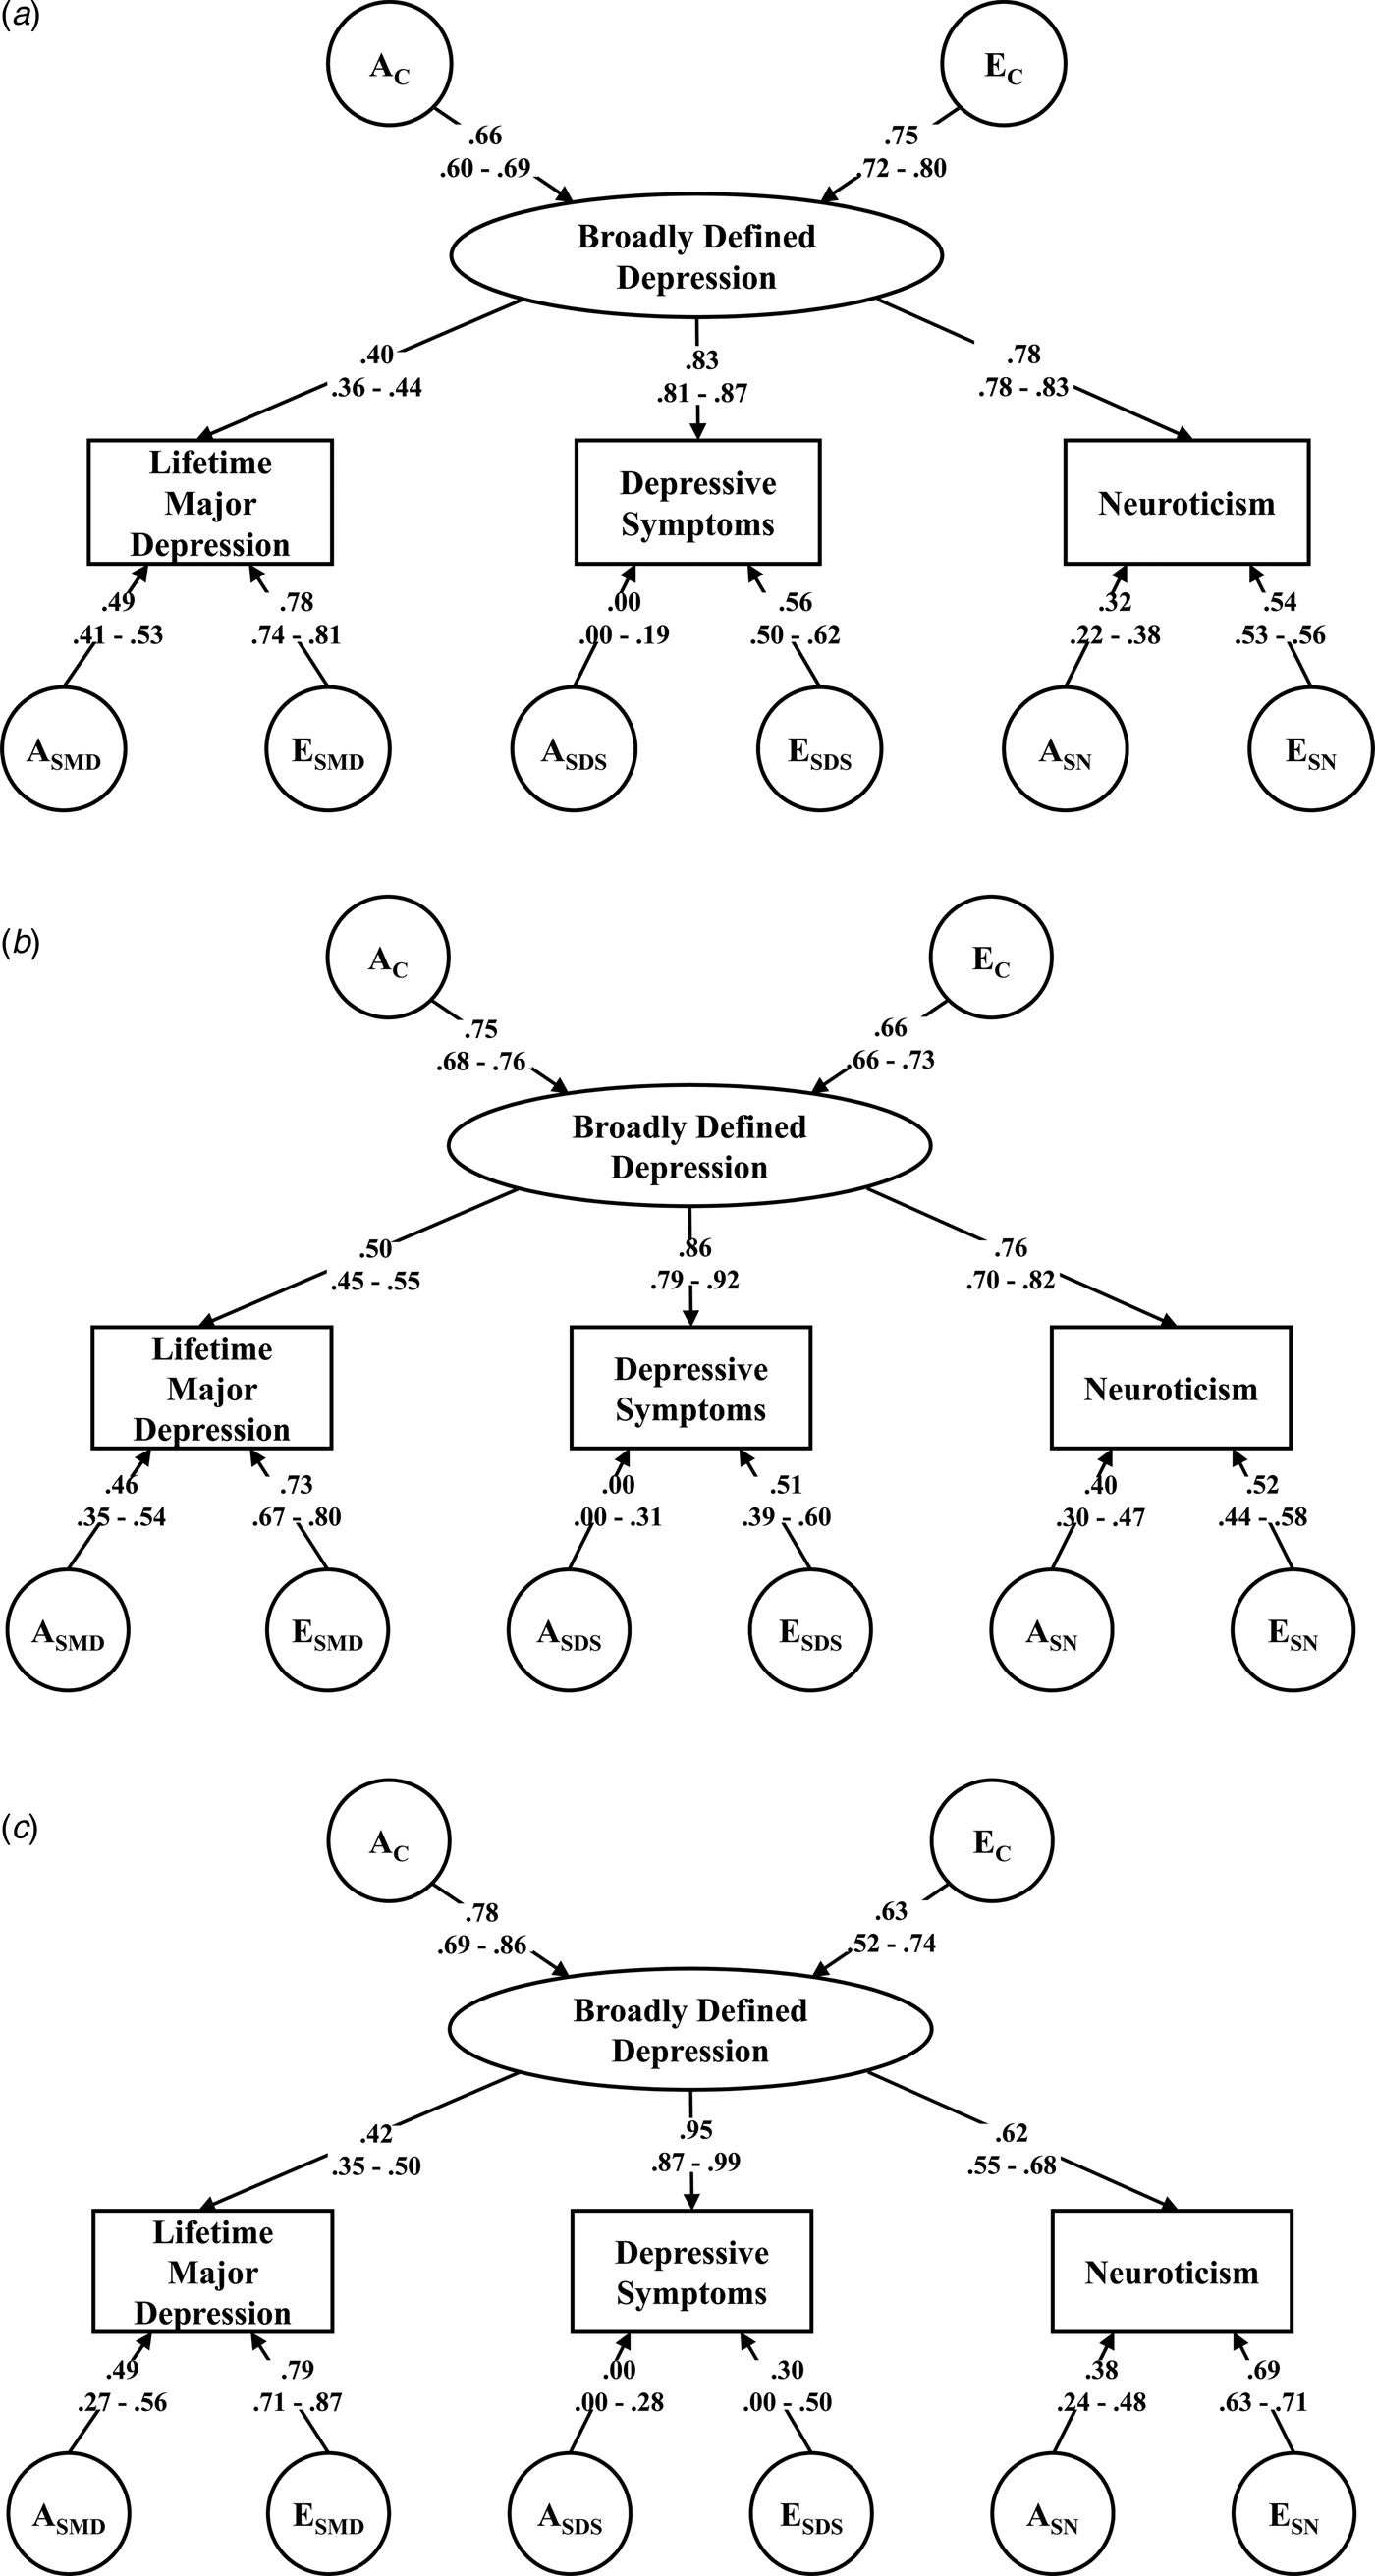
Table 2 shows modeling results for the three samples analyzed separately. Table 3 and Fig. 2a–c illustrate results for the best-fit models. For each sample, the model fit, as indicated by the AIC, was better for the AE than the ACE or CE models. We, therefore, focused on the parameter estimates from the best-fitting AE models.
(a) Parameter Estimates for the Virginia Twin Sample For the Best-Fit AE model with 95% confidence intervals. (b) Parameter Estimates for the First Australian Twin Sample For the Best-Fit AE model with 95% confidence intervals. (c) Parameter Estimates for the Second Australian Twin Sample For the Best-Fit AE model with 95% confidence intervals.

Model fitting results in the three twin samples

LL, log likelihood; df, degrees of freedom; AIC, Akaike's information criterion (Akaike, Reference Akaike1987) – where lower scores indicate an improved balance of explanatory power and parsimony.
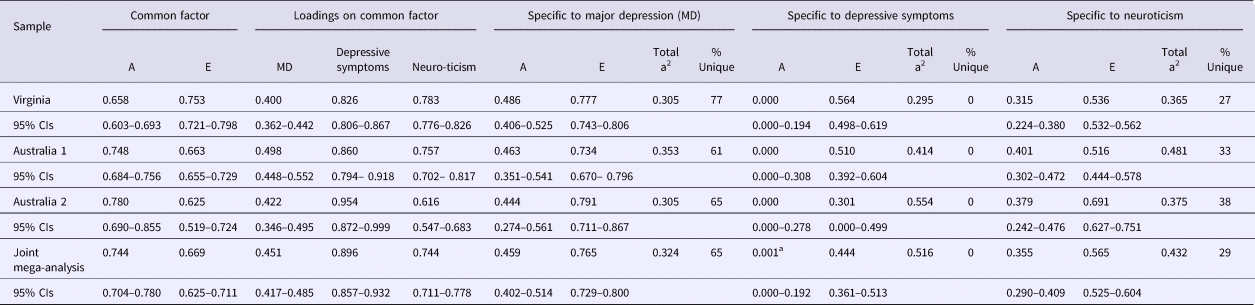
Parameter estimates and likelihood-based 95% confidence intervals (CIs) from best-fit models of the individual twin cohorts and the joint mega-analysis of all three samples

a To obtain stable estimates of this parameter in the joint analyses, parameter estimates had to be constrained to be positive ⩾0.
Starting with the Virginia sample, the common factor of ‘negative affect’ was moderately heritable, with a2 estimated at 0.43. Loadings on this factor were much higher for depressive symptoms (+0.83) and Neuroticism (+0.78) than for MD (+0.40). The reverse pattern was observed for the specific genetic influences, which were considerably stronger for MD (+0.49) than for Neuroticism (+0.32) or for depressive symptoms (+0.00). Total heritability was estimated at 0.37 for Neuroticism, 0.31 for MD and 0.30 for depressive symptoms (Table 3). From the model parameter estimates, the proportion of genetic risk for each of these measures that were unique to that measure could easily be calculated and was much higher for MD (77%) than for Neuroticism (27%) or depressive symptoms (0%) (Table 3).
Overall, the pattern of results was similar in the two Australian samples. Heritability of the common factor was somewhat greater in these two samples, as were the loadings for MD and depressive symptoms on the common factor. By contrast, the loading for Neuroticism was lower. Compared with the results in the Virginia sample, the total heritabilities of MD were similar (35 and 31%, respectively), although depressive symptoms were appreciably more heritable in sample 2, while Neuroticism was more heritable in sample 1. As with the Virginia sample, in the two Australian samples, the measure-specific proportions of heritability were considerably higher for MD (61 and 65%) than for Neuroticism (33 and 38%) or depressive symptoms (both 0%).
Mega-analysis
As seen in Table 4, we first fit our three standard models jointly to all three samples, permitting all path estimates to be independent across samples. As would be expected, the AE model (model # 2) fit best by a considerable margin. In model 4, we then took the AE model and constrained all the path estimates to equality across the three samples. This model had an identical fit to the unconstrained model by AIC criteria. Despite the inter-sample differences in culture, age, interview instruments for assessing MD and scales used to assess depressive symptoms, the resulting parameter estimates of our model were statistically indistinguishable.
Results of a mega-analysis – model-fitting to all three twin samples

We present the parameter estimates from model 4 in the bottom row of Table 3. As expected, nearly all the parameter estimates are in the middle of the range of those estimates from the three individual samples. Across our three studies, we estimated that 65% of the genetic variance for lifetime MD was unique to that disorder and not shared with the broadly defined depression common factor.
Discussion
Our goal was to understand the inter-relationship between the genetic risk factors for lifetime MD assessed at personal interview, and self-reported current depressive symptoms and the personality trait of Neuroticism. We approached this question by postulating a construct of ‘broadly defined depression’ which in turn was indexed by three measures: lifetime MD, depressive symptoms and Neuroticism. The value of this model was that using parameters estimated from standard model-fitting procedures, we could easily divide the proportion of genetic risk for MD into that captured by this construct, and that unique to MD.
Given the importance of these questions in current discussions on approaches to the molecular genetic study of MD, we used three different twin samples to evaluate the generalizability of our findings. We found that our latent construct of ‘broadly defined depression’ was psychometrically sensible, with appreciable loadings on all three of its indices, and moderate heritability estimates ranging from 43 to 61% across our three samples and estimated at 56% in our mega-analysis.
However, across all three samples, the magnitude of the loading on the broadly defined depression common factor was strongest for depressive symptoms, intermediate for Neuroticism and weakest for lifetime MD. The inverse pattern was seen for the estimates for genetic effects specific to these three phenotypes. In all three samples analyzed separately, no specific genetic effects were estimated for depressive symptoms. All its genetic effects were mediated through the common factor. For Neuroticism, across our samples, our model fitting estimated that about one-third of its genetic effects were specific and two-thirds shared with the common factor. By contrast, for MD, in our three studies, between 60 and 75% of the genetic risk factors for interview-based lifetime MD were unique and not captured by the construct of broad depression. Our mega-analysis fit our data well indicating homogeneity of estimation across our samples and estimated that 65% of the genetic risk for MD was unique to that disorder. Put another way, our findings suggested that a study of broadly defined depression should be able to index about a third of the overall genetic risk factors for lifetime MD.
These results can be explained from at least eight non-mutually exclusive perspectives. First, the psychiatric clinical literature has long recognized that many patients are seen who have chronic mild to moderate symptoms of depression and anxiety (and thus score highly on depressive symptom and Neuroticism scales) but never suffer from episodic full depression syndromes. Such individuals were often said to suffer from a ‘depressive personality’ (Chodoff, Reference Chodoff1972; Schneider, Reference Schneider1958) or dysthymia (American Psychiatric Association, 1980). A family study of dysthymia demonstrates a moderately increased familial risk for depression, and specific familial risks for dysthymia and cluster B personality disorders (Riso et al., Reference Riso, Klein, Ferro, Kasch, Pepper, Schwartz and Aronson1996). A population-based Norwegian twin study shows that only 31% of the genetic risk for MD is shared with depressive personality (Orstavik et al., Reference Orstavik, Kendler, Czajkowski, Tambs and Reichborn-Kjennerud2007).
Second, in general, population samples, levels of symptoms of depression and anxiety are strongly and systematically related to the level of recent stress exposure (Amstadter et al., Reference Amstadter, Myers and Kendler2014). At any one time, a considerable proportion of the population will be displaying transient mild depressive symptoms not part of depressive episodes, many of whom likely have only low to moderate genetic risks for MD. We have previously developed a model predicting variance in symptoms of anxiety and depression in a population-based sample of twins (Kendler and Gardner, Reference Kendler and Gardner2011), showing that about half of the variance resulted from being in an episode of depression or anxiety and half did not.
Third, as suggested by our introductory quote, an important part of the genetic risk for MD probably reflects the neurobiological processes underlying its temporally dynamic nature. Individuals with MD develop episodes during which they suffer from often intensely dysphoric mood, and associated cognitive and neuro-vegetative symptoms from which they typically recover within 4–6 months even without treatment (Kendler, Reference Kendler2017), often to have later recurrences. These temporally dynamic features, essential to the clinical concept of MD since the late 19th century (Kraepelin, Reference Kraepelin and Quen1990; Kendler, Reference Kendler2016, Reference Kendler2017), are not assessed in typical self-report depressive symptom inventories (Fried, Reference Fried2016) or in personality measures like Neuroticism.
Fourth, the personality construct of Neuroticism might accurately reflect genetic risk for MD if most individuals after an MD episode had a large and enduring shift upward in the Neuroticism scores. A number of studies have examined this question – whether prior episodes of MD produce a ‘scar’ effect on personality. While a few studies find a small effect (Kendler et al., Reference Kendler, Neale, Kessler, Heath and Eaves1993), most fail to detect such changes (Zeiss and Lewinsohn, Reference Zeiss and Lewinsohn1988; Duggan et al., Reference Duggan, Sham, Lee and Murray1991; Shea et al., Reference Shea, Leon, Mueller, Solomon, Warshaw and Keller1996; Ormel et al., Reference Ormel, Oldehinkel and Vollebergh2004).
Fifth, depressive symptoms could well index the genetic vulnerability to MD if most individuals with MD were in an episode when assessed. How often does that occur? The Virginia sample dated onsets and offsets of MD episodes in the last year from which we calculated that 9% of individuals with lifetime MD in this general population sample were in a depressive episode the day of assessment.
Sixth, item content of typical depressive symptom scales (Fried, Reference Fried2016) and diagnostic criteria for MD do not overlap perfectly. Furthermore, while a DSM diagnosis requires the symptoms to last at least 2 weeks, and trained interviewers will not count symptoms that have other obvious explanations (tiredness due to the flu, sleeping problems due to a sick child, etc.), such qualifications are absent in self-report measures. The relationship between contemporaneous self-report symptoms and clinically-diagnosed MD has been studied using the Center for Epidemiologic Studies-Depression Scale (CES-D) (Radloff, Reference Radloff1977). Using the validated 16-point cut-off for diagnosing a ‘depression’, (Boyd et al., Reference Boyd, Weissman, Thompson and Myers1982) compared the performance of the CES-D scale with a clinical diagnosis of current MD using the Research Diagnostic Criteria (Spitzer et al., Reference Spitzer, Endicott and Robins1975), a criteria set closely related to that used for MD in DSM-III (American Psychiatric Association, 1980) and subsequent DSM editions. The positive predictive value of the CES-D cut-off in predicting MD was 33% with the chance-corrected agreement [Cohen's κ (Cohen, Reference Cohen1960)] between the two diagnostic approaches estimated at only +0.38. Further analysis suggested that many of the false positives (high CES-D scores but no MD diagnosis) resulted from the endorsement of self-report symptoms not closely related to the MD criteria, symptoms due to common medical conditions, and those of very short duration.
Seventh, DSM-IV criteria for MD, utilized in our three twin samples, require ‘clinically significant distress or impairment’ [(American Psychiatric Association, 1994) p. 327], a feature missing from the neuroticism or depressive symptom scales we used.
Finally, our findings can be conceptualized from a psychometric perspective. In addition to duration and temporal clustering, criteria for MD are selected to reflect relatively severe and clinically relevant depressive symptoms and signs (Aggen et al., Reference Aggen, Neale and Kendler2005). Measures of depressive symptoms and neuroticism are, by contrast, designed to sample a broad distribution of mild, moderate and severe symptomatology (Eysenck, Reference Eysenck1953; Eysenck and Eysenck, Reference Eysenck and Eysenck1975). Our results suggest that these liability dimensions – while correlated – are far from identical. Endorsement of clinical criteria for MD does not appear to simply reflect high levels of liability to self-report depressive symptoms or neuroticism.
Standard bivariate twin analyses on two samples distinct from those studied here estimated the genetic correlations between lifetime MD and neuroticism to equal +0.46 (Kendler et al., Reference Kendler, Gatz, Gardner and Pedersen2006) and +0.43 (Kendler and Myers, Reference Kendler and Myers2010). Are these results congruent with our findings? Given that assessing shared genetic variance between two traits requite a squaring of the genetic correlation, these two studies suggest that lifetime MD and neuroticism share between 18 and 21% of their genetic variance, results broadly consistent with our current findings.
Limitations
These results should be considered in the context of six potentially important methodological concerns. First, methodological differences existed between Virginia and Australian samples so they did not constitute perfect replications of one another. Different semi-structured interviews were used and the Australian samples used a longer list of depressive symptoms. However, constraining parameter estimates to equality across these samples in our mega-analyses, resulted in no deterioration in fit indicating that the results obtained across these different twin cohorts were statistically indistinguishable. Second, we utilized only single assessments for all three of our variables. Previous work has shown that multiple assessments of these variables can increase heritability and genetic correlations as would be expected given the reduction in error variance (Foley et al., Reference Foley, Neale and Kendler2001). However, single measures have been the typical approach to the use of these measures in molecular genetic studies.
Third, our modeling assumes a normally distributed liability to our phenotypes (Falconer, Reference Falconer1965). While recent genome wide association studies (GWAS) for psychiatric disorders support the validity of this model (Sullivan et al., Reference Sullivan, Agrawal, Bulik, Andreassen, Borglum, Breen, Cichon, Edenberg, Faraone, Gelernter, Mathews, Nievergelt, Smoller and O'Donovan2018), there is no simple relationship between the percentage of heritability estimate to be unique to MD and the specific number and effect size of risk loci that might be found by GWAS or sequencing. Our results can only provide broad guidelines as to what is likely to be found.
Fourth, results such as those presented are sensitive to reporting effects that can upwardly bias phenotype correlations. We have reduced this concern in all three samples by requiring that the assessment of lifetime MD be separated by at least a year from that of depressive symptoms and Neuroticism. We examined in all three samples whether the association between lifetime MD and depressive symptoms and Neuroticism was related to the temporal proximity of the assessments. In all three samples, they were not.
Fifth, personal interviews yield qualitatively different information from mailed questionnaires. Such method variance is known to decrease correlations between measures of the same construct. The stem-probe format of a structured psychiatric interview, which has skip-outs if necessary conditions are not met, differs considerably from that of a questionnaire. In addition, the interactive nature of a personal interview provides opportunities to fine-tune whether a response does or does not meet a criterion. A questionnaire might be structured the same way as a clinical interview, and correlate more highly with the interview, but the interactive component would still be lost.
Finally, lifetime prevalence rates for MD in all of our samples were in the upper range of those found in modern epidemiological surveys [e.g. (Bromet et al., Reference Bromet, Andrade, Bruffaerts, Williams and Scott2018)] although higher rates have been found (Weissman and Myers, Reference Weissman and Myers1978; Rorsman et al., Reference Rorsman, Grasbeck, Hagnell, Lanke, Ohman, Ojesjo and Otterbeck1990). For the Virginia sample, we have obtained test-retest reliability for lifetime MD over 1 year and it was quite acceptable (κ = 0.66, 95% CI 0.58–0.74) (Kendler and Prescott, Reference Kendler and Prescott2006). Higher rates for MD are more likely to increase than decrease genetic relationships with depressive symptoms or Neuroticism.
Conclusions
In three independent twin samples, using model fitting methods, we examined the relationship between the genetic risk factors for broadly defined depression and those specific to its three constituent phenotypes: lifetime MD, self-report depressive symptoms and Neuroticism. For MD, we found across our three samples that around two-thirds of the genetic effects were specific to MD and not shared with the broadly defined depression. Cross-sample analyses indicate that our three twin samples yielded modeling results that were statistically homogeneous. These results raise concerns about molecular genetic strategies that seek to elucidate the full genetic underpinnings of MD depression by using, as proxies, measures of current self-report depressive symptoms and Neuroticism. Such strategies would certainly identify a proportion of the genetic risk variants for MD. However, the identified variants and their associated genes would likely provide a quite incomplete picture of the neurobiological substrate of the clinical syndrome of MD.
Acknowledgements
Data-collection in the Virginia Twin Sample, now part of the Mid-Atlantic Twin Registry, was supported by NIH grants MH-40828, AA-09095 and MH/AA/DA-49492 to KSK. Surveys in the Australian twin cohorts was supported by NIH grants AA07535 and AA10249 to ACH, and grants from the Australian National Health and Medical Research Council to NGM.
Conflict of interest
The authors have no conflicts of interest to declare.
Role of the Funder/Sponsor
The funders had no role in the design and conduct of the study; collection, management, analysis, and interpretation of the data; preparation, review, or approval of the manuscript; and decision to submit the manuscript for publication.
Ethical standards
The authors assert that all procedures contributing to this work comply with the ethical standards of the relevant national and institutional committees on human experimentation and with the Helsinki Declaration of 1975, as revised in 2008.
Author ORCIDs
Kenneth S. Kendler, 0000-0001-8689-6570.