





The marketing of alcoholic beverages has been widely debated due to its potential impact on population consumption patterns(1). In the field of public health, alcohol use is a modifiable risk factor for major non-communicable chronic diseases(1) and a preventable contributor to various public health issues, including violence, substance dependence and traffic accidents(2).
In 2019, alcohol consumption was the ninth leading risk factor for the loss of healthy life years adjusted for disability and death (disability-adjusted life years) worldwide and the fifth in Brazil. Between 2010 and 2019, its share of total disability-adjusted life years increased by 3·7 % globally (from 3·3 % to 4·1 %) and by 5·7 % in Brazil (from 5·0 % to 6·4 %)(3). Harmful alcohol use was responsible for more than 2·4 million deaths worldwide in 2019 (4·3 % of all deaths), including 77 500 (5·5 % of all deaths) in Brazil(2).
Studies indicate that frequent exposure to alcohol marketing can stimulate early alcohol consumption among youth and adolescents, as well as increase alcohol consumption among adults(Reference Anderson, Bruijn and Angus4,Reference Jernigan, Noel and Landon5) . Alcohol marketing often employs advertising strategies such as the use of celebrities, promotions and appeals to emotion and leisure to attract consumers(Reference Jernigan, Noel and Landon5). Among the various communication platforms, television (TV) is a common medium for exposure to alcohol marketing. The media, in general, has considerable advertising presence, which is amplified in television due to its wide simultaneous reach (mass communication), including vulnerable populations, such as younger individuals, those with lower socio-economic status, and individuals with harmful or high-risk patterns of alcohol consumption, who may be more susceptible to the effects of alcohol marketing(Reference Porto, Rios and Souza6). The habit of watching TV for extended periods exposes individuals to both direct marketing (during commercial breaks) and indirect marketing (when consumption is associated with moments of pleasure, relaxation and socialisation during programmes)(Reference Afshin, Forouzanfar and Reitsma7).
To advance consumer protection against alcoholic beverage marketing, the implementation of regulatory measures to restrict this practice are recommended. The Global Strategy to Reduce the Harmful Use of Alcohol, developed by the WHO(8), outlines basic principles that support this approach and promotes actions aimed at regulating the content and dissemination of alcoholic beverage advertisements(9). In Brazil, restrictions on alcoholic beverage marketing have been in effect since 1996 under Law 9.294. The law regulates alcohol advertising by limiting its placement (e.g. only between 9:00 p.m. and 6:00 a.m. on radio and television), prohibiting association with health benefits or social/sexual success and restricting the use of certain appeals such as targeting minors or encouraging excessive consumption(10). However, these restrictions apply only to beverages with an alcohol content above 13 degrees Gay-Lussac(10), thereby excluding a large proportion of alcoholic beverages such as beer and wine(10). Marketing for this category of alcoholic beverages is self-regulated by the Brazilian Code of Self-Regulation of Advertising, overseen by the National Council for Self-Regulation of Advertising (CONAR). Because adherence to its code is voluntary and its decisions are not legally binding, its ability to regulate alcohol marketing is limited. Evidence suggests that self-regulation has been insufficient to curb inappropriate advertising practices(Reference Vendrame and Pinsky11,Reference Vendrame12) .
Despite the public health relevance of alcohol marketing, few studies in Brazil have examined the characteristics of this practice. To date, available evidence has focused on the visual-perceptual features of alcoholic beverage advertisements(Reference Viacava, Weydmann and de Vasconcelos13) and on marketing analyses conducted during specific sporting events(Reference Miranda, Matos and Horta14,Reference Noel, Babor and Robaina15) . Therefore, there is limited understanding of the routine strategies employed by alcoholic beverage companies, particularly in a widely used communication medium, taking into account aspects such as audience and timing. This limited set of studies does not allow for a comprehensive understanding of how alcohol marketing operates within the routine dynamics of Brazilian media, leaving an important gap regarding the formats, intensities and patterns of placement that predominate under regular programming conditions. Thus, the present study aimed to analyse the frequency and distribution of alcoholic beverage advertisements and to identify patterns of co-occurring marketing strategies on the three highest-rated broadcast television channels in Brazil between 2018 and 2020.
Methodology
Data collection
The procedures used for sampling and data collection were based on the protocol developed by the International Network for Food and Obesity/Non-Communicable Diseases Research, Monitoring and Action Support (INFORMAS)(Reference Swinburn, Sacks and Vandevijvere16). This methodology has already been implemented in thirty-seven countries and is divided into ten modules, including the Food Promotion module, which encompasses the Television Food and Beverage Marketing Protocol. This protocol provides a step-by-step guide to assess the frequency, population exposure levels, promotional content, the advertising strategies used and the nutritional composition of the products being promoted(Reference Kelly17).
Television broadcasts from the three most-watched free-to-air channels in Brazil, Rede Globo, Record and SBT, were recorded, according to the annual average ratings measured by the Brazilian Institute of Public Opinion and Statistics (IBOPE)(18). All programming for each channel was digitally recorded by a media auditing company specially contracted for this purpose. The recording days were randomly selected by the research team using a statistical programme, based on all days within the target months. Holidays and school vacation periods were excluded from the randomisation process. In total, eight non-consecutive days (four weekdays and four weekend days) were selected within 1 month for each annual segment. Data collection covered three annual segments from 2018 to 2020 and included all programming broadcast from 6:00 a.m. to midnight. In total, 1296 h of TV broadcasting (432 h per channel) were recorded.
Data coding
Once the recordings for each period were completed, they were audited in three stages. The first audit stage was conducted by the company responsible for the recordings. The company identified the total number of advertisements and coded advertisements related to food and beverages or locations where these products are sold. The second audit stage was carried out independently by two trained researchers. These researchers performed a general verification of the number and duration of the recorded videos for each channel, considering that the recordings were segmented into 10-min blocks – meaning six 10-minute videos per hour of recording. This audit made it possible to identify any missing time segments or duplicated videos. The third audit stage took place after the data were tabulated by the researchers. During this stage, additional food and beverage advertisements or advertisements for points of sale were identified and added to the initial set of codes. All advertisements were entered into an electronic questionnaire developed in Epi Info™ (version 7.2.2.6), with the questions based on the INFORMAS protocol(Reference Kelly19). For data tabulation, a research team was assembled, composed of undergraduate and graduate students. This team was properly trained and standardised, and each member was responsible for extracting data from one television channel. All data were double-entered to ensure consistency and allow for later verification.
For each of the identified advertisements, the following information was collected: channel name, recording date, whether it was a weekday or weekend, programme name and category, start and end time, duration of the advertisement, type of advertisement, company name, name and description of the advertised products and advertising strategies. As for the type of advertisement, these were coded as: alcoholic beverages; non-alcoholic food and beverages; and non-food products.
For advertisements involving food and beverages (both alcoholic and non-alcoholic), we further analysed the marketing strategies used to promote the products. The classification of strategies was based on predefined variables from the Food Promotion module of the INFORMAS protocol. Importantly, both the variables and their grouping into three categories are standardised within the protocol and were not developed for this study. These categories include ‘Power of advertising’, ‘Premium offers’ and ‘Benefit claims’. The first category, ‘Power of advertising’, refers to advertising strategies intended to enhance the appeal and influence of advertisements, such as the use of licensed characters and celebrities, among other examples specified in the protocol. The second category includes ‘Premium offers’, such as price promotions (e.g. ‘buy 2 get 3’), giveaways, collectibles and limited editions. The third category comprises ‘Benefit claims’, including statements related to sensory attributes, product performance or suggested use. In total, twenty-five marketing strategy variables from the protocol were assessed. Further details are presented in Figure 1.
Persuasive marketing strategies according to the INFORMAS protocol. The source was INFORMAS (2014)(Reference Kelly19) and Silva et al. (2021)(Reference Silva, Rodrigues and Matos20). INFORMAS, International Network for Food and Obesity/Non-Communicable Diseases Research, Monitoring and Action Support.

In addition to the marketing strategies suggested by the INFORMAS protocol, eleven other marketing appeals were investigated: happiness (messages that associate the product with feelings of joy or positive emotional experiences); well-being (claims suggesting that product consumption promotes physical or emotional well-being); leisure (appeals linking the product to leisure activities, relaxation or recreational moments); success (messages connecting the product to notions of achievement, accomplishment or enhanced social status); friendship (appeals associating product consumption with social interactions or moments shared with friends); fun (messages emphasising enjoyment, playfulness or entertainment related to the product); sports (appeals connecting the product to sports activities, athleticism or an active lifestyle); homemade meal (messages evoking the idea of homemade, traditional or family-prepared food); pleasure (appeals highlighting pleasurable or indulgent sensory experiences associated with the product); flavour (claims emphasising taste-related attributes such as intensity, richness or distinctive flavour profiles); and quality (messages underscoring superior quality, excellence or trusted product attributes).
The data coding for the advertisements was performed through double data entry by independent coders. The resulting datasets were compared using the statistical software Epi Info to identify discrepancies in data entry. Discrepancies were first resolved by consensus or, when necessary, by arbitration from a third researcher. In addition, inter-coder reliability (i.e. agreement between independent coders during data coding) was assessed for all study years. All discrepant cases were re-examined by a pair of coders, who independently reviewed the original broadcasts in a blinded manner and performed double-entry correction. This procedure ensured the resolution of all inconsistencies in the dataset. Inter-coder agreement ranged from 90·37 % to 99·74 % in 2018, from 96·7 % to 98·4 % in 2019 and from 97·6 % to 99·3 % in 2020.
Audience data for the programming of the evaluated channels were also collected. To this end, data from Kantar Ibope Media, a Brazilian media monitoring company, were used to identify whether alcohol advertisements were broadcast during programmes with relatively high audience ratings. For the purposes of this study, these programmes were defined as those included in the monthly top 10 audience rankings, corresponding to the ten highest-rated programmes among the three evaluated broadcasters during each month of data collection. Audience ratings are estimated from representative household panels that continuously monitor television viewing throughout the day. Ratings are expressed in points, with each point corresponding to 1 % of the total universe of households or individuals in a given region(18).
Data analysis
Initially, the absolute and relative frequency of food and beverage advertisements (both alcoholic and non-alcoholic) for the years 2018, 2019 and 2020 was estimated.
Non-alcoholic food and beverage advertisements were excluded from the sample, and the following analyses were conducted considering only alcoholic beverage advertisements.
The frequencies of alcohol advertisements in the overall sample and between weekdays (during the week or on weekends), with stratification by the evaluated years, were estimated. These frequencies were further analysed according to audience ratings, comparing advertisements aired during programmes included in the monthly top 10 audience rankings with those aired during other programmes. Additionally, the frequency of marketing strategies was estimated for the total sample and across the evaluated years. For all these analyses, Pearson’s χ2 test was used with a significance level of 5 %. Pairwise comparisons between years were performed using the Bonferroni post hoc test to identify statistically significant differences (p < 0.05).
To identify empirical patterns of co-occurring marketing strategies in alcoholic beverage advertisements, a principal component analysis (PCA) was performed. The marketing strategies analysed were previously defined according to the INFORMAS protocol, and PCA was applied as an exploratory analytical technique to examine how these predefined strategies tended to co-occur within advertisements, rather than to establish a new conceptual classification of marketing strategies. PCA transforms a set of correlated variables into a smaller number of components that summarise the underlying relationships among variables while retaining most of the information contained in the original variables(Reference Hongyu, Sandanielo and Oliveira Junior21). Other studies have used this methodology to identify broader patterns of food marketing strategies(Reference Santana, Guimarães and Leite22).
For this analysis, only marketing strategies with a frequency of at least 10% in the overall sample were included. Each component represents an empirical pattern of co-occurring marketing strategies based on their correlation structure within the advertisements. The number of components retained was determined using the Kaiser criterion (Reference Kaiser23), whereby components with an eigenvalue greater than 1 were considered to explain a sufficient proportion of the total variance. Variables with factor loadings ≥0·35 were considered strongly associated with a given component. Negative factor loadings indicate an inverse association with the component, whereas positive factor loadings indicate a direct association. Thus, the greater the magnitude of the factor loading, the greater the contribution of the strategy to the identified pattern. Components were interpreted according to the strategies with the highest factor loadings and assigned descriptive labels to facilitate presentation and interpretation.
Finally, to verify the association of the patterns identified through PCA and their usage in the evaluated years, participation scores for each identified pattern were generated, and the median of these scores was compared between years using the Kruskal–Wallis test with subsequent Bonferroni correction. Differences were reported at a 5 % significance level.
All statistical analyses were performed using the Stata statistical software package (version 16.1)(24).
Results
A total of 2369 food and beverage advertisements (both alcoholic and non-alcoholic) were identified in 1296 h of recordings. On average, 11·2 % (n 269) of the advertisements were promoting alcoholic beverages, and 88·8 % (n 2127) were for food and non-alcoholic beverages. Across the study period, the proportion of alcohol advertisements was 11·8 % (n 125) in 2018, 10·2 % (n 90) in 2019 and 11·7 % (n 54) in 2020. Overall, the proportion of alcohol advertisements remained relatively stable throughout the study period compared with the other advertisement categories.
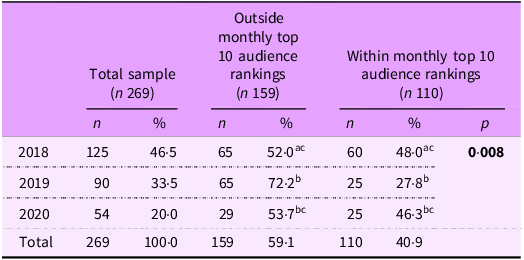
Of the 269 alcoholic beverage advertisements, 260 were aired on Globo, 7 on Record and only 2 on SBT (data not shown). The frequency of alcohol marketing in the overall sample decreased between 2018 and 2020, reflecting a decline in the number of advertisements during the period (2018: 46·5 %; 2019: 33·5 %; 2020: 20·0 %). Regarding audience ratings, alcohol advertisements were more frequently observed outside programmes included in the monthly top 10 audience rankings than within these programmes (59·1 % v. 40·9 %, respectively). However, a statistically significant difference in the frequency of alcohol advertisements according to audience ratings was observed only between 2018 and 2019. In 2018, a greater proportion of advertisements was aired during programmes included in the monthly top 10 audience rankings (48·0 %) than in 2019 (27·8 %) (p = 0·008) (Table 1).
Frequency of alcohol advertisements in the overall sample and according to whether advertisements were aired during programmes included in the analysed monthly top 10 audience rankings, 2018–2020

Table 1. Long description
A table comparing the frequency of alcohol advertisements in the overall sample and according to whether advertisements were aired during programs included in the analyzed monthly top 10 audience rankings from 2018 to 2020. The table has four rows and three columns. Column headers are Total sample (n 269), Outside monthly top 10 audience rankings (n 159), and Within monthly top 10 audience rankings (n 110). Row labels are 2018, 2019, 2020, and Total. Each row contains values for n and percent. Notable trends include a decrease in the frequency of alcohol marketing in the overall sample from 2018 to 2020, with a significant difference observed only between 2018 and 2019. In 2018, a greater proportion of advertisements was aired during programs included in the monthly top 10 audience rankings compared to 2019.
Programmes were classified according to inclusion in the monthly top 10 audience rankings analysed in this study. Different superscript letters within the column indicate statistically significant differences between years based on the Bonferroni post hoc test applied to Pearson’s χ2 (p < 0.05).
Overall, a higher proportion of alcohol advertisements was aired on weekends than on weekdays (54·3 % v. 45·7 %) throughout the study period. When audience ratings were considered, advertisements aired during programmes included in the monthly top 10 audience rankings were more frequently observed on weekdays (55·5 %) than on weekends (44·5 %). Conversely, advertisements aired outside the monthly top 10 audience rankings were more frequent on weekends (61·0 %) than on weekdays (39·0 %) (p = 0·008). However, this pattern differed in 2020, when advertisements aired outside the monthly top 10 audience rankings were more frequent on weekdays than those aired during top 10 programmes (69·0 % v. 40·0 %), whereas on weekends, advertisements aired during top 10 programmes were more frequent than those aired outside the rankings (60·0 % v. 31·0 %) (p = 0·033) (data not shown).
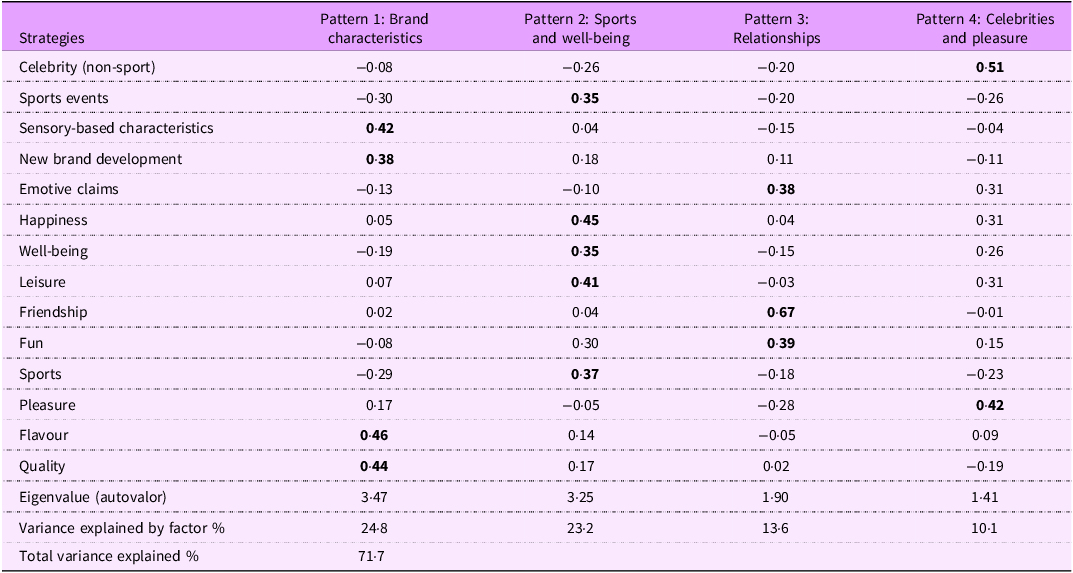
Four empirical patterns of co-occurring marketing strategies were identified through PCA, explaining 71·7 % of the total variance (Table 2). The components were interpreted according to the marketing strategies with the highest factor loadings and assigned descriptive labels to facilitate presentation. The first component, labelled ‘Brand Characteristics’, was characterised by higher loadings for sensory-based characteristics (0·42), new brand development (0·38), flavour (0·46) and quality (0·44). The second component, labelled ‘Sports and Well-being’, was associated with sports events (0·35), sports (0·37), happiness (0·45), well-being (0·35) and leisure (0·41). The third component, labelled ‘Relationships’, was characterised by emotional claims (0·38), friendship (0·67) and fun (0·39). The fourth component, labelled ‘Celebrity and Pleasure’, was associated with non-sports celebrity strategies (0·51) and pleasure (0·42) (Table 2). Collectively, these components summarise the predominant patterns of co-occurrence among the predefined marketing strategies observed in the advertisements, providing an empirical description of how different strategies tended to appear together within the sample. This approach enabled comparisons of the relative prominence of these co-occurrence patterns across the study period.
Factor loadings obtained from principal component analysis for four patterns composed of marketing strategies in alcoholic beverage advertisements. The three main free-to-air television channels in Brazil, between 2018 and 2020

Table 2. Long description
A table with four rows and eleven columns comparing marketing strategies in alcoholic beverage advertisements across four patterns. The columns are labeled with the patterns: Brand characteristics, Sports and well-being, Relationships, and Celebrities and pleasure. The rows are labeled with different strategies: Celebrity (non-sport), Sports events, Sensory-based characteristics, New brand development, Emotive claims, Happiness, Well-being, Leisure, Friendship, Fun, Sports, Pleasure, Flavour, Quality, Eigenvalue (autovalor), Variance explained by factor percent, and Total variance explained percent. Each cell contains a numerical value representing the factor loadings for each strategy within the patterns. Notable trends include high loadings for sensory-based characteristics and quality in the Brand characteristics pattern, sports events and happiness in the Sports and well-being pattern, friendship in the Relationships pattern, and celebrity (non-sport) in the Celebrities and pleasure pattern.
Bold values represent a correlation greater than 0·35 or less than –0·35.
Kaiser-Meyer-Olkin (KMO) = 0·6. P-value from Bartlett’s test of sphericity: <0·001.
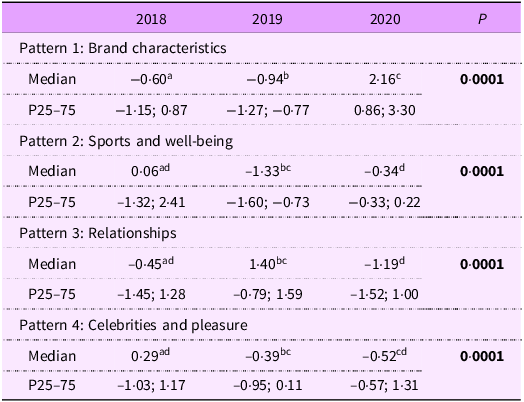
The empirical patterns of co-occurring marketing strategies showed distinct distributions across the study period (2018–2020), as indicated by the median component scores (Md) for each pattern. The ‘Brand Characteristics’ pattern showed the highest median score in 2020 (Md: 2·16). The ‘Sports and Well-being’ pattern showed higher median scores in 2018 and 2020 (Md: 0·06 and Md: –0·34, respectively). The ‘Relationships’ pattern showed the highest median score in 2019 (Md: 1·40). Finally, the ‘Celebrity and Pleasure’ pattern showed a higher median score in 2018 (Md: 0·29) than in 2019 (Md: –0·39) (Table 3).
Score contribution by pattern per year

Table 3. Long description
A table comparing score contributions by pattern per year from 2018 to 2020. The table has four rows and five columns. Column headers are 2018, 2019, 2020, and P. Row labels are Pattern 1: Brand characteristics, Pattern 2: Sports and well-being, Pattern 3: Relationships, and Pattern 4: Celebrities and pleasure. Each row contains median values and P25-75 ranges for each year. Pattern 1: Brand characteristics shows median values of -0.60, -0.94, and 2.16 for 2018, 2019, and 2020 respectively, with a P value of 0.0001. Pattern 2: Sports and well-being shows median values of 0.06, -1.33, and -0.34 for 2018, 2019, and 2020 respectively, with a P value of 0.0001. Pattern 3: Relationships shows median values of -0.45, 1.40, and -1.19 for 2018, 2019, and 2020 respectively, with a P value of 0.0001. Pattern 4: Celebrities and pleasure shows median values of 0.29, -0.39, and -0.52 for 2018, 2019, and 2020 respectively, with a P value of 0.0001.
Different superscript letters within the row indicate statistically significant differences between years based on the Bonferroni post hoc test applied to the Kruskal-Wallis test (p < 0.05).
In the total sample, benefit claims were the most frequent marketing strategies (58·0 %) in alcoholic beverage advertisements, with emphasis on messages highlighting the sensory characteristics of the beverage (34·2 %), new brand development (23·8 %) and emotional claims (18·2 %). The second most frequent group of strategies was related to the power (48·3 %), notably the presence of non-sports celebrities (28·3 %) and sporting events (16·4 %). Premium offers appeared in less than 20 % of alcoholic beverage advertisements and mainly included price discounts (3·4 %), limited editions (3·0 %) and gift or collectable (1·5 %). Alcoholic beverage advertisements featured 91·1 % of other product-related appeals, especially joy (52·8 %), friendship (52·4 %), quality (36·4 %), leisure (31·6 %), flavour (27·9 %), pleasure (24·9 %) and happiness (22·3 %) (Table 4 and Supplementary Material 1).
Frequency of strategies in the total sample and across the years

Table 4. Long description
The table presents the frequency of various marketing strategies in alcoholic beverage advertisements over the years 2018, 2019, and 2020. It includes data for the total sample and each year separately. The strategies are categorized into Power, Premium offers, Benefit claims, and Other appeals. The table has four rows and seven columns. Column headers are Total sample, 2018, 2019, and 2020, each with sub-columns for count (n) and percentage (%). Row labels are Power, Premium offers, Benefit claims, and Other appeals. Notable trends include a decrease in the use of Power strategies from 64 percent in 2018 to 31.5 percent in 2020, and an increase in Benefit claims from 39.2 percent in 2018 to 100 percent in 2020. Other appeals consistently appear in high percentages across all years, with a peak of 94.4 percent in 2018.
Different superscript letters within the row indicate statistically significant differences between years based on the Bonferroni post hoc test applied to Pearson’s χ2.
When observing the use of marketing strategies over the years, a higher frequency of power strategies was found in 2018 (64·0 %) compared to the other years (2019: 36·7 %; 2020: 31·5 %). The premium offer strategy had greater representation in 2018 (6·4 %) and 2020 (16·7 %), while no advertisements in this category were identified in 2019. All alcohol advertisements in 2020 included strategies related to claims benefits, compared to 39·2 % in 2018 and 58·9 % in 2019. The frequency of other appeals used in alcohol marketing was higher in 2018 (94·4 %) and 2020 (100·0 %) compared to 2019 (81·1 %). Nearly, all strategy categories within these groups showed different levels of participation depending on the year evaluated (Table 4 and Supplementary Material 1).
Discussion
Our findings indicate that alcoholic beverage advertisements accounted for just over 11 % of all food and beverage (alcoholic and non-alcoholic) advertisements between 2018 and 2020, maintaining a relatively stable share throughout the study period. Among the three television networks evaluated, almost all alcoholic beverage advertisements were aired on Globo, the highest-rated television network in Brazil(25). The absolute number of alcoholic beverage advertisements declined over the years. Overall, alcoholic beverage advertisements were more frequently aired on weekends than on weekdays and were predominantly observed outside programmes included in the monthly top 10 audience rankings. However, when the distribution of advertisements was examined according to both audience ratings and day of the week, advertisements aired during top 10 programmes were more frequently observed on weekdays, whereas those aired outside the top 10 rankings were more frequent on weekends. This distribution pattern changed in 2020, when the opposite trend was observed.
The reduction in the number of alcoholic beverage advertisements observed over the study period may, among other factors, be related to changes in media consumption, particularly the shift from traditional to digital platforms. In Brazil, Internet use has increased substantially in recent years(26), and alcohol marketing has adapted by expanding its presence on digital media, especially social media, to reach younger and more connected audiences(Reference Lobstein, Landon and Thornton27,Reference Noel, Sammartino and Rosenthal28) . This transition has also extended beer marketing beyond traditional media to include the sponsorship of events promoted across digital platforms(Reference Pinsky and El Jundi29). Therefore, although our study focused exclusively on television marketing, the observed decline in television advertisements should not be interpreted as a reduction in overall alcohol marketing, but rather as a possible redistribution of marketing investments towards digital environments, which offer greater audience targeting, interactivity and lower transparency. Although evidence on the migration of alcohol marketing from broadcast television to digital media in Brazil remains limited, the rapid growth of the streaming service of the country’s highest-rated television network, which surpassed 20 million active subscriptions in 2020, illustrates this broader transformation(30).
In addition, despite changes in media consumption patterns and the marketing market for traditional media, specific exposure habits persist, for example, the tendency to watch television more frequently on certain days of the week or during high-audience programming(31). In the present study, we identified a higher frequency of alcoholic beverage advertisements on weekends. This may reflect a strategic choice by advertisers, given not only the potential for increased television viewership during this period but also the likelihood of greater alcohol consumption at the end of the week. Although there is a lack of studies specifically addressing variations in alcohol consumption frequency across days of the week, a national survey on alcohol consumption patterns in the Brazilian population reported that among adults who engaged in binge drinking, defined as consuming a large amount of alcohol in a short period, within the previous 12 months, 27 % did so in venues commonly associated with weekend activities, such as bars, nightclubs and dance clubs(32).
The most frequently employed marketing strategies involved benefits claims, particularly sensory attributes, alongside new brand development and emotive claims, such as associations with friendship, leisure and happiness. Additionally, the presence of celebrities and linkages to sporting events were notable strategies, although their occurrence varied across the years. The use of these strategies reinforces the influence of marketing on the positive perception of alcohol consumption, potentially contributing to the normalisation of its use, especially among young people.
However, a different distribution pattern of advertisements was observed during the pandemic period, with a reversal of the trend identified in previous years. A higher frequency of advertisements aired outside the analysed monthly top 10 audience rankings was observed on weekdays compared with those aired during programmes included in these rankings (69·0 % v. 40·0 %). During the implementation of social distancing measures, increased time spent at home may have resulted in greater exposure to televised and online marketing throughout weekdays, which could have influenced alcohol consumption patterns during this period(Reference Rodrigues, Matos and Horta33). Additionally, on weekends, advertisements aired during programmes included in the analysed monthly top 10 audience rankings were more frequent than those aired outside these rankings (60·0 % v. 31·0 %). It is suggested that television programming patterns also shifted during the pandemic, with live-streamed musical performances, known as ‘lives’, becoming a widely adopted strategy to attract and engage audiences on weekends (Reference Perez, Sato and Pompeu34). Studies have shown that the COVID-19 pandemic also altered alcohol consumption patterns, influenced by social isolation, age and mental health status(Reference Capasso, Jones and Ali35). Data from a cross-sectional study indicate that 17·6 % of the Brazilian population reported an increase in alcohol consumption during the pandemic, with the highest increase (24·6 %) observed among individuals aged 30 to 39 years(Reference Malta, Szwarcwald and Barros36). Alcohol consumption is not only associated with numerous diseases and weakened immunity but may also exacerbate mental health disorders, domestic violence and accidents(2). The spread of misinformation claiming that alcohol could protect against COVID-19 worsened the situation, resulting in alcohol poisoning deaths in some countries(Reference Shokoohi, Nasiri and Sharifi37). Several studies reported increased alcohol consumption across various countries, including Brazil(38).
Our findings identified four strategic marketing patterns employed between 2018 and 2020. These patterns should be interpreted as empirical patterns of co-occurring marketing strategies identified through PCA rather than as a new conceptual classification of marketing appeals. Because the marketing strategies were predefined according to the INFORMAS protocol, the PCA was used to examine how these strategies tended to appear together within advertisements, providing a data-driven description of their co-occurrence. Consequently, the labels assigned to each pattern are descriptive and intended to facilitate interpretation of the observed combinations of strategies. Each of these empirical patterns exhibited distinct variations over the years, reflecting adaptations by brands to maintain engagement with their target audiences. The ‘Brand Characteristics’ pattern was most prominent in 2020 and involved strategies emphasising the product’s sensory attributes, new brand development, flavour and quality, likely a response to the need to attract consumers while adhering to social distancing measures. Prior to the pandemic, advertisements more commonly promoted alcohol consumption in social settings, such as parties or gatherings with friends. Beyond the general effects of the pandemic, there are structural market factors that help explain the predominance of the ‘Brand Characteristics’ pattern in 2020. In recent years, major alcoholic beverage companies in Brazil have adopted brand-building strategies focused on sensory attributes, product quality differentiation and innovation as a means to remain competitive in a saturated market(39). In 2020, from a marketing standpoint, this shift may have intensified due to two complementary factors: the need to maintain continuous presence on television amid a reduction in large campaigns and events, and the migration of promotional and engagement activities, including the use of celebrities, sports-related activations and consumption-oriented experiences, to digital environments. In this context, television marketing may have been used primarily to reinforce intrinsic product attributes, which do not depend on specific social situations and are more easily communicated in this format.
The ‘Sports and Well-being’ pattern was notably present in 2018, conveying positive associations with sporting events, physical activity, happiness, well-being and leisure. In contrast, its presence declined in 2020, likely due to the suspension of sporting events and restrictions on group sports and leisure activities during the pandemic. The ‘Relationships’ pattern was more frequent in 2019, characterised by strategies that highlighted emotive claims, friendship and fun. Finally, the ‘Celebrities and Pleasure’ pattern was more prominent in 2018 than in 2019, using strategies that involved non-sport celebrities and emphasised pleasure.
Examining the patterns of marketing strategies used in alcoholic beverage marketing in Brazil is essential for characterising the profile of these strategies, their fluctuations over the years and how these factors may contribute to fostering the debate on exposure to such content. Alcohol marketing frequently associates consumption with leisure, social status and happiness, which can directly influence drinking behaviours, particularly among young people and vulnerable populations(Reference Faria, Vendrame and Silva40).
Although international research on alcoholic beverage marketing on television is growing, it remains limited, particularly compared with other areas of unhealthy product marketing, and is largely concentrated in high-income countries such as Japan, Australia and the USA. Previous studies have reported patterns similar to those observed here, including differences in advertising frequency across weekdays(Reference Pauzé, Pinto and Potvin41), variations according to programme audience ratings (Reference Kato, Ishikawa and Kiuchi42) and the use of specific marketing strategies(Reference Pettigrew, Roberts and Pescud43). By examining these issues in Brazil, a middle-income country characterised by high television penetration and predominantly self-regulatory marketing governance, our study broadens the evidence base on television alcohol marketing in underrepresented settings.
The regulation of alcoholic beverage marketing is a key strategy for reducing excessive alcohol consumption in Brazil. Similar to the restrictions placed on tobacco marketing, limiting exposure to alcohol marketing may help reduce harmful drinking rates and their associated public health consequences(Reference Silva, Mc and Faria44). In 2018, the WHO launched the SAFER initiative(45), aimed at reducing the harmful use of alcohol and its consequences. SAFER advocates for restrictions or bans on the marketing, sponsorship and promotion of alcoholic beverages as a means to reduce consumption and protect children, adolescents and abstainers from social pressure to drink. In Brazil, Law No. 9294/1996 imposes restrictions on alcohol marketing, but its scope is limited to beverages with an alcohol content above 13 % ABV. As a result, the regulation excludes the most commonly consumed beverages in the country, such as beer, wine and ‘ice’ drinks(10). This regulatory loophole seriously undermines the effectiveness of the law, rendering it more symbolic than a functional instrument for public health protection. There is an urgent need to revise this legislation to encompass the full range of alcoholic beverages and to curb marketing practices that influence consumer behaviour. CONAR, the Brazilian advertising self-regulatory body, is responsible for monitoring irregularities and forwarding complaints to the Public Prosecutor’s Office(46); however, its impartiality is contested, as its members are not appointed by civil society. Additionally, alcohol advertisements are only permitted on television between 9:00 p.m. and 6:00 a.m., with the exception of event sponsorships and promotional mentions, which may air at any time, provided they do not directly encourage consumption(10).
This study has several limitations that should be considered when interpreting the findings. First, the analysis was restricted to three major Brazilian television networks, which may limit the generalisability of the results to other networks, regional channels or media formats. Second, potential seasonal variations in marketing frequency and strategies were not captured. Third, although the study characterised the presence and features of advertisements, it did not assess their effectiveness in influencing consumer behaviour. In addition, the PCA is an exploratory, data-driven technique that identifies empirical patterns based on correlations among variables. Therefore, the resulting components represent patterns of co-occurring marketing strategies within the study sample rather than a theoretical classification of marketing appeals, and some components may combine conceptually distinct strategies that frequently co-occur in advertisements. Finally, coding of subjective categories, such as emotional appeals, inherently involves interpretative judgement, which may introduce some variability despite rigorous coding procedures.
Despite these limitations, our findings provide important evidence to inform discussions on the regulation of alcoholic beverage marketing in Brazil. Strengthening public policies, including stricter regulation of marketing strategies and television broadcasting practices, may help reduce population exposure to alcohol marketing, particularly among vulnerable groups. Furthermore, this study extends the application of the standardised INFORMAS protocol, originally developed for non-alcoholic foods and beverages, to the context of alcoholic beverage marketing while preserving international comparability. Finally, our findings provide a foundation for future studies in both the alcohol and food fields, including analyses incorporating programme audience metrics to better understand not only the frequency of marketing but also its potential audience reach.
Supplementary material
For supplementary material accompanying this paper visit https://doi.org/10.1017/S1368980026103577.
Acknowledgements
This work was supported by the Coordenação de Aperfeiçoamento de Pessoal de Nível Superior – Brasil (CAPES; finance code 001) and the Conselho Nacional de Desenvolvimento Científico e Tecnológico (grant number 311170/2019-6 (Scholarship for RMC)).
Author contributions
Santana MO made a significant contribution to the concept, design, acquisition, analysis or interpretation of data, drafted the article or revised it critically for important intellectual content, approved the final version of the article for publication, agreed to be accountable for all aspects of the work and resolved any issues related to its accuracy or integrity.
Matos JP made a significant contribution to the concept, design, acquisition, analysis or interpretation of data, drafted the article or revised it critically for important intellectual content, approved the final version of the article for publication, agreed to be accountable for all aspects of the work and resolved any issues related to its accuracy or integrity.
Mais LA drafted the article or revised it critically for important intellectual content, approved the final version of the article for publication, agreed to be accountable for all aspects of the work and resolved any issues related to its accuracy or integrity.
Horta PM drafted the article or revised it critically for important intellectual content, approved the final version of the article for publication, agreed to be accountable for all aspects of the work and resolved any issues related to its accuracy or integrity.
Claro RM made a significant contribution to the concept, design, acquisition, analysis or interpretation of data, drafted the article or revised it critically for important intellectual content, approved the final version of the article for publication, agreed to be accountable for all aspects of the work and resolved any issues related to its accuracy or integrity.
Financial support
This work was supported by the Coordenação de Aperfeiçoamento de Pessoal de Nível Superior – Brasil (CAPES; finance code 001) and the Conselho Nacional de Desenvolvimento Científico e Tecnológico (grant number 311170/2019–6 (Scholarship for RMC)).
Competing interests
The authors declared no potential conflicts of interest with respect to the research, authorship and/or publication of this article, and there has been no significant financial support for this work that could have influenced its outcome.
Ethics of human subject participation
The study did not involve human subjects. Formal approval from the ethics committee is not required.
Author agreement
The authors declare that this manuscript is original, has not been published before and is not currently being considered for publication elsewhere. As Corresponding Author, I confirm that the manuscript has been read and approved for submission by all the named authors.




 Open access

