1 Introduction
In magnetohydrodynamic flows (MHD) the retroaction of the fluid on the magnetic field is controlled by the magnetic Reynolds number
 $Rm$
(Moffatt Reference Moffatt1978). At the low
 $Rm$
regimes considered here, the induction is negligible. An external electric current density,
 $\boldsymbol{j}$
, is applied to ensure the presence of a significant Lorentz force
 $\boldsymbol{j}\times \boldsymbol{B}$
, where
 $\boldsymbol{B}$
is the magnetic field. This forcing imposes the configuration and the properties of the flow. Although it is intrinsically a volumic force, in extreme regimes with a high enough magnetic field, the diffusion of momentum by the Lorentz force suppresses the velocity gradient over a large diffusion length. In this region no current can exist, then the imposed electric currents are constrained in flow boundary layers and the fluid bulk is Lorentz-force free and quasi-two-dimensional (Moreau Reference Moreau1990).
The thickness of these so-called Hartmann layers (
 $e_{H}$
), defined by the balance between the viscous term and the Lorentz force in the Navier–Stokes equation, is controlled by the inverse of the Hartmann number
 $M$
, which only depends on the magnetic field and on some properties of the liquid:
 $M=HB\sqrt{\unicode[STIX]{x1D70E}_{E}/(\unicode[STIX]{x1D70C}\unicode[STIX]{x1D708})}/2$
with
 $H$
the characteristic length along the magnetic field direction,
 $\unicode[STIX]{x1D70E}_{E}$
the electric conductivity,
 $\unicode[STIX]{x1D70C}$
the volumic mass and
 $\unicode[STIX]{x1D708}$
the kinematic viscosity of the fluid. By the channelling of the currents near the top and bottom plate into the Hartmann layer, the magnetic field also generates a boundary layer near the axial electrode, called the Shercliff layer, which is assumed to scale like
 $1/\sqrt{M}$
(Hunt & Stewartson Reference Hunt and Stewartson1965).
As mentioned above, one of the main actions of the magnetic field is to reduce the velocity gradients in its direction and hence to yield the flow two-dimensional (Sommeria & Moreau Reference Sommeria and Moreau1982; Pothérat Reference Pothérat2012). In this context, several authors studied experimentally and theoretically the flow produced in a Taylor–Couette-like geometry with steady cylinders where only the Lorentz force drives the flow. Baylis & Hunt (Reference Baylis and Hunt1971) showed that the azimuthal velocity only depends linearly on the electric current forcing under the assumption of negligible inertial effects and in the large Hartmann number limit. The profile of the azimuthal velocity
 $v_{\unicode[STIX]{x1D703}}$
was computed in an infinite cylinder, neglecting the induction effects, by Digilov (Reference Digilov2007) and Zhao, Zikanov & Krasnov (Reference Zhao, Zikanov and Krasnov2011). Such a velocity profile is close to a Poiseuille profile at low Hartmann number and becomes unstable according to the Rayleigh criterion for
 $M\gg 1$
(Chandrasekhar Reference Chandrasekhar2013). Tabeling & Chabrerie (Reference Tabeling and Chabrerie1981) studied secondary flows at high Hartmann numbers in the early 1980s. They demonstrated that its configuration depends on the conductivities of the walls and they introduced a more stringent criterion for inertial effects to be negligible. Later, Tabeling (Reference Tabeling1982) reported experimental evidence of instabilities for a limited range of forcing in a device with
 $\unicode[STIX]{x1D702}=H/(r_{o}-r_{i})=H/\unicode[STIX]{x0394}r\gg 1$
with
 $H$
the cell height and
 $r_{o}$
and
 $r_{i}$
are the outer and inner radii respectively. The same geometry with a square section (
 $\unicode[STIX]{x1D702}=1$
) has been used to study the laminar–turbulence transition by Moresco & Alboussiere (Reference Moresco and Alboussiere2004). They showed that the control parameter of the transition is a Reynolds number based on the Hartmann layer thickness as
 $Re/M$
(
 $Re=U_{0}\unicode[STIX]{x0394}r/\unicode[STIX]{x1D708}$
with
 $U_{0}$
the mean azimuthal velocity). This is due to the fact that the thickness of the Hartmann layer will prevent the transition to turbulence even at large Reynolds number. Several numerical studies of this particular geometry have been performed. Krasnov et al. (Reference Krasnov, Zienicke, Zikanov, Boeck and Thess2004) attributed the discrepancy in the instability threshold values found between the experimental data and the linear stability analysis to finite-amplitude perturbations. Vantieghem & Knaepen (Reference Vantieghem and Knaepen2011) (at low Reynolds number) and Zhao & Zikanov (Reference Zhao and Zikanov2012) (at high Reynolds and Hartmann numbers) show the presence of two pairs of contra-rotating vortices. One is arranged along the inner axial wall while the other is arranged along the outer axial wall. However, to our knowledge, the configurations of the secondary flow before the establishment of the fully developed Hartmann regime (
 $M\gg 1$
) were not studied experimentally. This is the purpose of the present article that presents runs at moderate Hartmann number in a domain where the inertial effects cannot be negligible.
Due to the difficulty in using usual anemometry techniques in liquid metals, as described in Shercliff (Reference Shercliff1965), velocity has never been directly measured in the previous experimental studies. Local or global potential measurements were performed instead. However, measurements of velocity profiles using ultrasonic techniques can actually be achieved in liquid metal flows, as first demonstrated by Brito et al. (Reference Brito, Nataf, Cardin, Aubert and Masson2001) and Eckert & Gerbeth (Reference Eckert and Gerbeth2002). Since then, several experimental studies have used this technique: Boisson & Aumaitre (Reference Boisson, Klochko, Daviaud, Padilla and Aumaitre2012) to characterize travelling waves in a MHD flow and more recently Stelzer et al. (Reference Stelzer, Cébron, Miralles, Vantieghem, Noir, Scarfe and Jackson2015a ,Reference Stelzer, Miralles, Cébron, Noir, Vantieghem and Jackson b ) to study the base flow and its instability in an electrically driven magnetohydrodynamic flow with a free Shercliff layer.
This manuscript presents a series of behaviours that trace back transitions between different dynamical regimes controlled by the characteristic length of velocity gradients
 $H^{\prime }$
and the corresponding Reynolds number
 $R^{\prime }$
(that will be precisely defined in § 3). Its layout is the following. After a short description of the experimental device in § 2, we evaluate, in § 3, the importance of inertial effects in our flow. Based on this, we determine a scaling
 $U_{0}$
for the azimuthal velocity in our system depending on the applied electrical current and magnetic field. We show the key role of the inertial magnetic thickness we introduced as the balance between the nonlinear advection and the Lorentz force. This scaling relies on a force-free region different from the classical one associated with Hartmann layers similar to, even if different from, the one in Duran-Matute, Trieling & van Heijst (Reference Duran-Matute, Trieling and van Heijst2011) and Pothérat & Klein (Reference Pothérat and Klein2014). It agrees with our measurements and is used to define the key non-dimensional numbers of our system. In § 4, we determine the time average of the axial velocity profiles and we identify the transition to the growth of the inertial magnetic thickness beyond the size of the apparatus gap. In § 5, we focus on the two dynamical regimes that we characterize. They are compared to former numerical studies by Zhao et al. (Reference Zhao, Zikanov and Krasnov2011) and Zhao & Zikanov (Reference Zhao and Zikanov2012) in § 6. Conclusions are drawn in the last section.
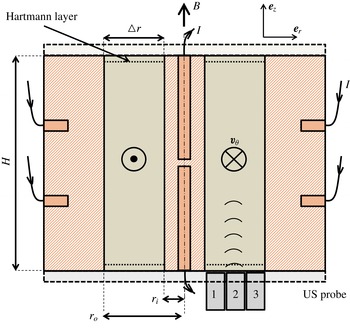
Axial cut of the experimental device. The liquid alloy (in yellow–green) is enclosed between two coaxial copper cylinders (in coppery colour shading) of radii
 $r_{i}=10~\text{mm}$
and
 $r_{o}$
respectively with
 $\unicode[STIX]{x0394}r=r_{o}-r_{i}=30~\text{mm}$
. The cylinder height is
 $H=120~\text{mm}$
and the aspect ratio is
 $\unicode[STIX]{x1D702}=H/\unicode[STIX]{x0394}r=4$
. The inner and outer cylinders, used as electrodes, are made of large masses of copper. A homogeneous current is provided by two inputs on the top and bottom of the inner cylinder and eight symmetrical departures on the outer cylinder. The top and bottom covers are electrically insolating. The three locations of the ultrasonic probes are situated on the bottom of the channel grey shading enumerated 1, 2, 3.

2 Experimental set-up
The experimental device, which is the same as the one described in Boisson & Aumaitre (Reference Boisson, Klochko, Daviaud, Padilla and Aumaitre2012) with a larger aspect ratio, is sketched in figure 1. In a Taylor–Couette-like geometry, an azimuthal Lorentz force is generated by a radial current
 $I$
and an axial magnetic field
 $\boldsymbol{B}$
in order to force a cylindrical layer of liquid metallic alloy: galinstan. Galinstan is made of 68.5 % of gallium, 21.5 % of indium, 10 % of tin. Its density is
 $\unicode[STIX]{x1D70C}=6.440\times 10^{3}~\text{kg}~\text{m}^{-3}$
, its kinematic viscosity is
 $\unicode[STIX]{x1D708}=3.73\times 10^{-7}~\text{m}^{2}~\text{s}^{-1}$
, its electrical conductivity
 $\unicode[STIX]{x1D70E}=3.46\times 10^{6}~\text{S}~\text{m}^{-1}$
. In the design of the experiment, a special care has been devoted to the homogeneity of the input current and magnetic field, without fluid motion. To this end, the inner and the outer cylinders used as electrodes are made of a large mass of copper. This is also why we divide the current departures into eight axisymmetric locations on the lateral surface for the outer cylinder and the current arrivals into two locations on the top and bottom of the inner cylinder. The resistivity of the overall device is less than
 $0.1~\unicode[STIX]{x1D6FA}$
and is mainly due to wiring and connectors. The plastic covers induce insulating boundary conditions where the Hartmann layers develop. The annular duct height is
 $H=120~\text{mm}$
, its width is
 $\unicode[STIX]{x0394}r=30~\text{mm}$
, the inner and outer radii are
 $r_{i}=10~\text{mm}$
and
 $r_{o}=40~\text{mm}$
respectively. This imposes the mean radius
 $\overline{r}=25~\text{mm}$
. The resulting aspect ratio is
 $\unicode[STIX]{x1D702}=H/\unicode[STIX]{x0394}r=4$
. Radial inhomogeneity of the applied magnetic field is less than 3 % within the fluid gap with an axial variation never exceeding 4.5 % and symmetric with respect to the mid-plane of the cell. The coil can produce magnetic fields up to 0.15 T, while the radial current crossing the cell can be controlled up to 100 A.
 $v_{\unicode[STIX]{x1D703}}$
and
 $v_{z}$
are respectively the azimuthal and axial velocity components. The spatial and temporal averages will be noted
 $\langle \cdot \rangle$
and
 $\overline{\cdot }$
respectively.
We used an ultrasonic Doppler velocimeter DOP3010 from Signal processing with two probes which extract the projected velocity along their axis from phase correlation of two ultrasound pulses (USP). The USP are scattered by galinstan oxides present in the media. The probes can be placed at different locations with slightly different angles, three locations at
 $r_{1}=16$
,
 $r_{2}=25$
and
 $r_{3}=34~\text{mm}$
with an angle of
 $0^{\circ }$
and one at
 $r_{2}=25~\text{mm}$
with an angle of
 $5^{\circ }$
with respect to the cylinder axis (
 $z$
). As
 $v_{\unicode[STIX]{x1D703}}$
is deduced from a geometric reconstruction based on the two ultrasonic (US) probes at different angles as detailed in Boisson & Aumaitre (Reference Boisson, Klochko, Daviaud, Padilla and Aumaitre2012), we only have access to its time average
 $\overline{v_{\unicode[STIX]{x1D703}}}(z)$
. Each profile is estimated from a sampling of 500 points along the
 $z$
axis. This corresponds to a spatial resolution
 $\unicode[STIX]{x0394}z=0.2~\text{mm}$
. We recorded at least 500 profiles per probe per measurement. The emitting frequency of the ultrasound is 4 MHz. The temporal resolution, defined by the time delay between successive pulses, ranges from
 $\unicode[STIX]{x0394}t\approx 0.2$
s to
 $\unicode[STIX]{x0394}t\approx 0.04$
s for faster regimes. This value depends on the maximum velocity of the flow, the sound speed in the material and the number of sound pulses needed to reconstruct the velocity profile. Multi-reflections of the ultrasound beam on the galinstan–polycarbonate interface add systematic noise to the first
 $15~\text{mm}$
of each velocity profile. It is worth noticing that the volume explored by the ultrasound beam is not constant along its emitting axis. There is a tightening of the beam up to the near-field limit at approximately
 $30~\text{mm}$
from the probe extremity, then the beam diverges with a diffraction angle of
 $2^{\circ }$
. This implies that the velocity values measured are actually integrated over a sampling volume centred on the beam axis. The width of this volume is about
 $3~\text{mm}$
at the mid-height of the cell.
Two types of runs were realized. The first one, named type I hereafter, is dedicated to the determination of the mean configuration of the secondary flow. The procedure is the following. We wait for the permanent regime to be established before recording
 $500$
profiles per probes, one probe after another. The length of the transient regime is appreciated using the direct visualization of the velocity profiles captured by the probes. The second kind of run, named type II, is dedicated to the dynamical behaviour. Here, we also wait for the permanent regime to be established and then we record alternately a profile on each probe. The procedure is repeated at least 500 times and up to 2000 times at a rate of approximately 10 profiles
 $\text{s}^{-1}$
in order to access the flow dynamics. Runs were performed at five different Hartmann numbers (
 $M=45,114,182,250,318$
), corresponding to a magnetic field
 $\boldsymbol{B}$
ranging from 0.02 to 0.14 T, to an electric current
 $I$
ranging from 1 A to 100 A and to Reynolds numbers ranging from 12 000 to 42 000. It has to be noted that, as we only have two probes, 2 different runs at the same forcing had to be performed to get the mean profile at the three radial locations. The probe at
 $r_{2}=25~\text{mm}$
is always operating and is used to validate the measurement reproducibility by comparing the mean profiles acquired by this probe during 2 similar runs.
3 Dimensionless numbers and scaling of the azimuthal velocity
Usually, for high magnetic field
 $M\gg 1$
, in the case where the inertial terms are negligible, the thickness in which electric currents are concentrated is deduced from the balance between the Lorentz force and the viscous drag. Thus, in this case, it reduces to the Hartmann layer
 $e_{H}=1/(\sqrt{\unicode[STIX]{x1D70E}/(\unicode[STIX]{x1D70C}\unicode[STIX]{x1D708})}B)$
. Neglecting Hartmann friction with respect to inertial effect is possible when its characteristic time scale becomes large with respect to the inertial one. Their ratio goes as
 $Re/M$
which is always larger than 30 in our high curvature geometry and for our range of Reynolds numbers. Thus, the main contribution balancing the Lorentz force in the Navier–Stokes equations is the advection term. In order to test that assumption, we adapted the dimensionless number introduced by Baylis & Hunt (Reference Baylis and Hunt1971) to a rectangular section. With our definition of the Reynolds and Hartmann numbers, the inertial term is predominant if:
 $$\begin{eqnarray}\frac{Re^{2}}{M^{4}}\times \frac{H^{4}}{16\unicode[STIX]{x0394}r^{2}\overline{r}^{2}}\gg 1.\end{eqnarray}$$
 $B_{a}=H^{4}/(16\unicode[STIX]{x0394}r^{2}\overline{r}^{2})$
is a dimensionless coefficient taking into account the geometry to weight the interaction parameter
 $N=M^{4}/Re^{2}$
. The influence of this coefficient can be important: for example, in the present work
 $B_{a}\approx 23$
and in the Zucchini device used by Stelzer et al. (Reference Stelzer, Cébron, Miralles, Vantieghem, Noir, Scarfe and Jackson2015a
)
 $B_{a}\approx 1.5\times 10^{-2}$
, explaining why both experiments explore completely different regimes even if both present comparable interaction parameters.
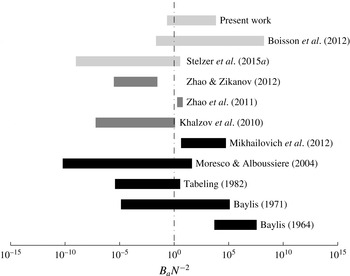
Comparison of the explored values of the dimensionless number defined in Baylis & Hunt (Reference Baylis and Hunt1971) which compares the inertial term to viscous term for different works. The reported studies are classified chronologically along the vertical axis. The black ones are experiments where the velocity measurements system is based on the electric potential. The dark grey ones are numerical studies. The light grey ones are experiments where the velocity measurements system is based on ultrasound.

In figure 2 we compare the explored ranges of
 $B_{a}N^{-2}$
in several studies using similar geometries to the one we present here. This figure illustrates that our investigation of flows where inertial effects can be predominant are done, for the first time to our knowledge, with direct ultrasound measurements. Indeed, Baylis (Reference Baylis1964) only focused on demonstrating the feasibility of using electric potential measurements to show instabilities in liquid metal flows. Later, Baylis (Reference Baylis1971) pointed out, with electric potential measurements, changes of the friction factor dependence that could be related to the transition between the inertial regimes to the viscous regimes, as his range of parameter
 $B_{a}N^{-2}$
spans on both parts. Tabeling (Reference Tabeling1982), Moresco & Alboussiere (Reference Moresco and Alboussiere2004) and Stelzer et al. (Reference Stelzer, Cébron, Miralles, Vantieghem, Noir, Scarfe and Jackson2015a
) focused on regimes where the viscous balance holds, while Mikhailovich et al. (Reference Mikhailovich, Shapiro, Sukoriansky and Zilberman2012) investigated the decay of mean velocity components and turbulent fluctuations. The numerical works of Zhao et al. (Reference Zhao, Zikanov and Krasnov2011) and Zhao & Zikanov (Reference Zhao and Zikanov2012), that we compare our results with, cover both regimes. The latest work can be compared to ours only in the more extreme regimes we explored, that is to say when
 $B_{a}N^{-2}<1$
.
Therefore, if we balance the Lorentz force by the inertial term in the Navier–Stokes equations, it follows:
 $$\begin{eqnarray}\frac{U_{0}^{2}}{H^{\prime }}\sim \frac{JB}{(\unicode[STIX]{x1D70C})},\end{eqnarray}$$
where
 $U_{0}$
is the mean azimuthal velocity scaling and
 $H^{\prime }$
is the characteristic length of the velocity gradient. In the following, we will refer to
 $H^{\prime }$
as the inertial magnetic thickness. We define the bulk as the region where the total current vanishes, letting the flow supposedly force free. Consequently, the characteristic length of the velocity gradient corresponds to the layer thickness where the electric currents are constrained. From these assumption and definition, we determine that radial current density
 $J$
in this layer corresponds to the total applied current over the section of fluid:
 $$\begin{eqnarray}J\sim \frac{I}{\tilde{r}H^{\prime }},\end{eqnarray}$$
with
 $\tilde{r}=(r_{i}r_{o})/\unicode[STIX]{x0394}r$
a dimensional parameter taking into account the variation of the current density imposed by the device geometry and
 $H^{\prime }$
is the thickness of the layer along
 $z$
where the current is present. This only holds if
 $H^{\prime }$
is smaller than
 $H/2$
. This definition reminds the Lorentz force diffusion length introduced by Duran-Matute et al. (Reference Duran-Matute, Trieling and van Heijst2011) and Pothérat & Klein (Reference Pothérat and Klein2014), the difference being that we consider here the total Lorentz force (including the gradient part due the radial currents).
Then, by replacing (3.3) into (3.2)
 $H^{\prime }$
cancels and the azimuthal velocity scales like:
 $$\begin{eqnarray}U_{0}\sim \sqrt{\frac{IB}{(\tilde{r}\unicode[STIX]{x1D70C})}}.\end{eqnarray}$$
Note that this scaling still holds for
 $H^{\prime }>H/2$
. In that case
 $H$
just replaces
 $H^{\prime }$
in (3.3) and (3.2).
From our definition of the bulk as the force-free region, using the fact that the bulk velocity is mainly in the azimuthal direction, we can infer that the induced radial current density is:
 $$\begin{eqnarray}\displaystyle J\sim \unicode[STIX]{x1D70E}U_{0}B. & & \displaystyle\end{eqnarray}$$
Combining (3.4) and (3.5) we obtain:
 $$\begin{eqnarray}H^{\prime }\sim \frac{1}{\unicode[STIX]{x1D70E}B^{3/2}}\sqrt{\frac{\unicode[STIX]{x1D70C}I}{\tilde{r}}}.\end{eqnarray}$$
This latter scaling is obviously valid only if
 $H^{\prime }\leqslant H/2$
. In our experimental set-up we observe that
 $H^{\prime }$
is large compared to the Hartmann layer thickness (
 $H^{\prime }\geqslant 40e_{H}$
) but it is rather comparable to the gap width (
 $0.25\leqslant H^{\prime }/\unicode[STIX]{x0394}r\leqslant 25$
) and to the cell height (
 $0.06\leqslant H^{\prime }/H<4.2$
). We thus expect important effects to be observed when
 $H^{\prime }$
becomes comparable to the system height,
 $H$
.
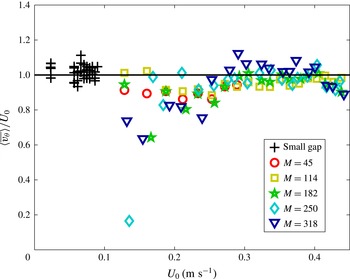
The ratio of the experimental mean azimuthal velocity value over the scaling
 $\langle \overline{v_{\unicode[STIX]{x1D703}}}\rangle /U_{0}$
as a function of
 $U_{0}$
. The crosses correspond to values extracted from the small gap device from Boisson & Aumaitre (Reference Boisson, Klochko, Daviaud, Padilla and Aumaitre2012) (corresponding to
 $\unicode[STIX]{x0394}r=12~\text{mm}$
and
 $\tilde{r}=93.3~\text{mm}$
), the other symbols correspond to the values measured in the larger gap presented here (corresponding to
 $\unicode[STIX]{x0394}r=30~\text{mm}$
and
 $\tilde{r}=13~\text{mm}$
). Symbols encode the five tested Hartmann numbers according to the legend.

We experimentally test these scaling laws. First we determine the mean azimuthal velocity value
 $\langle \overline{v_{\unicode[STIX]{x1D703}}}\rangle$
by reconstructing the azimuthal velocity profile from the mean profiles measured at
 $r_{2}$
with two different angles. Then we average this profile between
 $z_{1}=30~\text{mm}$
and
 $z_{2}=90~\text{mm}$
to focus on velocity values in the bulk. In figure 3, we compare the experimental azimuthal velocity extracted from the large gap device of figure 1 (coloured crosses) and from the one reported in Boisson & Aumaitre (Reference Boisson, Klochko, Daviaud, Padilla and Aumaitre2012) (black circles) to:
 $$\begin{eqnarray}U_{0}\approx 2.1\sqrt{\frac{IB}{(\tilde{r}\unicode[STIX]{x1D70C})}}-0.015.\end{eqnarray}$$
Regardless of the aspect ratios, the agreement is very good with only two adjusted numerical parameters. It thus justifies the scaling proposed in (3.4). The prefactor probably only depends on the experimental device specifications (ohmic resistance of the electric cables, cylinders composition and thickness, …) and the offset takes into account the viscous linear behaviour at low forcing. It has to be noted that
 $U_{0}$
depends both on
 $I$
and
 $B$
, in contrast with the work of Baylis (Reference Baylis1971) and Stelzer et al. (Reference Stelzer, Cébron, Miralles, Vantieghem, Noir, Scarfe and Jackson2015a
) for example. Because most of our runs are performed at
 $B_{a}N^{-2}\geqslant 1$
, inertial effects still holds, thus, in our case, the electric currents are not a constraint on the Hartmann layers. Then the relevant non-dimensional parameters are the Reynolds numbers which ranges from
 $12\,000$
to
 $42\,000$
and
 $R^{\prime }$
which is the Reynolds number based on the inertial magnetic thickness
 $H^{\prime }$
:
 $$\begin{eqnarray}R^{\prime }\equiv \frac{H^{\prime }U_{0}}{\unicode[STIX]{x1D708}}\equiv \frac{I}{\unicode[STIX]{x1D70E}\unicode[STIX]{x1D708}\tilde{r}B}.\end{eqnarray}$$
We must stress that
 $R^{\prime }$
and
 $H^{\prime }$
are both increasing functions of
 $I$
and decreasing functions of
 $B$
. Hence using
 $R^{\prime }$
or
 $H^{\prime }$
as control parameter produces qualitatively similar representations of our results. Moreover, when
 $M\rightarrow +\infty$
,
 $U_{0}\sim I/(\tilde{r}\sqrt{\unicode[STIX]{x1D70E}\unicode[STIX]{x1D70C}\unicode[STIX]{x1D708}})$
and the characteristic length is
 $e_{H}$
, then
 $R^{\prime }$
tends to the Reynolds number based on the Hartmann layer thickness. Moresco & Alboussiere (Reference Moresco and Alboussiere2004) showed that it also controls the transition to turbulence in high Hartmann regime (
 $M\gg 1$
).
4 Time-averaged measurements
4.1 Profiles of the axial velocity
We focus here on the topology of the secondary flow. In order to do so,
 $\overline{v}_{z}(r,z)$
is measured at the three radii
 $r_{1},~r_{2}$
and
 $r_{3}$
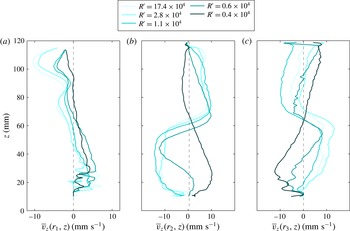
. Figure 4 represents time averaged
 $\overline{v}_{z}(r_{1},z)$
,
 $\overline{v}_{z}(r_{2},z)$
and
 $\overline{v}_{z}(r_{3},z)$
profiles for five different
 $R^{\prime }$
values ranging from
 $0.4\times 10^{4}$
to
 $2.8\times 10^{4}$
. Note that as the probes are situated at the bottom of the channel pointing in the upward direction, when
 $v_{z}>0$
the flow is going up. Measurements at
 $r_{2}$
and
 $r_{3}$
reveal the existence of two different types of velocity profiles, when
 $R^{\prime }$
is changed.
 $\overline{v_{z}}(r,z)$
profiles for different
 $R^{\prime }$
. (a) We display the mean profiles at
 $r_{1}=16~\text{mm}$
, (b) the ones at
 $r_{2}=25~\text{mm}$
and (c) the ones at
 $r_{3}=34~\text{mm}$
. The high-frequency spatial structures correspond to systematic noise, see text for details.

For
 $R^{\prime }\leqslant 0.5\times 10^{4}$
, in the lower half of the device, the fluid is going downward in the middle of the gap and upward along the inner and the outer walls. Symmetrically, in the upper half, the fluid flows upward in the middle of the gap and downward along the inner and the outer walls. The comparison with the numerical studies by Vantieghem & Knaepen (Reference Vantieghem and Knaepen2011) and Zhao & Zikanov (Reference Zhao and Zikanov2012) suggests the following interpretation. In their square duct aspect ratio, they found a secondary flow that consists of two pairs of large counter-rotating vortices, one pair near the inner wall and the other near the outer. In their simulations, the two vortices in the lower part of the duct have the same circulation sense, opposite to that of the two in the upper part. This configuration is compatible with the axial velocity profile at
 $R^{\prime }\leqslant 0.5\times 10^{4}$
presented in figure 4, if the vortex centres are located between
 $r_{1}$
and
 $r_{2}$
for the inner vortices and beyond
 $r_{3}$
for the outer vortices. This configuration is also compatible with the mechanism of generation of the Dean secondary flow due to inertial forces in a curved channel. Indeed, in these flows, the pressure gradient induced by the curvature is not balanced by the centrifugal force in the boundary layer, then it produces an inward flow at the top and bottom of the channel.
For
 $R^{\prime }\approx 1\times 10^{4}$
,
 $\overline{v}_{z}(r_{2},z)$
and
 $\overline{v}_{z}(r_{3},z)$
change drastically while
 $\overline{v}_{z}(r_{1},z)$
does not. In this case, in the lower half of the device, the fluid is going downward near the inner wall and in the middle of the gap and it is going upward near the outer wall. Symmetrically, in the upper half, the fluid is going upward in the middle of the gap and downward along the inner and the outer walls. This would suggest that the magnetic field shifts the mean position of the vortices centres toward the outer wall. They would then be located between
 $r_{2}$
and
 $r_{3}$
for the inner vortices, squeezing the outer vortices close to the outer wall. Nevertheless, according to simulations by Vantieghem & Knaepen (Reference Vantieghem and Knaepen2011), Zhao et al. (Reference Zhao, Zikanov and Krasnov2011), Zhao & Zikanov (Reference Zhao and Zikanov2012) it is likely that this observation of the mean flow traces back to a change in the secondary flow dynamics. In § 5, we will address the dynamical aspects of this transition.
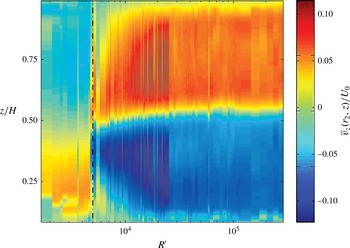
Intensity of the normalized axial velocity profile measured at
 $r_{2}$
 $\overline{v}_{z}(r_{2},z)/U_{0}$
in the
 $(R^{\prime },z)$
-plane smoothed over a window of size
 $\unicode[STIX]{x0394}z=2~\text{mm}$
. The dot-dashed line at
 $R^{\prime }=0.5\times 10^{4}$
represents the topological change in the mean flow.

In order to underline that the topological change is controlled by
 $R^{\prime }$
, we represent the
 $\overline{v}_{z}(r_{2},z)/U_{0}$
profiles (encoded in colour) as a function of
 $z$
and
 $R^{\prime }$
in figure 5. Despite some noisiness around
 $R^{\prime }\approx 5\times 10^{3}$
(dot–dashed line) where the transition occurs, the secondary flow topology evolution is well ordered by
 $R^{\prime }$
which appears to be a good control parameter for this transition. Observing the figure from large to small
 $R^{\prime }$
, we see that the amplitude of the secondary flow is rather stable for
 $R^{\prime }$
going from
 $2.5\times 10^{5}$
to
 $1.5\times 10^{4}$
. Below
 $R^{\prime }=1.5\times 10^{4}$
, the secondary flow shrinks and the extrema shift close to the centre of the cell. It is only below
 $R^{\prime }=5\times 10^{3}$
that the direction of the time-averaged flow measured by the probe changes. We focus on the origin of this transition in the next section.
4.2 Spatial fluctuations of the mean secondary flow and the signature of the ‘magnetic’ regime
As mentioned in § 4, in figure 5 we observe a reduction of the
 $\overline{v}_{z}(r_{2},z)/U_{0}$
amplitude for
 $R^{\prime }\leqslant 1.5\times 10^{4}$
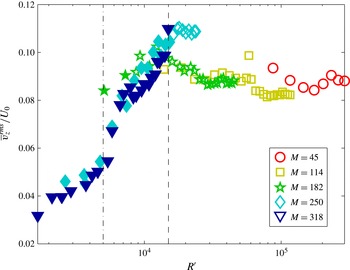
followed by a change of sign in the axial velocity. To quantify this reduction of the secondary flow, we compute the spatial root mean square of the mean velocity profile
 $\overline{v}_{z}^{rms}(r=r_{2})/U_{0}$
displayed in figure 6 as a function of
 $R^{\prime }$
. This represents the secondary flow amplitude normalized by the scaled azimuthal velocity. As we perceived previously, the secondary flow amplitude increases from
 $4\,\%$
for small
 $R^{\prime }$
to a maximum of
 $10\,\%$
of the azimuthal velocity at
 $R^{\prime }\approx 1.5\times 10^{4}$
. Beyond this value the amplitude stabilizes to values of the order of 8–9 %. It is well known that high magnetic fields, corresponding to low
 $R^{\prime }$
bidimensionnalize conducting liquid flows (Moreau Reference Moreau1990). In our case, it implies a decrease of axial flow intensity.
The amplitude
 $\overline{|v|}_{z}(r_{2})$
normalized by the scaling of the azimuthal velocity
 $U_{0}$
along
 $R^{\prime }$
. Empty symbols refer to the cases
 $H^{\prime }/\unicode[STIX]{x0394}r\geqslant 1$
called ‘hydrodynamic’ regimes and filled symbols correspond to
 $H^{\prime }/\unicode[STIX]{x0394}r\leqslant 1$
named ‘magnetic’ regimes. Symbols correspond to different Hartmann numbers.

Secondary flow behaviour thus shows the existence of two regimes: at high
 $R^{\prime }$
, where inertial terms dominates magnetic force, the secondary flow amplitude directly depends on the mean azimuthal velocity. We will refer to these cases as ‘hydrodynamic’ regimes. At the low
 $R^{\prime }$
cases that we associate with ‘magnetic’ regimes, the amplitudes of the secondary flow are drastically reduced and decrease faster than the azimuthal flow. In figure 6, we marked as
 $\circ$
regimes where
 $H^{\prime }$
is smaller than
 $\unicode[STIX]{x0394}r$
and as
 $+$
regimes where
 $H^{\prime }$
is greater than
 $\unicode[STIX]{x0394}r$
. We can see that all the
 $H^{\prime }/\unicode[STIX]{x0394}r\leqslant 1$
values are situated in the part of the curve where the amplitude of the secondary flow decreases. Therefore, this confirms that, in the so-called ‘magnetic’ regime, the relevant length for velocity gradients is
 $H^{\prime }$
. While when
 $H^{\prime }/\unicode[STIX]{x0394}r>1$
, the gap
 $\unicode[STIX]{x0394}r$
where centrifugal effects take place becomes the relevant length. As both
 $R^{\prime }(I,B)$
and
 $H^{\prime }(I,B)$
are biunivocal functions, this onset can be placed around
 $R^{\prime }\approx 1.5\times 10^{4}$
in our experiment (marked by the dash line in figure 6 where we also report the dot-dash line at
 $R^{\prime }\approx 5\times 10^{3}$
which corresponds to the change of sign in the time-averaged velocity of figure 5). This limit also corresponds to a drop in the secondary flow amplitude showing again that this change may be associated with another transition between two regimes.
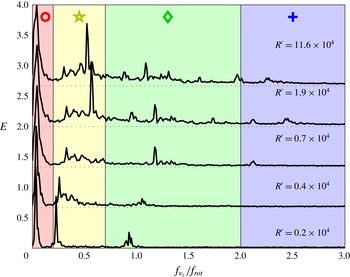
Temporal power spectral density. It is calculated in each axial sample probed by the US sensor and averaged over a spatial window
 $z\in [20,100]~\text{mm}$
. Five different
 $R^{\prime }$
are represented. Spectra are shifted for clarity. The coloured areas distinguish: in red, the lowest-frequency mode, named excursion; in yellow, the tilted mode 1; in green, the tilted mode 2; in blue, the high-frequency regime dominated by the noise. Symbols are used in figure 8 to refer to each of the domains.

5 Dynamical measurements
5.1 Spectral analysis
In this section, to characterize the dynamical properties of the transition at
 $H^{\prime }/\unicode[STIX]{x0394}r=1$
, we will rely on type II runs described in § 2. We only focus on the probe at
 $r=r_{2}$
. To get a better insight of the transition,
 $2000$
profiles are recorded consecutively with time sampling from
 $\unicode[STIX]{x0394}t\approx 0.2$
to 0.04 s for faster regimes. These longer measurements allow us to resolve low-frequency modes. In figure 7, we report power spectral density (PSD) for different
 $R^{\prime }$
. The PSDs plotted in figure 7 are obtained as follow. The PSD in time is computed at each point along the
 $z$
axis located between 20 and 100 mm and then these PSD are averaged together. In the figure, they are vertically shifted to improve clarity and the frequency is non-dimensionalized by the azimuthal rotation frequency (
 $f_{rot}=U_{0}/(2\unicode[STIX]{x03C0}\bar{r})$
). Starting from the PSD at the lowest
 $R^{\prime }=0.2\times 10^{4}$
, we can distinguish four regions and three distinct peaks.
-
(1) The region below
 $0.2f_{rot}$
coloured in red in figure 7, contains a low-frequency mode that we call excursion for a reason that will be clarified in the discussion of § 6. For
$R^{\prime }=0.2\times 10^{4}$
this is the most powerful peak.
-
(2) A second peak is included in the region between
$0.2f_{rot}$
and
$0.7f_{rot}$
(in yellow in figure 7). We call this the corresponding tilted mode 1. -
(3) A smaller peak appears between
$0.7f_{rot}$
and
$2f_{rot}$
(in green in figure 7). This mode is named the tilted mode 2 in the following. -
(4) The last region (in blue on figure 7) does not contain peaks anymore but reveals the level of the background velocity fluctuations.


This mode identification relies on the study of space–time diagrams such as the ones shown in figure 9 and on the corresponding time correlation function such as the ones reported in figure 10. At
 $R^{\prime }=0.2\times 10^{4}$
most of the energy is concentrated in the three peaks while it is much more distributed for higher
 $R^{\prime }$
. Nevertheless, the previous segmentation remains valid at higher
 $R^{\prime }$
although the relative energy contained in each region evolves. The background noise decreases drastically when
 $R^{\prime }$
is reduced. Regarding the dimensionless control parameter, we observed – as expected – a similar tendency with
 $H^{\prime }/\unicode[STIX]{x0394}r$
(not shown), without being able to determine if this number provides a better description.
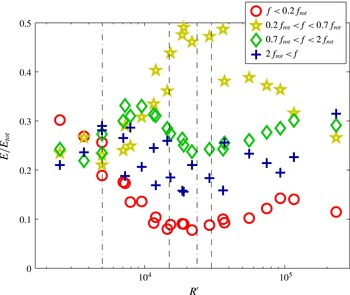
In order to quantify the relative weight of these modes, we extract the evolution of their relative energy in each region as a function of
 $R^{\prime }$
. This is done by integrating the PSD within the 4 different domains (
 $f<0.2f_{rot}$
,
 $0.2f_{rot}<f<0.7f_{rot}$
,
 $0.7f_{rot}<f<2f_{rot}$
,
 $2f_{rot}<f$
) and dividing it by the total energy of the spectra. Note that the results hardly depend on the exact values chosen for the limiting frequencies. In figure 8 we report the modes contribution along
 $R^{\prime }$
. First, as expected, the proportion of the high-frequency fluctuations, depicted by the blue crosses, remains almost constant with
 $R^{\prime }$
and so is probably due to higher-frequency incoherent fluctuations or to measurement noise. The lowest-frequency mode amplitude, depicted by the red circles, decreases when
 $R^{\prime }$
is increased until
 $R^{\prime }=1.5\times 10^{4}$
which also corresponds to
 $H^{\prime }/\unicode[STIX]{x0394}r=1$
. It prevails at small
 $R^{\prime }$
up to
 $R^{\prime }=0.5\times 10^{4}$
corresponding to the left dot-dashed line. Above
 $R^{\prime }=1.5\times 10^{4}$
, it remains nearly constant. The two other mode amplitudes (depicted by the yellow stars and the green diamonds for the tilted modes 1 and 2 respectively) start to grow and dominate around
 $R^{\prime }=0.5\times 10^{4}$
. The tilted mode 2 reaches its maximum around
 $R^{\prime }=10^{4}$
whereas the tilted mode 1 grows until
 $R^{\prime }\sim 2\times 10^{4}$
and decreases above
 $R^{\prime }=3\times 10^{4}$
. This last value coincides with values of the driving parameter around
 $H^{\prime }=H/2$
(shown by the right dashed line). Above this value, at higher
 $R^{\prime }$
, the force-free bulk definition we used becomes irrelevant. The tilted mode 1 remains the dominant mode until
 $R^{\prime }=10^{5}$
. Above this value of
 $R^{\prime }$
, the energies of the regions with peaks come from the background velocity fluctuations.
We have represented by vertical lines in figure 8 the different transitions mentioned above. From these observations, one may interpret the different regimes as follow. At high
 $R^{\prime }$
and
 $H^{\prime }$
the Lorentz force acts as it would do for the pressure gradient in the Dean configuration. At such large Reynold numbers, the flow is highly fluctuating. When
 $R^{\prime }$
is decreased and
 $H^{\prime }$
becomes of the order of
 $H/2$
inductive effects start to act and attenuate the fluctuations. The tilted mode 1 clearly becomes dominant in this regime. When
 $R^{\prime }$
is further reduced,
 $H^{\prime }$
becomes the smallest scale of the problem and the magnetic effects prevail and reduce the fluctuations. In the following we will focus on describing the different dynamical modes we have extracted in order to get their characteristics and relate them to the different thresholds we captured.
Integration of the PSD for four different domains normalized by the whole spectrum integral. Each domain corresponds to a dynamical mode:
 $f<0.2f_{rot}$
is the excursion mode (○),
 $0.2f_{rot}<f<0.7f_{rot}$
is the tilted mode 1 (
 $\star$
),
 $0.7f_{rot}<f<2f_{rot}$
is the tilted mode 2 (
 $\diamondsuit$
) and
 $2f_{rot}<f$
corresponds to the high-frequency fluctuations (
 $+$
). From left to right: the dot-dashed line at
 $R^{\prime }=0.5\times 10^{4}$
corresponds to the topological change of the mean flow (cf. figure 5), the dashed line at
 $R^{\prime }=1.5\times 10^{4}$
corresponds to the fluctuations reduction threshold observed on figure 6, the dot-dashed line at
 $R^{\prime }=2.5\times 10^{4}$
corresponds to the maximum amplitude of the tilted mode 1 and the last dashed line at
 $R^{\prime }=3\times 10^{4}$
, where the tilted mode 1 starts to decay, corresponds to the balance
 $H^{\prime }=H/2$
.

5.2 The dynamical modes characterization
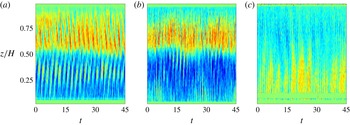
Figure 9 gathers the spatio-temporal diagrams of the axial velocity for three different
 $R^{\prime }$
values. Time is normalized by the rotation frequency as
 $t=\unicode[STIX]{x1D70F}f_{rot}$
. For the highest
 $R^{\prime }$
value (a) structures corresponding to tilted mode 1 drift from the top and bottom covers to the duct centre. These structures consist of alternate positive and negative axial velocities with a greater intensity in the upward direction in the upper part of the duct and in the downward direction in the lower part of the duct. Their axial wavenumber is
 $k=2\unicode[STIX]{x03C0}/H$
. When
 $R^{\prime }$
decreases, the structures are destabilized and their propagation is blurred as can be seen in figure 9(b). In addition, low-frequency modulations appear. In this particular regime (
 $R^{\prime }=0.8\times 10^{4}$
), there is coexistence of the three dynamical modes as we can see in figure 8. Finally for smaller
 $R^{\prime }$
values (figure 9
c) the amplitude of the flow is divided by 3 (for readability the colour bar has been changed). Propagative structures are not present any more. Instead, larger structures, evolving on long time scales without any axial propagation nor any noticeable periodicity are observed. This is why we refer to this mode as the excursion mode mentioned previously.
Spatio-temporal diagram of
 $v_{z}(r_{2},z,t)$
along the dimensionless time
 $t=\unicode[STIX]{x1D70F}f_{rot}$
. From (a) to (c)
 $R^{\prime }=2.3\times 10^{4}$
,
 $R^{\prime }=0.8\times 10^{4}$
and
 $R^{\prime }=0.3\times 10^{4}$
. The colour map is
 $[-60,60]~\text{mm}~\text{s}^{-1}$
for (a,b) and it is reduced to
 $[-20,20]~\text{mm}~\text{s}^{-1}$
for (c). The red (respectively the blue) corresponds to positive (respectively negative)
 $v_{z}(r_{2},z,t)$
values. (a) Structures are moving from the covers toward the duct centre. (b) These structures are destabilized by a low-frequency mode. (c) The low-frequency mode, which corresponds to slow excursions of positive or negative
 $\overline{v}_{z}(r_{2},z)$
, is observed.

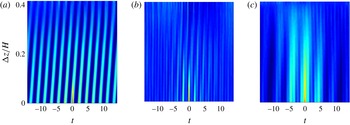
Time correlation function
 $\langle v(\unicode[STIX]{x1D6FF}z,t)\rangle$
along the dimensionless time
 $t=\unicode[STIX]{x1D70F}f_{rot}$
. (a)–(c)
 $R^{\prime }=2.3\times 10^{4}$
the tilted mode 1,
 $R^{\prime }=0.8\times 10^{4}$
combination of tilted mode 1, tilted mode 2 and excursion mode,
 $R^{\prime }=0.3\times 10^{4}$
excursion mode. The colour map is
 $[-0.2,1]$
for all graphs.

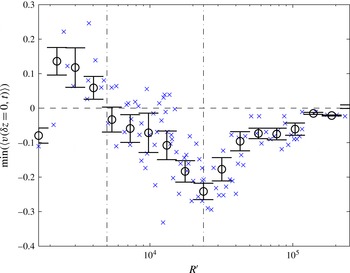
Minimum of the normalized self-correlation function in time for different
 $R^{\prime }$
as a measure of the contrast of the wavy pattern. The blue crosses identify the minimum of each run. Circles are locally averaged values with error bars standing for the local dispersion. The dash-dotted lines correspond to some of the thresholds displayed in figure 8. See text.

To better characterize these structures, we calculate the normalized time correlation for different distance intervals
 $\unicode[STIX]{x1D6FF}z$
between measurement points. As the primary structures are propagating toward the middle of the duct, we only calculate the normalized time correlation over
 $z\in [z_{1}=20~\text{mm},z_{2}=70~\text{mm}]$
:
 $$\begin{eqnarray}\langle v(\unicode[STIX]{x1D6FF}z,\unicode[STIX]{x1D70F})\rangle =\frac{1}{N}\mathop{\sum }_{N}^{1}\frac{v^{\prime }(z,\unicode[STIX]{x1D70F})v^{\prime }(z+\unicode[STIX]{x1D6FF}z,\unicode[STIX]{x1D70F})}{v^{\prime }(z,\unicode[STIX]{x1D70F})^{2}},\end{eqnarray}$$
where
 $t=\unicode[STIX]{x1D70F}f_{rot}$
is the dimensionless time,
 $v^{\prime }(z,\unicode[STIX]{x1D70F})=v(z,\unicode[STIX]{x1D70F})-\langle v(z,\unicode[STIX]{x1D70F})\rangle$
is the axial velocity fluctuation,
 $N=(z_{2}-z_{1})/\unicode[STIX]{x1D6FF}z$
is the number of intervals we can extract in the region of interest. The two-dimensional autocorrelation functions presented in figure 10 confirm the first observations made about the spectra of figure 7. At high
 $R^{\prime }$
(typically larger than
 $10^{5}$
, not shown), structure amplitudes are small compared to the noise level and are hardly visible. The structure amplitudes grow when the
 $R^{\prime }$
decreases and become clearly visible over the noise background as illustrated in figure 10(a). For even lower
 $R^{\prime }$
, half period structures and a low-frequency modulation appear as illustrated in (b). Finally the initial structures disappear completely and only the low-frequency mode subsists (figure 10
c). This observation confirms the results of figure 8, i.e. there are several exchanges of the predominant mode controlled by either
 $H^{\prime }$
or
 $R^{\prime }$
that lead to a reduction of the secondary flow and to a change of sign in the axial velocity. When the tilted modes become dominant (
 $1.5\times 10^{4}\leqslant R^{\prime }\leqslant 10^{5}$
), the phase velocity of the waves in dimensionless unit (given by the slope of the structure in figure 10) is stable with
 $R^{\prime }$
. It means that the dimensional phase velocity is proportional to
 $U_{0}$
. In addition, whatever the azimuthal velocity, since the axial wavenumber is approximately
 $kH=2\unicode[STIX]{x03C0}$
, the period is approximately
 $T=2/f_{rot}$
. This tends to prove that the corresponding structures are actually only advected by the mean flow.
To investigate the level of noise on the dynamical modes, we estimate the contrast of the pattern in figure 10. It can be obtained from the value of the first minimum of the normalized auto-correlation function in time (5.1) taken at
 $\unicode[STIX]{x0394}z=0$
. These values are represented as a function of
 $R^{\prime }$
in figure 11 where we can see the presence of a minimum around
 $R^{\prime }\approx 2.4\times 10^{4}$
. This regime corresponds to figures 9(a) and 10(a) and to the maximum of the tilted mode 1 contribution represented in figure 8. For
 $R^{\prime }\geqslant 2.4\times 10^{4}$
the evolution does not present any clear tendency. However, below
 $R^{\prime }\approx 5\times 10^{3}$
, the value of the first minimum is no longer negative. This is due to the superposition of the lowest-frequency mode (excursion mode) and the higher-frequency modes (tilted modes) in the correlation function. Below this point the fast oscillations are not intense enough compare to the slow oscillations to generate a negative first minimum in the correlation function. This fact confirms that the excursion mode is predominant below this point.
6 Discussion
Regarding our results and previous studies, it seems that we observe two different dynamical modes taking place respectively at low and moderate
 $R^{\prime }$
. In this section we compare our measurements to numerical studies of such forcing, especially Zhao et al. (Reference Zhao, Zikanov and Krasnov2011) and Zhao & Zikanov (Reference Zhao and Zikanov2012). Even if both used cells with aspect ratio different from ours – infinite cylinders in Zhao et al. (Reference Zhao, Zikanov and Krasnov2011) and square duct in Zhao & Zikanov (Reference Zhao and Zikanov2012) – they worked in the same range of parameters. According to their geometry and their range of Reynolds and Hartmann layer thicknesses, one can evaluate
 $B_{a}N^{-2}\geqslant 1$
,
 $R^{\prime }\sim 1500$
and
 $H^{\prime }/\unicode[STIX]{x0394}r\sim 0.15$
in the infinite annular configuration of Zhao et al. (Reference Zhao, Zikanov and Krasnov2011) and
 $B_{a}N^{-2}\leqslant 10^{-2}$
,
 $R^{\prime }\sim 1.8\times 10^{4}$
and
 $H^{\prime }=H/4$
in the square duct of Zhao & Zikanov (Reference Zhao and Zikanov2012). In the former configuration, i.e. when the conductive fluid is confined between two infinite concentric cylinders, axisymmetric perturbations consisting of counter-rotating toroidal vortices concentrated in the outer half of the channel are observed. The vortices are elongated in the axial direction due to the influence of the magnetic field which tends to suppress velocity gradients in its direction. Moreover, as the vortices are arranged side by side in the radial direction, they have elliptic shapes. The large axes of these ellipses are close to the magnetic field direction with slightly tilted angle toward the
 $r$
-direction. A key point here is that the counter-rotating vortices have two possible orientations, thus, the tilt angle can either be positive or negative. The Lorentz and centrifugal forces equally contribute to the two angle configurations and the selected mode depends on the initial conditions. Zhao et al. (Reference Zhao, Zikanov and Krasnov2011) also found that these modes present time oscillations. The dynamics involves the creation of a new vortex in the inner part of the channel whose centre shifts in the positive
 $r$
-direction and whose amplitude grows. Finally, the vortex intensity decreases and vanishes near the outer cylinder. This leads to the general shift of all vortices. For more details see Zhao et al. (Reference Zhao, Zikanov and Krasnov2011).
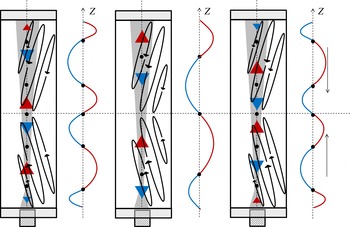
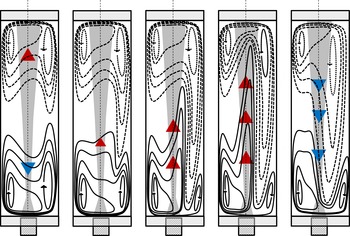
Schematic cut of the cell with a sketch of the mechanism involved in the tilted modes. The ellipses represent the stretched vortices and the grey area represents the volume investigated by the probe. Each right curve represents the corresponding velocity profile measured by the probe. The outer vortex is tilted in radial direction with a positive angle in the bottom part and a negative angle in the top part. The vortex is created in the bulk, then its centre shifts toward positive
 $r$
-direction. Then the vortices intensity decreases and they disappear near the outer cylinder.

This secondary flow is compatible with the structure dynamics of the tilted mode reported in the previous sections. Indeed if we project the velocity created by the tilted vortices along the cylinder axis, the combination of the centre shift in the positive
 $r$
-direction and the tilt would produce the pattern we observe in figure 9(a). As the forcing has a mirror symmetry with respect to the mid-plan normal to
 $\boldsymbol{e}_{z}$
, we expect that the flow respects this symmetry. Therefore the vortices in the upper and lower part of the duct must be tilted with opposite angles. Whatever is the tilted angle, the vortices centres always shift toward the positive
 $r$
-direction, therefore the sign of the tilt angle determines the sense of propagation of the structure we observe. Vortices rotating in the clockwise direction would create structures propagating in the downward direction, while those rotating in the anticlockwise direction would create structures propagating in the upward direction. This explains why we observe structures going in opposite sense (from the covers to the centre of duct).
In figure 12, we report the schematic evolution of the time oscillation of the vortices network and its consequences on the axial velocity measurements obtained by the probe at
 $r_{2}$
. As mentioned above, between infinite cylinders the tilt angle sign is determined by initial conditions. However, here the presence of top and bottom boundaries could remove the degeneracy of the system and force a tilt angle. Therefore, depending on the duct aspect ratio and on the Hartmann number opposite tilt angles can be observed. This ascertainment is reinforced by the results of Boisson & Aumaitre (Reference Boisson, Klochko, Daviaud, Padilla and Aumaitre2012) who, at moderate Hartmann number and in a smaller aspect ratio, observed travelling waves emerging from the duct centre and going toward the top and bottom boundaries. In this system the vortices would be tilted in a symmetrical manner than the one we presented in figure 12. This is compatible with the hypothesis that the duct geometry could influence the secondary mode topology. Another point that supports this assumption, is the fact that the thickness of the inertial magnetic layer
 $H^{\prime }$
is approximately half the height of the cell (
 $H/2$
) at the maximum of predominance of the tilted modes. Supposing that the tilted mode wavelength is determined by
 $H^{\prime }$
, the matching between those and the axial characteristic length would favour the emergence of the mode. In this description the tilted mode would be characteristic of small aspect ratio devices. Nevertheless we observed a discrepancy with the numerical results of Zhao et al. (Reference Zhao, Zikanov and Krasnov2011) concerning the oscillation period. Indeed they found a period an order of magnitude larger than the one we actually observe. This could be due to the different aspect ratios which would modify the dynamics. Moreover we observed that the frequency oscillation is
 ${\sim}0.5f_{rot}$
in the parameter range where these tilted modes prevail, thus is growing linearly with
 $Re$
in contrast to the low frequency that Zhao et al. (Reference Zhao, Zikanov and Krasnov2011) estimated. That is why we conclude that the vortices shift we observed is somehow induced by the mean flow advection leading to a smaller period and a linear dependence on Re.


The low-frequency mode – called the excursion mode – represented in figure 9(c) corresponds to excursions of positive velocity from the lower part to upper part of the duct (from
 $t\approx 20$
to
 $t\approx 30$
) and the opposite (from
 $t\approx 30$
to
 $t\approx 40$
). That is to say to the expansion of one of the two large vortices near the outer wall and its drift toward the opposite half of the duct. These slow events, illustrated in figure 13, are accompanied by the growth of the kinetic energy and end by its decrease. This corresponds very well to the description of the first axisymmetric instability Zhao & Zikanov (Reference Zhao and Zikanov2012) found numerically in a square duct. We have observed these excursion modes for
 $Re=17\,000$
with our definition which corresponds to half the threshold given by Zhao & Zikanov (Reference Zhao and Zikanov2012). However, as the present aspect ratio is greater than that of the square section, a different threshold is not necessarily surprising. The dimensionless duration of these slow events is approximately
 $\unicode[STIX]{x1D70F}=30$
, which is less than, but of the same order of magnitude as, the one calculated by Zhao & Zikanov (Reference Zhao and Zikanov2012) and that corresponds to the low-frequency peak we observed in the figure 7. Therefore we can assume that the low-frequency mode we captured corresponds to the first axisymmetric instability described in Zhao & Zikanov (Reference Zhao and Zikanov2012). Our interpretation of the apparition of these excursion modes is related to the inertial magnetic layer being smaller that the gap. In these regimes the competition between the geometrical effects favouring structures with characteristic lengths of the order of
 $\unicode[STIX]{x0394}r$
and the induction effects generating structures at the smaller length
 $H^{\prime }$
. Then, we could assume that the adaptation of the magnetic structures to the cell would create the excursion mode until it can actually fit the geometry. In this description the excursion mode would be characteristic to small aspect ratio devices. It has to be noted that the numerical simulations of Zhao & Zikanov (Reference Zhao and Zikanov2012) were performed at much lower
 $B_{a}N^{-2}$
values that here. However, we only observe excursion modes for high Hartmann numbers, that is to say for the lower part of our
 $B_{a}N^{-2}$
range where the inertial effects begin to be weak.
7 Conclusion
In this paper we have presented experimental results obtained in
 $\unicode[STIX]{x1D702}=O(1)$
aspect ratio duct forced electromagnetically at moderate Hartmann numbers. In most of our regimes, the inertial effects cannot be neglected. It constitutes a step toward the understanding of the mechanisms in action when a magnetic field yields to two-dimensional flows of conducting fluids. The measurements were performed using ultrasound probes at different angles and different radial positions. First we proposed a scaling for the azimuthal velocity which depends on the product between the electric current and the magnetic field suggesting that the current is not restricted to the Hartmann layer. Therefore, we constructed an intermediate layer,
 $H^{\prime }$
– named the inertial magnetic thickness – that depends on the electric current and on the magnetic field where the electric current is concentrated. This layer is larger than the laminar Hartmann layer. We suggest that this characteristic length controls the flow structure. Therefore, we propose that the inertial magnetic thickness we introduced in this article could be applied to all kinds of MHD flow regimes at moderate Hartmann numbers and where the inertial effects cannot be neglected, as the controlling parameter of the dynamics. The Reynolds number
 $R^{\prime }$
constructed from
 $H^{\prime }$
coincidently have the same
 $I$
and
 $B$
dependencies than the one introduced by Moresco & Alboussiere (Reference Moresco and Alboussiere2004) even if the latter relied on a balance between the Lorentz force and viscous dissipation while in our case inertial terms are used to balance the Lorentz force. To establish our scaling, we have assumed the existence of a force-free bulk where the induced current are proportional to
 $\unicode[STIX]{x1D70E}U_{0}B$
. This assumption seems corroborated by our results that present clear transitions controlled by
 $H^{\prime }$
and
 $R^{\prime }$
. Nevertheless an explicit test would require measurement of the azimuthal velocity field which is clearly out of reach in the present geometry.
Our work suggests that the time-averaged secondary flow is composed of two sets counter-rotating vortices arranged radially. We also observe a transition between two regimes of the secondary flow. They seem controlled by both
 $H^{\prime }$
, the inertial magnetic thickness and
 $R^{\prime }$
– a Reynolds number based on
 $H^{\prime }$
. The flow topology in the second regime is difficult to determine directly from the time-averaged measurements, however our dynamical studies suggest a probable scenario. The magnetic field diminishes velocity gradients in its direction (the axial direction) while inertial forces enlarge these gradients in the radial direction. For large
 $R^{\prime }$
(high centrifugal force), we measure the recirculation induced by the inner vortices. This recirculation scales with the Reynolds number, while in the ‘magnetic’ regime it varies nonlinearly with respect to the Reynolds number.
This means that the magnetic field reduces velocity gradients in its direction. For small
 $R^{\prime }$
(high magnetic field), the secondary flow in the middle of the duct has a very small contribution to the time-averaged secondary flow. The excursion of the outer vortices characterizing the first axisymmetric instability described by Zhao & Zikanov (Reference Zhao and Zikanov2012) seems responsible for the change of sign we observed on the time-averaged mean flow.
Finally, the first dynamical mode we observe must be vortices tilted in the radial direction and advected by the mean flow. These vortices, present in the unbounded cylinder calculations of Zhao et al. (Reference Zhao, Zikanov and Krasnov2011), travel radially and give birth to the axial velocity waves observed here and in Boisson & Aumaitre (Reference Boisson, Klochko, Daviaud, Padilla and Aumaitre2012). Depending on the tilt angle, we can observe a propagation in the sense
 $z>0$
or
 $z<0$
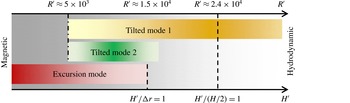
. The tilted modes seem to be enhanced when the inertial magnetic layer thickness is between the gap width and half the cell height in such a way that the magnetic effects match the centrifugal and inertial effects in this geometry. When the inertial magnetic layer is increased further, the induction cancels out and the magnetic strength cannot sustain these structures out of the three-dimensional turbulent fluctuations any more. Contrary to the excursion mode the relevant dimension is the cylinder height in this mode. Therefore, as we have summarized in figure 14, we have attributed the presence of these two dynamical modes to the experiment aspect ratio which shares geometrical features with the infinite cylinder but also with the square section duct depending on which geometric characteristic length matches the inertial magnetic layer thickness. As mentioned before, our aspect ratio and the range of parameters we explored are somehow different from the ones of Zhao et al. (Reference Zhao, Zikanov and Krasnov2011), Zhao & Zikanov (Reference Zhao and Zikanov2012). A more accurate comparison would require dedicated simulations that could actually also be used to validate the existence of a force-free bulk.
Diagrammatic sketch of the transitions involved in the experimental set-up as function of the pertinent control parameter
 $R^{\prime }$
and the characteristic length scale
 $H^{\prime }$
, the inertial magnetic layer.

Acknowledgements
The authors would like to thank L. Cherfa, V. Padilla for their help in the experimental design, the laboratory PhotoRB for its help on the first visualization process, Y. Bertrand and O. Cadot for helpful discussions. We also would like to thank the anonymous reviewers for their constructive comments, which helped us to improve the manuscript.