I. INTRODUCTION
X-ray diffraction (XRD) has long been one of the most important tools used for the identification and analysis of minerals (Buerger, Reference Buerger1942; Bloss, Reference Bloss1971). For samples greater than roughly 1 g, the automated powder diffractometer has been the principal instrument used for XRD data collection. Data obtained in this manner can be applied not only for routine phase identifications but, when combined with powerful peak-deconvolution approaches (e.g. the Rietveld method; Rietveld, Reference Rietveld1969), are also capable of producing detailed crystal-structure information, including related crystal symmetry, unit-cell dimensions, fractional coordinates, thermal-displacement factors, etc. (Young and Wiles, Reference Young and Wiles1982). In situations where far less material is available for analysis (e.g. <0.1 g), XRD studies have relied upon powder X-ray diffraction (PXRD) cameras, including those that employ Debye–Scherrer (DS; single-axis) and Gandolfi (two-axes) motion. These cameras have traditionally employed the now defunct direct-exposure film (DEF) as the recording medium. Recently, considerable research has gone into developing alternative technologies. One such technology is photo-stimulable phosphor, allowing reusable image-plates (IPs) to replace DEF (Lee et al., Reference Lee, Windover, Doxbeck, Nielsen, Kumar and Lu2000; Gales & Bentley, Reference Gales and Bentley2004), whereas another is the one-dimensional (1D) position sensitive detector (PSD) in DS geometry (Ballirano, Reference Ballirano2003). Since the deployment of this new detection technology into the XRD community, a re-emergence of film-based techniques (e.g. Norby, Reference Norby1997; Ballirano, Reference Ballirano2003; Zhukhlistov et al., Reference Zhukhlistov, Nickolsky, Zvyagin, Avilov, Kulygin, Nicolopoulos and Ochs2004) has developed.
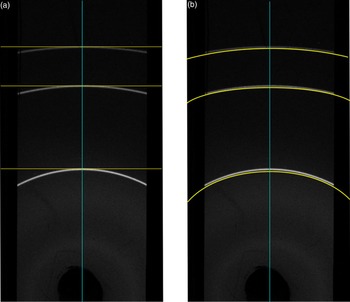
There are two main procedures involved in converting a two-dimensional (2D) diffraction image collected on a curved IP (CIP) into a 1D digital diffractogram. Of these two integration types, one method consists of orthogonal integration [OI; Figure 1(a)] which provides the normalized intensity of pixels strictly orthogonal to the central mirror plane of the diffraction image (parallel to the length of the IP) shown in Figure 1. The second integration type consists of the integration of pixels coincident with the 2θ-dependent curvature of the Debye-ring on the diffraction image [Figure 1(b)]. While both consist of the summation and normalization of pixel intensities (referred to here as integration) they differ greatly in integration geometry.
The integration vectors (yellow lines) for OI (a) perpendicular to the central mirror plane of the diffraction image (green vertical line) and 2θ-dependent integration (b) 2θ-dependent integration avoids the asymmetrical peak-shape that arises from OI.

Several software packages exist in the literature and are available for download from the internet that collapse a 2D image into a 1D diffractogram via the two integration methods described earlier. OI is championed by an image-reduction procedure outlined by Barwood (Reference Barwood1997) which uses the public domain software Image J. Similar to Image J is MAUD (Lutterotti et al., Reference Lutterotti, Gualtieri and Aldrighetti1996) which uses an Image J-based integration routine. However, OI disregards the 2θ-dependent curvature of the Debye-ring. Thus, masking an area wider than 1 or 2 mm along the central mirror plane of the image results in a 2θ-dependent asymmetric peak-shape from the inclusion of pixels on the “tails” of the Debye-ring that do not strictly correspond to the diffraction angle to which they are attributed. Nonetheless, OI methods have proven successful in the experiments of Norby (Reference Norby1997) who used a 3 mm-wide mask on XRD data collected on α-quartz using the flat-plate technology along with making suitable corrections for the non-linear nature of the full-width at half-maximum (FWHM), step-size, and zero correction. In DS-type geometry, the radius of a Debye-ring is reduced at low (<60) or high (>120) angles 2θ to such an extent that the pixels positioned tangential to a Debye-ring along the central mirror plane of the image that represent the true peak position are significantly reduced in number. With such a reduction in contributing pixels, the adverse effects of single-crystal X-ray diffraction (SXRD) spots, scratches, blemishes, or discontinuous diffraction lines on the quality of the output diffractogram given from OI may be enhanced. While an abundance of software for the conversion of flat-plate diffraction data into a 1D diffractogram is available [e.g. Datasqueeze, Two2One (Vogel, Reference Vogel, Boldvreva and Dera2001), Powder3D IP (Rajiv et al., Reference Rajiv, Hinrichsen, Dinnebier, Jansen and Joswig2007), XRD2DScan (Rodriguez-Navarro, Reference Rodriguez-Navarro2006) DIIS (Petrus et al., Reference Petrus, Ross and McDonald2012), and the popular Fit2D (Hammersley et al., Reference Hammersley, Svensson, Hanfland, Fitch and Hausermann1996)], only DIIS – a relatively new package presented in Petrus et al. (Reference Petrus, Ross and McDonald2011), and XRD2DScan are capable of 2θ-dependent integration of CIP diffraction data in a fully quantitative manner.
The primary thrust of the present contribution is to evaluate the accuracy and precision of XRD data produced through collapsing 2D CIP diffraction data into a 1D digital diffractogram and its suitability for being refined through the Rietveld method. To accomplish this, we used the DIIS program to convert diffraction data given from standard reference materials (SRM) 640c (for d-spacings) and 676a (for intensities). To compliment the XRD data given from SRM640c and 676a, we compared XRD data given by this method to previously acquired XRD data given by SXRD from a clinopyroxene and garnet. The major element compositions were determined from grain mount on a Cameca SX100 EMP, operating at 20Kv for all elements with counting times of 20 s for Si, Al, Mg, Fe; 30 s for Cr and Ca; 40 s for Mn; and 60 s for Ti and Na.
II. MATERIALS AND METHOD
A. The IP and IP scanner
The experiments described here were carried out using a FUJI BAS-SR 2400 imaging plate (SRIP) and scanned with a BAS 2500 scanner. The construct, dynamic quantum efficiency, dynamic range, and principles upon which IP technology is based have been discussed in detail by Amemiya & Miyahara (Reference Amemiya and Miyahara1988), Amemiya (Reference Amemiya1995), Lee et al. (Reference Lee, Windover, Doxbeck, Nielsen, Kumar and Lu2000), and Otto et al. (Reference Otto, Hofmann and Schroder2002) among others. A notable deficiency of employing the SRIP in any application is the presence of the 10 µm protective Mylar coating on its surface which is limited to only 26% transmission at 1.5 KeV, which necessarily results in a compromise between the sensitivity and resolution of the IP as a recording medium (Gales & Bentley, Reference Gales and Bentley2004). For a comprehensive review of current IP models and their point spread function within the photo-sensitive phosphor (PSP) layer of the IP, combined with the effects imposed from employing different IP-scanner types the reader is referred to Bourgeois et al. (Reference Bourgeois, Moy, Svensson and Kvick1994).
B. X-ray diffraction
The SXRD data were collected on a Bruker Apex II three-circle diffractometer operated at 50 kV and 30 mA using graphite filtered MoKα radiation with a detector-to-sample distance of 5.95 cm. Diffraction data were collected with 0.5° ω scans at different φ settings using the program SAINT. An empirical absorption correction calculated using SADABS (Sheldrick, Reference Sheldrick1996) was applied.
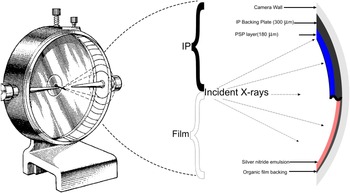
Powder diffraction data were acquired with a Gandolfi camera of radius 114.6 mm, a Phillips PW 1870 generator operating at 40 kV and 30 mA, and Ni-filtered CuKα avg radiation (λ = 1.5418 Å) with 4–6 h exposure. To reduce the scatter of X-rays caused by air (thus improving the measured peak-to-background ratio), the Gandolfi camera chamber was evacuated to an absolute pressure of 4 kPa (i.e. 0.04 atm) via an Edwards 5 CFM rotary vein pump. The incident X-ray beam was collimated using either a 300 or 500 µm pin-hole collimator. As shown in Figure 2, the IP is inserted in the Gandolfi camera with a Straumanis-type configuration, where the longitudinal ends of the IP meet approximately at the 12 o'clock position inside the camera cylinder.
(Color online) (a) The Straumanis configuration of the IP inside a diffraction camera and the intersection of a diffraction cone with the camera (see text). (b) A comparison between the properties of the IP and the defunct DEF. Since the thickness of the IP backing is significantly greater than that of DEF, a correction for a reduction in camera radius of 300 µm is applied in DIIS.

The combination of an evacuated Gandolfi camera and highly sensitive IP presented unexpected complications that needed to be considered and resolved. First, the medium used to position the material to be analyzed in the X-ray beam (a glass fiber) was itself found to contribute diffraction lines at 1.62, 1.84, and 2.55 Å. This may seem surprising to many as fibers like these have long been used by crystallographers to collect XRD crystallographic data. However, the phenomena of both the fiber and adhesive (petroleum jelly, epoxy, etc.) used to fix the grain on the fiber contributing to the diffraction pattern has been noted in several cases (e.g. Palmer, Reference Palmer1997; Matsuzaki and Shinoda, Reference Matsuzaki and Shinoda2004). After extensive testing of assorted drawn glass, fiber optic cable, along with natural and synthetic brush fibers, none were found to be completely X-ray amorphous. The presence of weak diffraction lines contributed by the glass fiber is likely attributable to the increased sensitivity of the IP which is further enhanced by the high degree to which the camera chamber was evacuated. In the end, glass fibers found to contribute the fewest and weakest XRD lines selected to be used in experiments in this study were from a conservator's brush. These particular fibers are composed of silica glass and measure ~70 µm in diameter and are typically cut to ~0.5 cm in length. These fibers have a very high degree of consistency in terms of fiber shape and diameter. When drawn further under heat, the diameter was reduced to as small as ~15 µm. The pronounced reduction in mass of the glass fiber present in the incident X-ray beam reduces the presence of reflections arising from the fiber such that they are virtually invisible in the output diffractogram.
During assessment of fiber material several different adhesive materials used to fasten the grain to the fiber were also investigated. All were found to produce a gradual, low-angle (~10–20°2θ CuKα) elevated background that is typical of a genuinely X-ray amorphous material. In light of this, a quick drying (working time ~15 s), acetone-soluble, fingernail hardener was used. Five-minute epoxy was also tested and found to work well, providing for a longer working time (~5 min), although no compounds suitable for the dissolution of this adhesive which are non-toxic to the user and non-destructive to the material being analyzed are currently known.
C. Integration and digitization of IP data
The mathematical rationale for 2-θ dependent integration and digitization of diffraction data collected with a CIP has been adequately described by O'Neill et al. (Reference O'Neill, Nguyen and Jeanloz1993) in terms of the intersection of a cone (of diffraction) with a cylinder (camera chamber). A succinct historical review of digitization and integration of CIP diffraction data has been given by Palmer (Reference Palmer1997). Although the methodology has evolved with time, the fundamental objectives have remained unchanged; namely that the digitization procedure should maintain the spatial precision and resolution of the film or IP data. Since the grain size of the BaFBr:Eu2+ in the PSP layer of the IP is on the order of 10 µm, a potential step-size of 0.01°2θ in a 114.6 mm radius camera is theoretically achievable. The BAS-2500 scanner used here, however, was capable of only 508 DPI giving a step-size of 0.05°2θ or 50 µm image resolution. Currently, FUJI-film manufactures an alternative system, the BAS-5000, that is capable of 25 µm resolution or a 0.025°2θ step-size in a 114.6 mm camera.
Gales and Bentley (Reference Gales and Bentley2004) have shown that the dynamic range of the IP is linear over five orders of magnitude, far exceeding that of DEF, which they report has a dynamic range of less than two orders of magnitude. The wide dynamic range of the IP permits detection of very weak diffraction lines simultaneously with the detection, but non-saturation, of very intense diffraction lines. Most IP scanners allow the user to choose between 8- and 16-bit color depths. For a black and white image, an 8-bit image results in 28 (256) shades of gray digitizing a continuum of gray-scale shades into only black, white, and 254 discreet shades or intensity levels. A similar process takes place when scanning an image with 16-bit color depth, except now the gray scale continuum is digitized into 216 (65 536) discreet shades resulting in a dramatic increase in intensity resolution.
D. Peak position, intensity, and shape measurement
The accuracy and precision of the position, intensity, and shape for selected peaks given from integrated XRD data were assessed using the software package X'pert Highscore Plus Version 3.0.5. The background for all patterns was determined and subtracted using a flat background setting plus a fifth-order polynomial routine given by Sonneveld & Visser (Reference Sonneveld and Visser1975). To obtain d-spacing data, preliminary peak positions were first visually estimated and manually inserted, then refined using the pseudo-Voigt (pV) peak-fit routine available in X'Pert Highscore Plus.
To evaluate the accuracy of relative intensities (I/I 0), the peak search parameters were restricted to a minimum significance of 80%, cycled until all calculated shifts were <0.5 times the estimated standard deviation, converging with an average peak-fit error of 2.8%. Overlapping Kα 1 − Kα 2 (resulting from the use of non-monochromatic X-radiation) peaks present below ~40°2θ (Cu radiation) are not resolvable and as such, corresponding intensities for diffraction peaks below this angle are considered to be weighted Kα 1 − Kα 2 combinations (weight of 2/3:1/3). In light of this, the Kα 2 contributions were mathematically subtracted using the method of Ladell et al. (Reference Ladell, Zagofsky and Pearlman1975).
Through Rietveld refinement, the pV function was found to adequately describe the peak shape. The pV function describes peaks as a mixture of the Lorentzian (L) and Gaussian (G) peak functions (e.g. Young and Wiles, Reference Young and Wiles1982) given as:
 $$\,pV=nL+\lpar 1 - n\rpar G$$
where n is a mixing parameter that describes the amount of Lorentzian component. Errors reported by the Highscore Plus software for the peak shape and position refinements were <0.00005 Å and are therefore not reported.
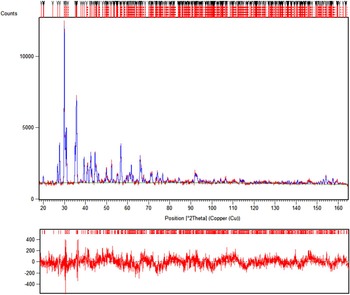
(Color online) The Rietveld refinement of diopside with agreement- and crystallographic parameters given in Table V with the residual (observed – calculated) pattern shown below the diffractogram.

E. Materials analyzed
National institute of standards and technology (NIST) SRM640c (Si) and SRM676a (Al2O3) were evaluated for line-positions and relative-intensities, respectively. These standards were chosen because of their well-established crystallographic properties, strongly diffracting character and absence of preferred orientation effects. Following assessment of the IP digitization of diffraction data given from SRM640c to 676a, we performed XRD analysis of a garnet and clinopyroxene for which we acquired SXRD data previously. Both the garnet and clinopyroxene were derived from a heavy mineral concentrate used for kimberlite exploration.
III. RESULTS AND DISCUSSION
A. NIST SRM640c
Silicon, SRM640c, is cubic, space group Fd-3 m. There is only one symmetrically unique Si atom, positioned at the 8a (1/8, 1/8, 1/8) such that the unit-cell dimension is the only variable crystallographic parameter. Given that the chemistry and fractional atomic coordinates of SRM640c are fixed, variation in diffraction-peak positions must necessarily be a function of the unit-cell edge. To avoid the geometrically imposed crystallographic restriction of relative peak positions by the unit-cell edge dimension, all peaks were individually located and refined with respect to position and shape according to the procedure outlined in Section II-D. Because the unit-cell edge for SRM640c is reported with femtometer precision at 5.431195(1) Å, well beyond the resolution of this technique (~ ±0.001 Å) all certified SRM640c peak positions have an effective error of zero. Consequently, the IP resolution is the limiting factor.
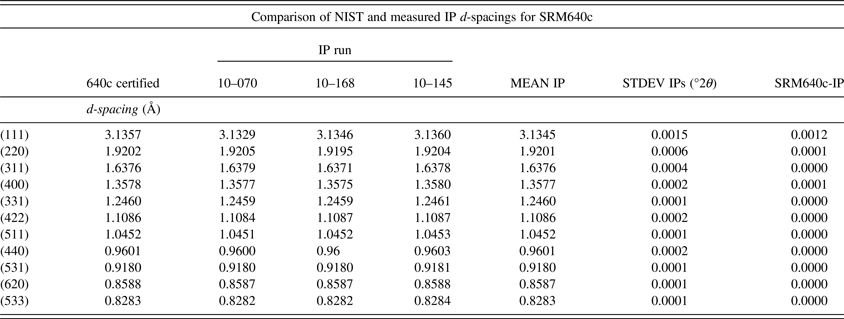
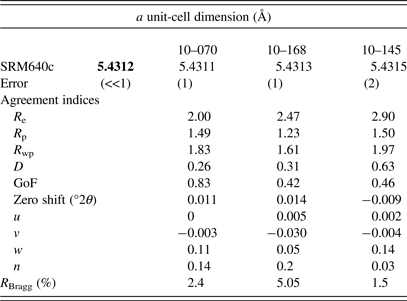
Table I shows in Å certified d-spacings for the 11 peaks in SRM640c with the measured positions given from three experiments. Comparison of the mean of three experiments to the certified values shows the largest discrepancy (0.0012 Å) is for the lowest angle (111) peak. The (111) reflection also exhibits the largest standard deviation (σ), similar in magnitude (0.0015 Å). With decreasing d-spacing the errors and σ decrease dramatically becoming significant in the fourth decimal place (i.e. error = 0.0004 Å or less, σ = 0.0005 or less) for those reflections with d-spacing ~2 Å. For reflections with d-spacing <2 Å, the discrepancy and σ approach 0. Full profile refinement of three SRM640c IP experiments gave unit-cell dimensions comparable to the certified value. All three experiments gave unit-cell dimensions that differed by no more than 0.0003 Å.
List of 11 certified peak positions (d-spacing in Å) for SRM640c compared to positions derived from the observed data.

Note: To avoid symmetry-imposed restriction on peak position (see text), each peak was manually located and fit rather than refined from a unit cell.
Table II gives agreement and instrumentation parameters given from the refinements of the XRD data along with instrument parameters such as the u, v, and w (Caglioti et al., Reference Caglioti, Paoletti and Ricci1958) and peak shape (n). Low values of n indicate a dominant Lorentzian component in the pV function describing the peak profile.
The certified unit-cell dimension (bold) for SRM640c compared to refined unit-cell dimensions for the three experiments carried out on SRM640c with instrument and agreement parameters (after Young, Reference Young1993).

B. NIST SRM676a
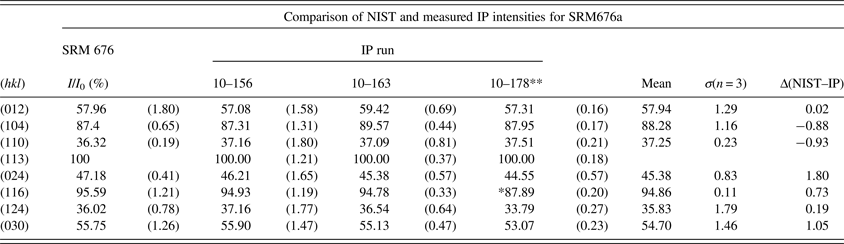
Table II shows the intensities measured from three IP experiments for SRM676a, compared to certified values given for the seven peaks (excluding the 100% peak). For five of the seven peaks, the σ among the three measurements is greater than the absolute difference between the measured and certified values, particularly when the error reported by NIST is considered. Good reproducibility among intensity measurements is particularly sensitive to the background subtraction routine used. For this reason, we used an internally consistent set of background subtraction parameters applied to all measurements. Excellent reproducibility for intensity measurements, as reflected in Table III by the small σ among individual experiments while adequate accuracy is shown by the small difference in relative intensity between the measured values and those certified by NIST (i.e. <2% relative intensity in both cases). Table III also shows the mean FWHM for all eight of the certified peaks for each experiment. Experiment 10–156 gives a slightly larger FWHM owing to the use of a larger 500 µm collimator (not shown).
Certified relative intensities for SRM676a compared to relative intensities extracted from three XRD experiments on this material. Percent RSD are given in parentheses. * not included in average, ** a 500 µm collimator was used in this experiment.

C. Natural specimens
To demonstrate the broad applicability of the IP digitization technique in producing a quality powder diffraction pattern from a single minute grain, a natural cpx and garnet were analyzed. PXRD data were refined in accordance with the findings of Ballirano (Reference Ballirano2003) who showed the relevance of assigning an oxygen ionization state to improving the agreement parameters. Indeed, introducing O2− rather than using neutral O atoms significantly improved the agreement parameters in our experiments, reducing the R Bragg from ~5 to <3. Although it is sometimes difficult to compare directly the results given from SXRD and PXRD because of the known limitations of PXRD, Tables IV and V provide a comparison between the refined SXRD and PXRD data given from both a garnet and cpx, the results of which are discussed more extensively below. Despite the increased structural resolution SXRD, all thermal parameters were refined as Biso to provide comparable results.
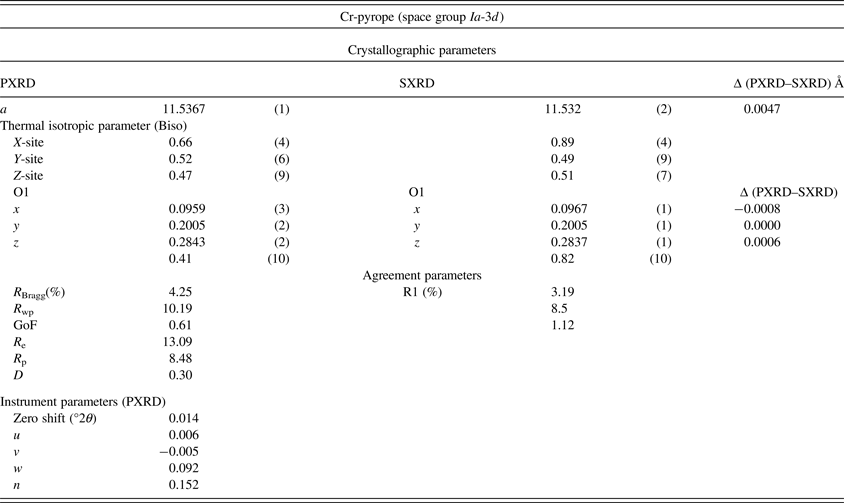
Crystallographic parameters for garnet derived measured with this method compared to those given from SXRD experiments on the same mineral fragment. The respective agreement and instrument parameters for the powder diffraction experiment are shown. Identical crystallographic settings and site occupancy factor (sof) based on the major element composition were used for both refinements.

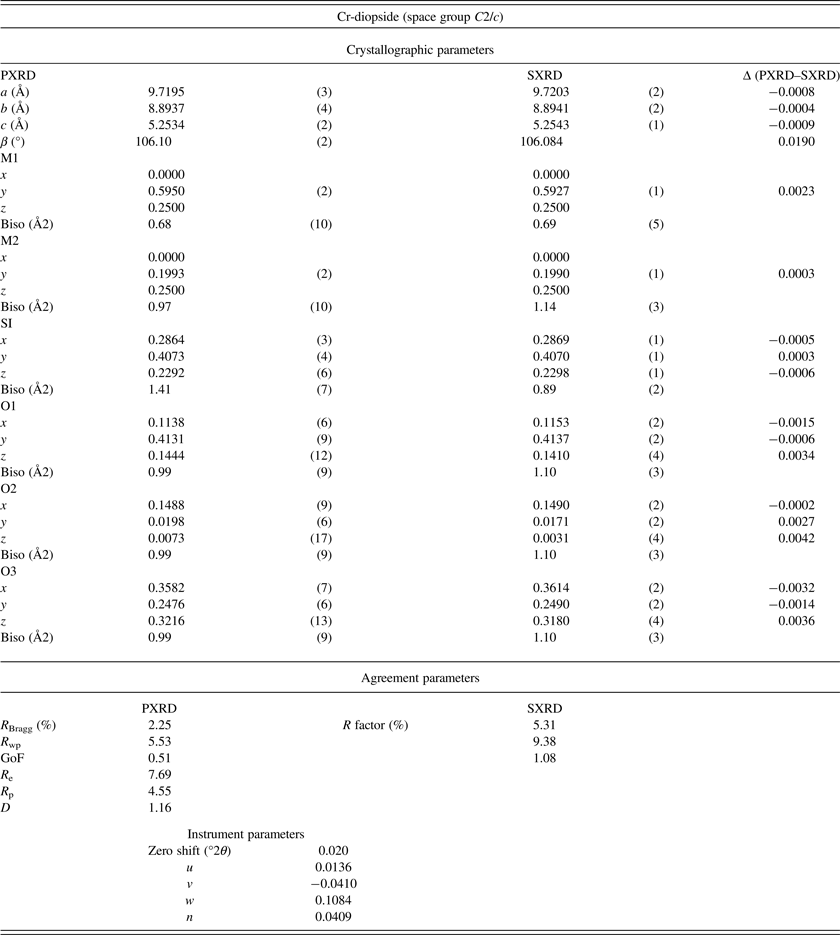
Crystallographic refined from XRD data given from this method compared to those from an SXRD experiment on the same grain.

1. Garnet
The XRD data from a garnet of average composition (Mg0.75 Fe0.15 Ca0.10)3 (Al0.88 Cr0.12)2 Si3O12, 0.04 × 0.04 × 0.16 mm were measured by PXRD and SXRD techniques. Refinement of PXRD data between 17 and 164°2θ converged with an R Bragg of 4.25%. Within the refined interval, there are 29 peaks >5% relative intensity for which the Caglioti parameters along with n both indicate a strongly Lorentzian peak shape for the observed reflections.
The SXRD data were collected over a period of ~4 h yielding a total of 434 frames. The frames were integrated with the Bruker SAINT software package using a narrow-frame algorithm. The integration of the data using a cubic unit cell yielded a total of 2389 reflections to a maximum θ angle of 28.26° (0.75 Å resolution), of which 164 were independent (average redundancy 14.567, completeness = 100.0%, R int = 1.84%, R sig = 0.76%) and 150 (91.46%) were >2σ(F 2).
The cubic crystal symmetry of garnet permits variation of only the unit cell and the fractional atomic coordinates of the O atom. Table IV shows the crystallographic and agreement parameters given from the refinement of SXRD and PXRD data. The unit-cell dimension differs by <0.005 Å while the x, y, and z coordinates of O gave differences of −0.0008, 0.0000, and 0.0006 Å, respectively. Although the atomic coordinates for the X-site (Ca, Mg, and Fe), Y-site (Al and Cr) and Z-site (Si) are fixed, as these correspond to special positions, the thermal isotropic parameters (Biso) are still refinable. As shown in Table IV, the Biso parameters given from refinement of the two XRD data sets are in good agreement. The significant zero-shift correction in the garnet refinement (0.0135°2θ) can be attributed to the 50 µm resolution of the IP image (equal to a step-size of 0.05°2θ), which, in a worse case scenario, where the true pattern centre is displaced from the origin in the integration software by one half pixel, a zero-shift correction of 0.025°2θ would be required. Regardless, the crystallographic parameters given from the SXRD and PXRD data are in good agreement.
2. Clinopyroxene
To provide a comparison of data from a lower symmetry phase, a chrome diopside (cpx) of composition (Ca0.8 Mg0.2) (Mg0.76 Al0.09 Cr0.08 Fe0.07) Si2O6 was analyzed. The SXRD analysis gave a total of 2110 frames over 35.17 h. The frames were integrated with the Bruker SAINT software package using a narrow-frame algorithm. The integration of the data using a monoclinic unit cell yielded a total of 3447 reflections out to a maximum θ angle of 31.82° (0.67 Å resolution), of which 706 were considered unique (average redundancy 4.882, completeness = 94.4%, R int = 2.87%, R sig = 3.26%) and 570 (80.74%) were >2σ(F 2). The PXRD data shown in Figure 3 were refined over the interval 25–165°2θ which included 32 peaks above 5% intensity and an n value of nearly 34% Gaussian. The greater Gaussian component gives peaks that are short and wide when compared to a Lorentzian distribution and may be a related to the chemical substitution that occurs in the M1 and M2 sites in the cpx crystal structure. Table V compares the crystallographic parameters obtained from the refined SXRD and PXRD data. In general, the crystallographic parameters agree to within error. Notable exceptions include the unit-cell β angle and the z coordinate of the three O atoms (see Table V).
V. CONCLUSION
Presented here is a technique to acquire fully quantitative XRD data from a single minute grain using a Gandolfi camera, IP, and integration software such as DIIS or XRD2DScan. Where there is insufficient material to analyze by powder diffractometer this method can provide valuable crystallographic information such as unit-cell dimensions, fractional atomic coordinates, and thermal isotropic parameters. Analysis of d-spacing standard SRM640c in triplicate gave only 0.0003 Å standard deviation in the unit-cell dimension with an accuracy of ±0.0001 Å when compared with the certified value. Similarly, measurements on intensity standard SRM676a gave a standard deviation among three measurements of <2% relative intensity. The accuracy of the intensity is taken from comparing the mean of three measurements to the certified values and shows that the largest discrepancy is <2%. With such promising results given from the analyses of these standards, we endeavored to analyze minute natural single crystals of a high-symmetry garnet and a lower-symmetry cpx for which we had previously acquired SXRD data. Given in Table IV (garnet) and Table V (cpx), the results from refinement of the two XRD data sets agree very well. For garnet, not only did the unit-cell dimension and fractional atomic coordinates for O agree very well, but also the Biso parameters were similar. Likewise for cpx, the unit-cell dimensions returned from the two methods compare well with the largest discrepancy in the c unit-cell dimension of only 0.0007 Å and 0.02° in the β angle. Although effective at retrieving crystallographic parameters from very small crystalline phases, this technique is also ideally suited for cursory phase identification and investigation into the presence of any included material within the grain analyzed.
ACKNOWLEDGEMENTS
We would like to thank Nicole Ernst Boris for handling the review process of this manuscript. K.R. would like to thank M. Seller of DeBeers Inc. for providing the natural sample material, T. Armbruster for single crystal diffraction studies on cpx and garnet, and two anonymous reviewers for helpful comments.