Introduction
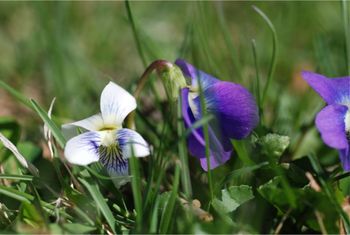
The primary violet species found in Midwestern lawns is the common blue violet with violet to deep violet flowers (McKinney Reference McKinney1992). The taxonomy of the common blue violet is a complicated topic (Baird Reference Baird1942; McKinney Reference McKinney1992; Russell Reference Russell1965; Smith and Mohlenbrock Reference Smith and Mohlenbrock1963). Some authors classify this species at the variety level (i.e., Viola sororia Willd. var. sororia) (McKinney Reference McKinney1987, Reference McKinney1992) and others classify this species under the synonyms V. floridana Brainerd, V. latiuscula Greene, V. palmata var. sororia (Willd.) Pollard, or V. papilionacea Pursh (ITIS 2019; USDA-NRCS 2019). Additionally, the confederate violet [V. sororia Willd. f. priceana (Pollard) Cooperrider; basionym: V. priceana Pollard), with its variable flower color, is considered a separate species by some taxonomists (Smith and Mohlenbrock Reference Smith and Mohlenbrock1963) and within V. sororia by others (Cooperrider Reference Cooperrider1984; ITIS 2019; USDA-NRCS 2019). The confederate violet, which has white flowers with purple veins, is often found in combination with the more predominant common blue violet in lawns, particularly in southern regions of the north central United States and northern regions of the southeastern United States (Baird Reference Baird1942; Cooperrider Reference Cooperrider1984) (Figure 1). When compared with other stemless (acaulescent) blue violets, V. sororia has the most variation in plant sizes and floral morphology; it has the potential to hybridize with many other stemless blue violets, which, in turn, results in a relatively large gene pool and adaptations to broad range of environments observed for this species (Russell Reference Russell1965).
Confederate violet [Viola sororia Willd. f. priceana (Pollard) Cooperrider] (left) and the common blue violet (V. sororia Willd.) (right). The confederate violet is described as “petals wholly white or with the lowest one streaked with purple” (Grover Reference Grover1939).

Regardless of taxonomic classification, the common blue violet is the most abundant species (Smith and Mohlenbrock Reference Smith and Mohlenbrock1963). Turf managers frequently and collectively refer to it and other similar species (e.g., V. missouriensis Greene) as wild violets.
Despite being a popular perennial flower in gardens and the state flower of Illinois, New Jersey, Rhode Island, and Wisconsin, common blue violet is considered a persistent lawn weed by some. This is especially the case when it is present in high-quality turf areas. Common blue violets are among the most troublesome broadleaf weeds in cool-season turf (Beck and Patton Reference Beck and Patton2015). Common blue violet can reproduce sexually through pollination and asexually through ramet-forming rhizomes, which further assist the spread of this species (Solbrig et al. Reference Solbrig, Newell and Kincaid1980). Common blue violet typically persists in shaded residential lawns with established tree canopies where turf swards are thinned (Christians et al. Reference Christians, Patton and Law2017).
Cultural practices have a limited effect on the control of common blue violet populations. Although regular mowing and decreasing shade can reduce common blue violet density in lawns, nitrogen fertilization does not (Gray and Call Reference Gray and Call1993). It is unknown how selecting shade-tolerant turfgrass varieties, irrigation, drainage, and soil compaction influence common blue violet populations, but its density in moist habitats suggests a preference for irrigated sites. Regular scouting and manual removal of plants before seeds reach maturity is an effective but laborious control tactic. Furthermore, manual removal of common blue violet rhizomes is necessary during hand weeding to prevent regeneration. As such, turf managers often rely on synthetic auxin herbicides to control common blue violet.
Common blue violet is not controlled well by common three-way mixtures (e.g., 2,4-D + mecoprop [MCPP] + dicamba) (Calhoun Reference Calhoun2002; Patton et al. Reference Patton, Elmore, Hoyle, Kao-Kniffin, Branham, Voigt, Christians, Thoms, Munshaw, Hathaway, Nikolai, Horgan, Miller, Xiong, Kreuser, Gaussoin, Gardner, Raudenbush, Li, Landschoot, Soldat and Koch2019), and research on common blue violet control with synthetic auxin herbicides in the field has shown inconsistent results. Experiments in Kentucky and Maryland reported that triclopyr at 0.56 kg ha−1 and a mixture of 0.56 kg ha−1 triclopyr + 1.12 kg ha−1 2,4-D provided greater than 90% common blue violet control (Dernoeden and Davis Reference Dernoeden and Davis1988; Vrabel Reference Vrabel1987; Witt et al. Reference Witt, Powell and Tapp1986). Another study in Michigan tested the efficacy of single applications of triclopyr at 0.56 kg ha−1 and a mixture of 0.56 kg ha−1 triclopyr + 1.12 kg ha−1 2,4-D in late summer (Hanson and Branham Reference Hanson and Branham1986), from which 67% common blue violet control was reported for both treatments with or without 2,4-D. This observation indicates that the phenoxy herbicide 2,4-D provided no additional control when added to triclopyr. However, Hanson and Branham’s experiment (Reference Hanson and Branham1986) also included other synthetic auxin treatments of 2,4-D, MCPP, and mixtures of 2,4-D + dichlorprop (2,4-DP), and 2,4-D + 2,4-DP + dicamba, which all resulted in common blue violet control ranging from 24% to 48% by a single application. Vrabel (Reference Vrabel1987) reported that a single fall application of 0.84 kg ha−1 2,4-D + 0.84 kg ha−1 2,4-DP provided excellent (not quantified in the study abstract) common blue violet control but that violets were again found in the experimental area the following summer. Dernoeden and Davis (Reference Dernoeden and Davis1988) and Jagschitz and Sawyer (Reference Jagschitz and Sawyer1987) reported 2,4-D + MCPP + dicamba (total 1.6 to 1.8 kg ha−1) and 0.84 kg ha−1 2,4-D + 0.84 kg ha−1 2,4-DP were ineffective (0% to 53% control). As such, the level of control or suppression from phenoxy herbicides is inconsistent in past reports.
Quinclorac, another synthetic auxin herbicide, was reported by Dernoeden and Davis (Reference Dernoeden and Davis1988) to provide excellent common blue violet control in Maryland. Furthermore, Calhoun (Reference Calhoun2002) reported that quinclorac increased the level of common blue violet control when mixed with other synthetic auxin herbicides in Michigan, but no other published data on quinclorac efficacy is available, to our knowledge. Herbicides that inhibit acetolactate synthase, such as chlorsulfuron, flazasulfuron, metsulfuron, and pyrimisulfan + penoxsulam, provide control of common blue violets (Brosnan and Breeden Reference Brosnan and Breeden2019; Ferrell et al. Reference Ferrell, Murphy, Waltz and Yelverton2004; Powell et al. Reference Powell, Witt and Tapp1987; Warren et al. Reference Warren, Gannon and Yelverton2005). However, chlorsulfuron, flazasulfuron, metsulfuron, and penoxsulam are also injurious to perennial ryegrass (Lolium perenne L.), a cool-season grass (i.e., a C3 grass), and chlorsulfuron is no longer registered for use in managed turfgrass (Ferrell et al. Reference Ferrell, Murphy, Waltz and Yelverton2004; Patton et al. Reference Patton, Elmore, Hoyle, Kao-Kniffin, Branham, Voigt, Christians, Thoms, Munshaw, Hathaway, Nikolai, Horgan, Miller, Xiong, Kreuser, Gaussoin, Gardner, Raudenbush, Li, Landschoot, Soldat and Koch2019).
There is little and inconsistent published information on the efficacy of synthetic auxin herbicides aside from triclopyr for control of common blue violet. Our knowledge is also limited on the rate of triclopyr needed to achieve optimal control, because often only a single rate was tested in previous reports. The objectives of this experiment were to (1) evaluate the efficacy of synthetic auxin herbicides and combinations for common blue violet control, and (2) determine the influence of triclopyr dose on common blue violet control.
Materials and Methods
Plant Culture
A greenhouse study was conducted at Purdue University, Life Sciences Greenhouses, West Lafayette, IN (40.422°N, 86.918°W). Common blue violets were collected in October and November 2011 from a residence in Lafayette, IN (40.395°N, 86.744°W) without a history of herbicide use. A single rhizome segment, at least 5 cm long, of the collected common blue violets was transplanted into 10-cm–diameter pots (Hummert International, Earth City, MO) filled with Whitaker silt loam soil (fine-loamy, mixed, active, mesic Aeric Endoaqualf). After transplanting, plants were fertilized monthly at 29 kg N ha−1 with a 32N-4.4P-8.3K product (Infinity Fertilizers, Inc., Milan, IL) and watered daily—except for a pause in watering after the herbicide application—with overhead irrigation to maintain adequate soil moisture until the initiation of the experiment. At the time of application, each pot contained a common blue violet plant with approximately 20 fully expanded leaves.
Herbicide Comparison
The experiment was conducted twice, with herbicide applications initiated on April 18, 2012, and May 29, 2012. Mature violets of similar leaf number and size were selected for the experiment. Plants were removed from the greenhouse, treated with various herbicides in the field over a turf area, and returned to the greenhouse 24 h after application. Wind speed was 1.6 or 1.5 m s−1 on the application dates in experimental runs 1 and 2, respectively. Furthermore, a 1-m border between separated treated areas helped prevent drift. Violets were watered 4 h before application of the herbicides, and daily irrigation was resumed 36 h after application of treatments until the conclusion of this experiment.
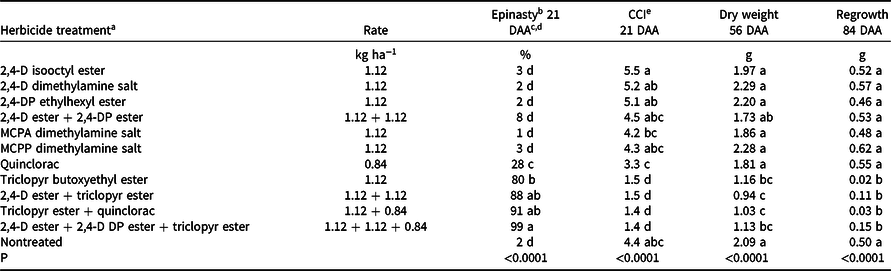
Herbicides were applied in 814 L ha−1 water, a common spray volume used in the lawn care industry (Christians et al. Reference Christians, Patton and Law2017), at 207 kPa with a CO2-pressurized three-nozzle boom sprayer equipped with an XR8002VS flat-fan nozzles (TeeJet Technologies; Spraying Systems Co., Wheaton, IL). Synthetic auxin herbicide treatments were selected on the basis of their safety to cool-season turfgrasses and their common use among lawn care professionals (Table 1). We also assessed unique mixtures of 2,4-D, 2,4-DP, triclopyr, and quinclorac for their efficacy. Fluroxypyr and dicamba were two synthetic auxin herbicides not included on the basis of previous research (Jagschitz and Sawyer Reference Jagschitz and Sawyer1987; Patton et al. Reference Patton, Elmore, Hoyle, Kao-Kniffin, Branham, Voigt, Christians, Thoms, Munshaw, Hathaway, Nikolai, Horgan, Miller, Xiong, Kreuser, Gaussoin, Gardner, Raudenbush, Li, Landschoot, Soldat and Koch2019) that indicated poor efficacy. Clopyralid was omitted from the list of treatments because it is not registered for use in residential turf. Day and night temperatures and photosynthetically active radiation after herbicide application were collected continuously (every 1 h) with a mini-weather station (WatchDog 2475 Plant Growth Station; Spectrum Technologies, Inc., Plainfield, IL). Greenhouse temperatures averaged 20.0 C and the average daily light integral was 33.0 mol m−2 d−1 during the first experimental run, and 23.3 C and a daily light integral of 35.8 mol m−2 d−1 when repeated.
Response of common blue violet to synthetic auxin postemergence herbicides: combined analysis of greenhouse experiments.

a Trade names for herbicide sources used in this experiment (all from Nufarm, Inc., except Drive 75 DF [BASF Corp.] and Turflon Ester [Dow AgroSciences]): 2,4-D isooctyl ester, Weedone LV4 EC,; 2,4-D dimethylamine salt, Weedar 64; 2,4-DP ethylhexyl ester, formulated product; MCPA dimethylamine salt, MCPA-4 AMINE; MCPP dimethylamine salt, MCPP-p 4 AMINE; quinclorac, Drive 75 DF; triclopyr butoxyethyl ester, Turflon Ester.
b 0% to 100% scale, where 0% was no epinasty and 100% represented complete epinasty with all leaves exhibiting symptoms, including twisting or bending of stems and cupping or curling of leaves.
c Abbreviations: 2,4-DP, dichlorprop; CCI, chlorophyll content index; DAA, days after application; MCPP, mecoprop-p.
d Means followed by the same letter within measurement type do not differ according to Fisher protected LSD at α = 0.05. Data were combined across experimental runs.
e CCI using the CCM-200 (Opti-Sciences) (Jifon et al. Reference Jifon, Syvertsen and Whaley2005). The device measures optical absorbance in two different wavebands: 653 nm (chlorophyll) and 931 nm (near infrared) and reports a unitless index.
Triclopyr Dose Response
The second experiment was conducted twice with herbicide applications initiated on May 29, 2012, and September 7, 2012. Violets were collected, planted, and treated in a manner similar to the first experiment. A range of triclopyr (triclopyr butoxyethyl ester, Turflon Ester; Dow AgroSciences, Indianapolis, IN) rates (0, 0.14, 0.28, 0.56, 0.84, 1.12 kg ha−1) were used to determine the rate needed to achieve control. Treatments were applied in ascending herbicide-rate order. Rates were selected on the basis of the range of application rates used by turf professionals for products containing triclopyr. The label-allowable triclopyr rates ranged from 0.28 to 1.12 kg ha−1 (Anonymous 2008). When applied alone as a broadcast treatment, a 0.56 to 1.12 kg ha−1 triclopyr rate is directed, but 0.28 to 0.56 kg ha−1 triclopyr is directed when mixing with other broadleaf herbicides (Anonymous 2008). Temperatures averaged 23.3 C and the daily light integral was 35.8 mol m−2 d−1 during the first experimental run; for the second run, the average temperature was 21.0 C and the daily light integral was 22.8 mol m−2 d−1.
Data Collection and Analysis
Data collection and experimental design were identical for both experiments. Violet epinasty was assessed weekly after application on a 0% to 100% scale, where 0% was no epinasty and 100% represented complete epinasty with all leaves exhibiting symptoms, including twisting or bending of stems and cupping or curling of leaves. A CCM-200 chlorophyll meter (Opti-Sciences, Inc., Hudson, NH) was also used weekly during the first 3 wk of the study to assess plant health (Jifon et al. Reference Jifon, Syvertsen and Whaley2005). Two chlorophyll-content index (CCI) measurements were taken per pot using the CCM-200 to measure one fully expanded mature leaf and one fully expanded new leaf. To facilitate measuring the same leaf on each measurement date, a permanent marker was used to mark a location adjacent to the measurement site. Any green, aboveground, living plant tissue was harvested 56 d after application (DAA). Harvested plant tissues were then dried at 60 C for 72 h and weighed. After the harvest, plants were allowed to regrow from rhizomes for 28 d and then harvested again to determine the regrowth as dry-matter yield.
The two experimental runs conducted for each experiment were each arranged as a randomized complete block design with four replications. Chlorophyll measurements were pooled across mature and new leaves because there were no treatment effect by leaf age interactions. Error variances between experimental runs were homogeneous as tested by the Levenne test.
In the combined analysis of the herbicide comparison experiment using PROC MIXED in SAS, version 9.4 (SAS Institute Inc., Cary, NC), the objective was to estimate treatment effects for each experiment. Experimental run and block (nested within run) were considered random effects and treatment by run effects were excluded from the model to increase statistical power (Blouin et al. Reference Blouin, Webster and Bond2011). Type III statistics were used to test the fixed effect of treatment. Least-squares means were generated for each rating and were separated with Fisher LSD test (α = 0.05) using a pdmix800.sas macro when F tests were significant at P ≤ 0.05 (Saxton Reference Saxton1998).
For the triclopyr dose-response experiment, ANOVA was conducted with the code provided by Seefeldt et al. (Reference Seefeldt, Jensen and Fuerst1995). There were no significant experiment by dose interactions, so data were combined across experiments. When treatment effects were significant (P ≤ 0.05), data were fit to either a sigmoidal dose-response curve (Seefeldt et al. Reference Seefeldt, Jensen and Fuerst1995) or linear regression using the coefficient of determination to select the model with the best fit. All regression analyses were conducted using Prism, version 8 (GraphPad Software, Inc., La Jolla, CA).
Linear regression best described the relationship between triclopyr dose and CCI, dry weight, and regrowth dry weight, and a sigmoidal dose-response curve best fit the epinasty data. A four-parameter sigmoidal regression model (Equation 1) was used:
 $${{y = C + }}{{\left( {D - C} \right)} \over {{\rm{1 + (ED_{50}/{\it x})}}\ {\^} \ b}}$$
where y is epinasty, C is the y value at the lower limit of the model, D is the y value at the upper limit of the model, ED50, is the effective herbicide dose giving a 50% response, b is the slope at ED50, and x is the rate of triclopyr application (kg ae ha−1). The model was constrained so the lower limit (C) was 0% and the upper limit (D) was 100%. We also used equations to determine point estimates along the sigmoidal curve (Equation 2) and linear model (Equation 3). Equation 2 was:
 $${{\rm ED}y = ({\rm ED}_{50}}){\rm{\times}}[\,y/(100 - y)]\ {\^}\ (1/b)$$
where EDy is the effective herbicide dose when epinasty (y) is set to a specific value. For example, constraining y to 75 calculates the ED75 (effective dose resulting in 75% epinasty).
Using a linear regression model of y = mx + b, where m is the slope of the line and b is the y-intercept, new variables were defined to determine point estimates along the line (Equation 3):
 $${\rm ED}a = {\rm{ }}\left\{ {\left[ {\left( {1{\rm{ }} - a} \right)b} \right]{\rm{ }} - b} \right\}/m$$
where EDa is the effective herbicide dose when regrowth (y) is set to a specific percent (a) of regrowth. For example, constraining a to 75% (i.e., 0.75) calculates ED75 (effective dose resulting in 75% reduction in regrowth, which is equal to the dose resulting in 25% growth: 1 − a). The y-intercept (b) is equal to the maximum value of y in this model at x = 0. The variable m is the slope.
Results and Discussion
Herbicide Comparison
Similar treatment separation was observed across time for epinasty and CCI. For brevity, only data from 21 DAA plus dry weight and regrowth dry weight measured at the end of the experiment are shown (Table 1).
At 21 DAA, all mixture treatments with multiple herbicides that included triclopyr were rated in the top statistical group at 88% or greater epinasty, whereas treatment with triclopyr alone led to 80% epinasty (Table 1). Similar rankings were observed with CCI measured on the same date: all four treatments containing triclopyr reduced common blue violet equally. At 56 DAA, all treatments containing triclopyr had the lowest dry weight (0.94 to 1.16 g); these same treatments also ranked the lowest for regrowth 84 DAA, with only 0.02 to 0.15 g dry tissue harvested. Violets treated with quinclorac alone demonstrated poor control, ranking in the same statistical group as the nontreated for three of four evaluated parameters except the 28% epinasty 21 DAA. Phenoxy herbicides (i.e., 2,4-D; 2,4-DP; MCPP; and MCPA) and their combinations showed little to no efficacy in suppressing the growth of common blue violet; responses from groups treated with these herbicides were no different from that of the nontreated.
Consistent with previous reports (Dernoeden and Davis Reference Dernoeden and Davis1988; Hanson and Branham Reference Hanson and Branham1986; Vrabel Reference Vrabel1987; Witt et al. Reference Witt, Powell and Tapp1986), triclopyr was the most effective synthetic auxin herbicide tested in our study for common blue violet control. Furthermore, this research confirmed that phenoxy herbicides and their mixtures did not effectively control common blue violet even at rates of 1.12 kg ha−1 tested in this experiment, which also is in agreement with reports from field research (Dernoeden and Davis Reference Dernoeden and Davis1988; Jagschitz and Sawyer Reference Jagschitz and Sawyer1987). In addition, Hanson and Branham (Reference Hanson and Branham1986) reported poor control (<50%) of common blue violet with phenoxy herbicides, though the efficacy they reported (24% to 48%) was higher. Last, Dernoeden and Davis (Reference Dernoeden and Davis1988) reported quinclorac could effectively control wild violet, and Calhoun (Reference Calhoun2002) reported quinclorac could increase common blue violet control when mixed with other synthetic auxin herbicides. Although quinclorac caused 28% epinasty in our experiment, adding quinclorac to triclopyr did not increase control over triclopyr applied alone (Table 1). Differences in these reports on quinclorac efficacy could be due to variability between populations, because V. sororia is genetically diverse.
Similar to common blue violet, other weeds are controlled by triclopyr but not commonly by other synthetic auxins. Common lespedeza [also known as Japanese clover, Kummerowia striata (Thunb.) Schindl.] is controlled by triclopyr but not by 2,4-D or quinclorac (Boyd Reference Boyd, Richardson, Karcher and Patton2009; McCurdy et al. Reference McCurdy, McElroy and Flessner2015); red sorrel (Rumex acetosella L.) is controlled by triclopyr but not effectively by 2,4-D (Munshaw et al. Reference Munshaw, Green and Barrett2015; Stopps et al. Reference Stopps, White, Clements and Upadhyaya2011); sericea lespedeza [Lespedeza cuneata (Dum. Cours.) G. Don] is effectively controlled by triclopyr but not by 2,4-D, clopyralid, or dicamba (Altom et al. Reference Altom, Stritzke and Weeks1992); and yellow woodsorrel (Oxalis stricta L.) is controlled by triclopyr but not by 2,4-D or MCPP (Munshaw et al. Reference Munshaw, Green and Barrett2015). Although quinclorac and the phenoxy herbicides did not improve common blue violet control in our experiment, a finding similar to that reported in other weed species listed, mixtures of triclopyr with other synthetic auxin herbicides are beneficial in increasing the spectrum of weed species controlled and could prevent or delay herbicide resistance development (Mithila et al. Reference Mithila, Hall, Johnson, Kelley and Riechers2011, Patton et al Reference Patton, Weisenberger and Schortgen2018).
Triclopyr Dose Response
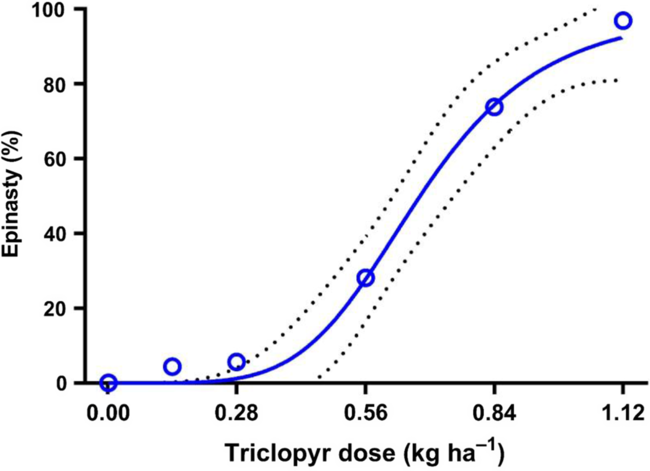
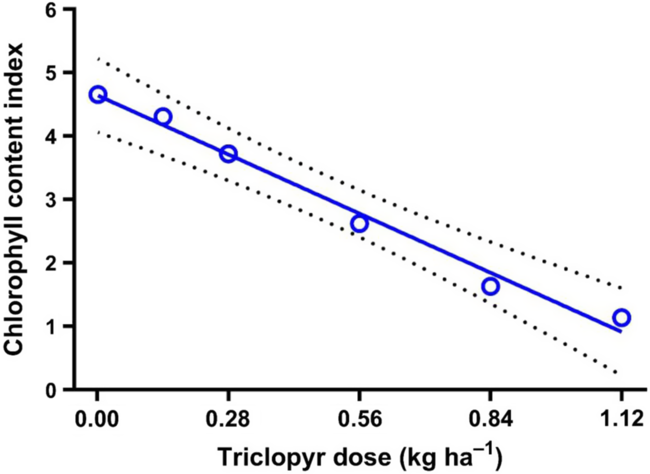
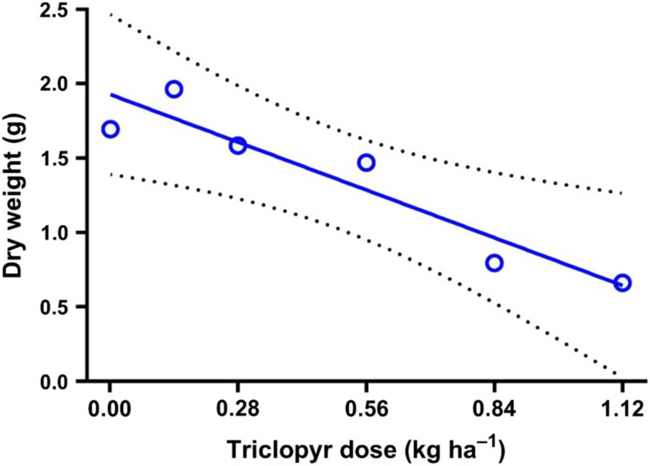
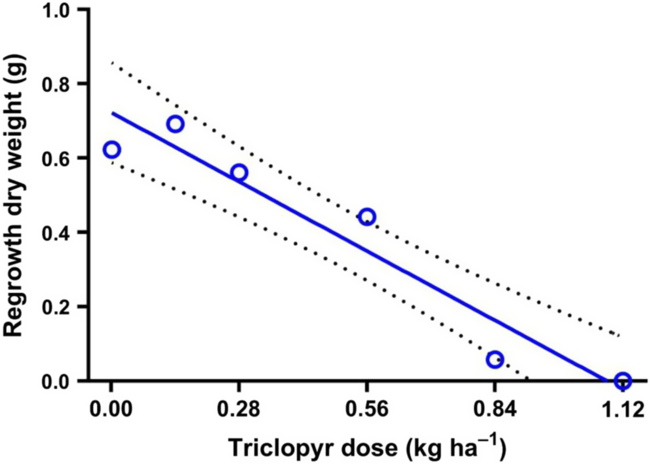
A similar relationship among treatments was observed 14 and 21 DAA for epinasty and CCI. For brevity, only data from 21 DAA plus dry weight and regrowth dry weight measured at the end of the experiment are shown (Figures 2–5). The triclopyr dose-response experiment resulted in similar trends regardless of the response variable. As triclopyr dose increased, violet epinasty 21 DAA increased (Figure 2), whereas CCI 21 DAA (Figure 3), dry weight 56 DAA (Figure 4), and regrowth dry weight 84 DAA (Figure 5) decreased. The triclopyr dose relationships were linear for CCI, dry weight, and regrowth dry weight, and were sigmoidal for percent epinasty.
Common blue violet epinasty as influenced by triclopyr dose 21 days after application. Data are combined across two experiments. Sigmoidal, nonlinear regression is shown with a 95% confidence interval band. Equation: y = 0 + (100.0 − 0)/(1 + (0.6788/x)^4.990); R 2 = 0.85. Epinasty was rated on a 0% to 100% scale, where 0% was no epinasty and 100% represented complete epinasty with all leaves exhibiting symptoms, including twisting or bending of stems and cupping or curling of leaves.

Common blue violet chlorophyll content index (CCI) as influenced by triclopyr dose 21 days after application. Data are combined across two experiments and measurements of new and old leaves. Linear regression with a 95% confidence interval band is shown. Equation: y = −3.331x + 4.64; R 2 = 0.35; P < 0.0001. CCI was measured using the CCM-200 (Opti-Sciences), which measures optical absorbance in two different wavebands: 653 nm (chlorophyll) and 931 nm (near infrared).

Common blue violet dry weight as influenced by triclopyr dose 56 days after application. Data are combined across two experiments. Linear regression with a 95% confidence interval band is shown. Equation: y = −1.147x + 1.929; R 2 = 0.14; P = 0.009.

Common blue violet regrowth 28 days after harvesting (84 days after application) as influenced by triclopyr dose. Data are combined across two experiments. Linear regression with a 95% confidence interval band is shown. Equation: y = −0.6659x + 0.7229; R 2 = 0.72; P < 0.0001.

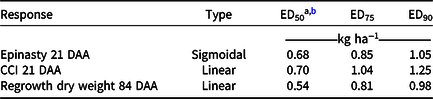
The greatest epinasty (100%) was observed after the treatment of 1.12 kg ha−1 triclopyr (Figure 2). From sigmoidal regression, the triclopyr doses required to achieve ED50, ED75, and ED90 of epinasty were calculated and found to be 0.68, 0.85, and 1.05 kg ha−1, respectively (Table 2). Triclopyr applied at 1.12 kg ha−1 reduced CCI 21 DAA and dry weight 56 DAA, 80% and 67% from those of the nontreated, respectively (Figs. 3-4). Since the plant tissue harvested 56 DAA contains necrotic tissue, the regrowth dry weight 84 DAA better reflects common blue violet control from triclopyr. Triclopyr applied at 1.12 kg ha−1 caused a 100% decrease in regrowth dry weight 84 DAA (Figure 5). Using linear regression, the triclopyr dose required to achieve ED50, ED75, and ED90 of regrowth dry weight were calculated as 0.54, 0.81, and 0.98 kg ha−1, respectively (Table 2), which is similar to previously mentioned epinasty ED50, ED75, and ED90 values (Table 2).
Response of common blue violet to triclopyr dose: regression analysis results.

a Abbreviations: CCI, chlorophyll content index; DAA, days after application; ED, effective dose; ED50, effective triclopyr dose resulting in a 50% increase in epinasty or a 50% reduction in regrowth dry weight; ED75, effective dose resulting in a 75% increase/decrease; ED90, effective dose resulting in a 90% increase/decrease.
b Values were calculated on the basis of regression equations supplied in Figures 2, 3, and 5 and equations 2 and 3 for sigmoidal and linear, respectively. Because the dry-weight plant tissue harvested 56 DAA contained necrotic tissue, it was excluded from this analysis and considered a poor predictor of triclopyr dose needed for control.
Cooperative Extension publications often equate these levels of control as follows: 50% to 75%, fair control; 75% to 90%, good control; and greater than 90%, excellent control (Patton et al. Reference Patton, Elmore, Hoyle, Kao-Kniffin, Branham, Voigt, Christians, Thoms, Munshaw, Hathaway, Nikolai, Horgan, Miller, Xiong, Kreuser, Gaussoin, Gardner, Raudenbush, Li, Landschoot, Soldat and Koch2019). Field experiments with triclopyr applied at 0.56 kg ha−1 to common blue violet resulted in 64% to 67% control from a single application (Dernoeden and Davis Reference Dernoeden and Davis1988; Hanson and Branham Reference Hanson and Branham1986) and greater than 87% control with sequential triclopyr applications at 0.56 kg ha−1 (Powell et al. Reference Powell, Witt and Tapp1987). These results are consistent with results of our experiment, in which single applications of triclopyr at 0.84 kg ha−1 or greater concentration resulted in good (75%) efficacy with at least 1.01 kg ha−1 necessary to provide excellent (90%) control. Many turf herbicides containing triclopyr are available to turf professionals, but several apply 0.56 kg ha−1 or less triclopyr when applied at the high label rate. As such, multiple applications may be needed to achieve acceptable control. Thus, to achieve good (75%) common blue violet control, turf managers should select products that contain triclopyr and apply doses of at least 0.81 kg ha−1 when used according to the label, or mix 0.56 kg ha−1 triclopyr—the maximum label allowable amount when mixing with other herbicides—with another herbicide (Anonymous 2008).
Overall, triclopyr provided the greatest common blue violet control among all the herbicides tested in our efficacy experiment. Treatments containing triclopyr were not statistically different from triclopyr treatment alone except for the three-way 2,4-D ester + 2,4-D DP ester + triclopyr combination, which led to the greatest amount of epinasty observed in this study at 99% 21 DAA, indicating that there was no increase in common blue violet for the mixtures tested in our experiment. The rate experiment demonstrated that a concentration of 0.84 kg ha−1 or greater triclopyr is needed to provide at least 75% common blue violet control. For optimum common blue violet control, turf managers should select products with triclopyr that apply at least 0.84 kg ha−1 or add triclopyr to herbicide mixtures to maximize control.
Acknowledgments
The authors thank the Midwest Regional Turf Foundation for financial support of this project. This work was also supported by Hatch project no. 1004762 from the US Department of Agriculture National Institute of Food and Agriculture. No conflicts of interest have been declared. The authors acknowledge the assistance of Pu Chen, Anthony Fietz, Bradley Kidney, Quincy Law, Geoff Schortgen, and Jon Trappe in plant culture and data collection.