


Introduction
Climate change is often equated with the rise in environmental temperature on regional or global scales and indeed, global air temperature has risen by about 0.6 ± 0.2°C over the past century. The western Antarctic Peninsula (WAP) is one of the most rapidly warming regions on Earth (Vaughan et al. Reference Vaughan, Marshall, Connolley, Parkinson, Mulvaney, Hodgson, King, Pudsey and Turner2003, Turner et al. Reference Turner, Colwell, Marshall, Lachlan-Cope, Carleton, Jomes, Lagun, Reid and Iagovkina2005). Here most recent reconstructions show air temperatures rose by 0.11 ± 0.04°C per decade between 1957 and 2006, which amounts to a total maximum rise of 0.55°C within the 50 years of measurements (Steig et al. Reference Steig, Schneider, Rutherford, Mann, Comiso and Shindell2009). Effects of local air warming at the WAP meanwhile transfer to the marine environment with increasing water temperatures (Meredith & King Reference Meredith and King2006, Whitehouse et al. Reference Whitehouse, Meredith, Rothery, Atkinson, Ward and Korb2008), and major changes in coastal and shelf pelagic systems have already become apparent (Ducklow et al. Reference Ducklow, Baker, Martinson, Quetin, Ross, Smith, Stammerjohn, Vernet and Fraser2007). It is projected that changes will continue if the current warming trend proceeds (Dierssen et al. Reference Dierssen, Smith and Vernet2002, Moline et al. Reference Moline, Claustre, Frazer, Schofields and Vernet2004).
A major factor of disturbance on the shallow Antarctic shelf is through the impact of iceberg scouring, foot-, anchor-, or fast ice on the benthic fauna (Barnes & Conlan Reference Barnes and Conlan2007). As glaciers disintegrate due to increasing air temperatures, the number of icebergs is predicted to increase in the coastal area of the WAP (Barnes & Conlan Reference Barnes and Conlan2007, Smale & Barnes Reference Smale and Barnes2008), although long-term recordings are still missing. Icebergs beaching in shallow coastal areas cause disturbances of the coastal benthic fauna by ice scouring and are predicted to affect bottom community structure and biodiversity on ecological timescales (Smale & Barnes Reference Smale and Barnes2008). Site-specific investigations of ice scouring frequency and depth profiles in the WAP region in recent years indicate that scour frequency decreases with depth (Barnes Reference Barnes1999 for Signy Island, South Orkney Islands; Brown et al. Reference Brown, Fraser, Barnes and Peck2004 & Smale et al. Reference Smale, Barnes and Fraser2007 for Adelaide Island, WAP). Further, Smale and Barnes (Reference Smale and Barnes2008) found ice scour frequency at a given site to be most clearly dependent on the duration of winter fast ice, which immobilizes icebergs in shallow areas and reduces ice scouring. Future predictions of a late build-up and short duration of winter fast ice cover (Vaughan et al. Reference Vaughan, Marshall, Connolley, Parkinson, Mulvaney, Hodgson, King, Pudsey and Turner2003) would consequently increase local scouring intensity.
The immediate effect of ice scour on bottom communities is extraordinary. Around Adelaide Island, Smale et al. (Reference Smale, Barnes and Fraser2007) reported a > 90% reduction in species abundance and a > 60% reduction in species-richness and Peck et al. (Reference Peck, Brockington, Vanhove and Beghyn1999) reported even a > 99% reduction in macrofauna abundance by iceberg impact on a soft sediment habitat at Signy Island. Sessile species such as bryozoans are more heavily impacted by ice scour than mobile species such as sea urchins (Brown et al. Reference Brown, Fraser, Barnes and Peck2004) which are able to evade the icebergs’ movements. As iceberg scouring inflicts damage on sessile bottom fauna and exposes infaunal species on the sediment surface they support populations of mobile predators such as sea-stars and fishes (Barnes & Conlan Reference Barnes and Conlan2007, but see Smale et al. Reference Smale, Barnes and Fraser2007). After removal of Laternula elliptica (King & Broderip) by divers from the sediment at South Bay, Palmer Archipelago (WAP), only 60% of specimens were able to rebury fast enough to avoid predation by the sea-star Odontaster validus (Koehler) and the nemertean Parborlasia corrugatus (McIntosh) (Zamorano et al. Reference Zamorano, Duarte and Moreno1986).
Higher air temperatures result in longer summer melt periods, higher melting rates and larger areas affected by melting in the northern WAP region (Rau & Braun Reference Rau and Braun2002, Vaughan Reference Vaughan2006, Dominguez & Eraso Reference Dominguez and Eraso2007). Freshwater discharge into the ocean and the consequent drop in salinity can affect nearshore and offshore (> 100 km) phytoplankton blooms (Dierssen et al. Reference Dierssen, Smith and Vernet2002). Together with the high load of inorganic particles such discharge can further impact benthic suspension feeders, as shown for temperate bivalve species. Madon et al. (Reference Madon, Schneider, Stoeckel and Sparks1998) for example, reported decreased clearance, ingestion and absorbance rates as well as food assimilation efficiencies at increasing concentrations of inorganic particles in the water, leading to a decline in food quality and quantity available for North American zebra mussels, Dreissena polymorpha (Pallas). In the scallop Pecten novaezelandiae Reeve from New Zealand lower ciliary activity on the bivalve gill surfaces was measured when covered with sedimentary matter, and also a higher animal mortality occurred as silt concentrations increased (Stevens Reference Stevens1987).
The bivalve Laternula elliptica of the present study is an infaunal key species in Antarctic coastal environments (Momo et al. Reference Momo, Kowalke, Schloss, Mercuri and Ferreyra2002) and often forms the major biomass component in the bottom communities with densities of > 250 individuals m-2 (De Laca & Lipps Reference De Laca and Lipps1976, Ahn Reference Ahn1994, Urban & Mercuri Reference Urban and Mercuri1998, present study). We hypothesize that changes in disturbance frequency by ice scours and alterations in particle sedimentation in systems fronting melting glaciers will affect L. elliptica physiology and alter the population structure. Changes of filtration and bio-deposition by this key species are bound to alter energy flux in the sediment–water interface and thereby the energy supply to benthic communities (Momo et al. Reference Momo, Kowalke, Schloss, Mercuri and Ferreyra2002).
In the present study the effects of sedimentation and ice scouring were investigated in a set of field and laboratory experiments at Potter Cove, King George Island. Glacial meltwater discharge and the plumes of terrigenous sediment are a well-known phenomenon in Potter Cove (Klöser et al. Reference Klöser, Ferreyra, Schloss, Mercuri, Laturnus and Curtosi1994, Varela Reference Varela1998). Individuals from a location already experiencing high sediment impact and ice scouring frequencies within the runoff plume of Collins Glacier were compared to individuals collected from a station more remote from the glacial effluents and less affected by ice scour. Experiments were carried out in a size-dependent manner, to check for size/age effects in animal susceptibility to both forms of impact. This was done to predict the consequence of disturbance at the population level, but also to see whether L. elliptica is able to adapt its behaviour and physiology under both climate change induced disturbance effects.
Material and methods
Laternula elliptica for the laboratory experiments were collected by divers between November 2006 and February 2007 at two stations in Potter Cove, King George Island, South Shetland Islands. Station L1 (Fig. 1; 62°14′15.0 S, 058°39′48.0 W) with an observed high frequency of ice scouring is situated within the sediment runoff plume of Collins Glacier close to Jubany Station, and animals were sampled at around 7 m depth. Due to the current system in Potter Cove (Klöser et al. Reference Klöser, Ferreyra, Schloss, Mercuri, Laturnus and Curtosi1994), icebergs are often found beached in front of Jubany Station and impact L1, whereas station L2 (Fig. 1; 62°13′51.1 S, 058°39′57.5 W) is situated on the opposite coastline of Potter Cove and icebergs are rarely seen in that area. Animals at L2 were sampled at around 15 m depth. At the Dallmann Laboratory, Jubany Station, bivalves were kept in a constant temperature room at 1°C with running natural seawater from the cove. The injury experiment was undertaken in the field season 2008–09. Animals were collected at the more impacted L1 station and kept in the laboratory as described above.
Maps of the location of King George Island (KGI) on the western Antarctic Peninsula (boxed), Potter Cove on KGI (boxed) and Potter Cove with depth profile. Dots mark the two sampling sites of Laternula elliptica. 1) L1 = disturbed population, 2) L2 = undisturbed population, 3) L3 = station for water samples, and 4) M4 = disturbed station, only used for abundance measurements. Position of the Argentinean Jubany Station is given. KGI map was taken from www.kgis.scar.org (accessed July 2010, now available on http://www.geographie.uni-freiburg.de/ipg/forschung/ap3/kgis/). Potter Cove map was modified after an original drawing by Grita Veit-Koehler, DZMB, Wilhelmshaven.

Water samples for the assessment of sediment concentration were taken at L1 and L2. For a better overview of the transition zone of the sediment plume, additional water samples were taken at a station between the two sampling stations (L3; Fig. 1; 62°13′57.4 S, 058°39′56.0 W). A fourth station M4 (Fig. 1; 62°14′21.4 S, 058°40′26.0 W) fronting a meltwater creek outlet (‘Matias creek’, unofficial name) and similarly impacted by sedimentation and iceberg scour as L1 was included only for the assessment of iceberg effects on L. elliptica abundance, additionally to L1 and L2.
Sediment concentrations in the field
To investigate the differences in total suspended particulate matter (SPM) between the L1 and L2 stations during the summer season, SPM concentrations were measured at weekly intervals in different water depths. Water samples were taken using a 5 l Niskin bottle in 0 and 5 m water depth and close to the sea floor (7–10 m at L1 and 13–18 m at L2). Additionally, station L3 was sampled at 0, 10, 15 m, and at 30 m water depth, which is close to the bottom. Two parallel samples were taken at each water depth. Depending on the sediment load, 250–2000 ml of water were filtered over pre-weighed cellulose-acetate filters (142 mm diameter, 0.2 μm pore size, Sartorius AG, Germany) and dried for at least three days at 60°C to determine dry weight. Subsequently, filters were combusted at 500°C for five hours to determine percentage organic matter (OM). Additionally, secchi depths were recorded at each sediment sampling event at the different stations.
Laternula elliptica natural density at different in situ stations
The in situ density of individuals per square metre was investigated at stations L1, L2, and M4. At each station 274–377 underwater pictures covering 0.081 m2 of sediment surface, each, were taken by divers using an underwater camera (Nikon Coolpix 9000 in a Sealux housing with Nikon Flash SB103). Bivalve densities were estimated by counts of visible siphons on the sea floor and calculated as mean density per square metre at the respective station.
Respiration at different sediment concentrations
Laternula elliptica of differing size between 35.49 and 91.47 mm shell lengths were sampled at stations L1 and L2. Prior to the measurements, bivalves were maintained without food for three days to minimize as much as possible the effect of specific dynamic action without starving the animals. Standard aerobic metabolic rate was recorded in a multi-channel intermittent flow-through system with oxygen sensors spots placed onto the chamber wall and recording done from the outside using glass fibre oxygen optodes and a Fibox 4-channel system (PreSens® GmbH). The respiration chambers were perspex cylinders of different volumes, adjustable to the size of the animals (550–1650 ml). Water flow was maintained by pumps connected to the respiration chambers with gas-tight tubes and creating a forward flow of c. 3 ml min-1. Experimental conditions were maintained at 0 ± 0.4°C and 34 PSU. Non-invasive oxygen sensors were calibrated to 100% oxygen solubility in air-saturated and to 0% in N2-saturated seawater at experimental temperature.
Bivalves were allowed to accommodate to the respiration chambers overnight, which were located in a 100 l aquarium in which constant 100% air saturation was achieved by air pumps. A measurement cycle was initiated by switching the system from ‘flow-through’ to ‘closed-circuit flow’ status. The water in the closed system was continuously circulated by separate pumps, and the decrease in the oxygen content from 100% to c. 70% oxygen was recorded over time. When reaching 70% oxygen saturation, the system was switched back to the ‘flow-through’ mode until 100% saturation was again reached, whereupon a new run was started by closing the chambers. One to two runs of four to five hours each were carried out for each animal. Initial respiration measurements were undertaken with natural seawater without sediment as controls. For the sediment treatments, 300 and 600 mg of natural sediment per litre of seawater were added stepwise to the 100 l aquarium, housing the respiration chambers, 12 hours before the respiration measurement was started by switching to ‘closed-circuit flow’ status. Sediment for the experiments was taken from the runoff of the glacier at the very end of Potter Cove, where fine sediment had dried to plaques on the side of the riverbeds. The sediment was ground in a mortar and sieved through a 50 μm mesh size sediment sieve. Sediment organic content was determined gravimetrically (see above for field measurements). To achieve a constant 5% of organic matter, the algae Desmarestia antarctica (Moe & Silva) was sampled, dried, ground to fine powder and added to the sediment. Over the course of the experiment, the sediment could not be maintained in complete suspension and sedimentation occurred in the experimental tanks as well as inside the respiration chambers, although we increased the water flow velocity in the holding tank. In spite of these difficulties, suspended sediment concentrations of 54 ± 2.8 mg l-1 in the 300 mg l-1 experiment, and 76.4 ± 1.13 mg l-1 in the 600 mg l-1 experiment, could be maintained for a period of > 24 hours, gravimetrically controlled as described above. The setup mimicked the conditions in the field, in which warm days will lead to a peak in glacial sediment runoff which slowly decrease again when discharge rates are lower on cold days (Dominguez & Eraso Reference Dominguez and Eraso2007).
Respiration measurements with each animal lasted three days, starting with an acclimation phase overnight and respiration measurements without sediment the next day. In the evening 300 mg l-1 of sediment were added and after 12 hours exposure, respiration was recorded over the next day. On the next evening, 600 mg l-1 of sediment was added and the measurement continued throughout another day. Immediately upon completion of the last measurement cycle, the animals were dissected and soft tissue wet mass determined. The soft tissue was dried at 60°C for at least three days to determine dry mass. Standard metabolic rate (SMR) was calculated after subtraction of the microbial oxygen demand determined in a parallel blank chamber. Percentage O2 saturation was transformed to micromoles of dissolved oxygen in seawater using values of oxygen solubility obtained from Benson & Krause (Reference Benson and Krause1984).
Animals displayed frequent respiration pauses lasting up to 30 minutes, in the following called interrupted respiration patterns (IPs), and already described for L. elliptica by Morley et al. (Reference Morley, Peck, Miller and Pörtner2007). Occurrence and duration (min) of IPs were recorded and compared between treatments (sediment concentration) and sampling location (L1 or L2).
Burrowing experiments in the field
A steel frame with an inner area of 0.5 m2 was placed on the surface at stations L1 and L2. Each frame position was marked at the surface with an attached buoy. Four experiments were conducted at each station involving 9–18 L. elliptica individuals of different sizes (small, medium, large). The animals were dug from the sediment by divers and deposited on top of the enclosed sediment area. Pictures were taken directly after exposing the animals in the frame and thereafter at c. 24 hour intervals, depending on the weather conditions, for up to 107 hours. As we observed that smaller animals reburied very fast, one experiment exclusively with small-sized animals from L1 and L2 was undertaken at station L1, to see whether smaller animals from the two sites burrowed at the same speed into the same sediment. Eleven animals of each station were deposited on the two sides of the steel frame and photos were taken at 0, 3 and 6 hours following exposure. Following each experiment, animals were taken to the laboratory for morphological measurements (size, weight).
Unfortunately shells from all experiments above (respiration, burrowing) were lost in a ship fire on the Argentine ice breaker ARA Almirante Irizar, so that animal age could not be determined by shell ring counts and results can only be related to size but not to age.
Injury experiment: simulation of ice scouring in the laboratory
Ice scouring events will not only expose L. elliptica to predators by ploughing them out of the ground. The animals can be injured by the crushing force of the ice (supplementary data will be found at www.journals.cambridge.org/jid_ANS). In an injury experiment, the susceptibility of different L. elliptica size/age classes to different forms of injury was investigated. Small (33–40 mm) and large (70–85 mm) animals of station L1 were injured either by applying two cuts in the siphon, mantle and foot muscle or by cracking the shell by a soft blow with a blunt tool (wrench) (Ziuganov et al. Reference Ziuganov, Miguel, Neves, Longa, Fernandez, Amaro, Beletsky, Popkovitch, Kaliuzhin and Johnson2000). Each type of injury was separately inflicted to a total number of 12 animals of each size class. Control animals were not injured. The animals were kept in four large aquaria (180 l) with the different sizes and injuries mixed. The experiment was terminated after 38 days when all animals of two injury groups had died.
Statistical analysis
Statistical analysis was carried out using Graph Pad software (version 5.01). Data were tested for Gaussian distribution and variance homogeneity. Slopes of the respiration experiments of differently sized individuals from the two stations and under different sediment treatments were compared using linear regression analysis and slopes and intercepts analysed for significant differences (ANCOVA). Determination of significant differences in respiration response between different animal sizes was undertaken with the Johnson-Neyman technique (Johnson & Neyman Reference Johnson and Neyman1936), using a programme provided by C. White (White Reference White2003). Data for suspended sediments were compared between stations and depths, and IP frequencies and durations were analysed using t-test. Differences between three and more groups were analysed with ANOVA (Kruskal Wallis in case of non-Gaussian distribution) and the Tukey Post-hoc Test (Dunn's Multiple Comparison in case of non-Gaussian distribution). Survival curves of the injury experiment were analysed using the survival curve analysis (Kaplan-Meyer) of Graph Pad Prism software 5.01.
Results
Suspended particulate matter (organic and inorganic) concentrations in Potter Cove
The concentration of suspended particulate matter (organic + inorganic) in Potter Cove was highly variable in summer 2007. In surface water at station L1 values ranged from 2.6–57.73 mg l-1, at station L3 from 3.05–24 mg l-1 and at station L2 from 1.8–22.8 mg l-1. Close to the bottom concentrations were 2.21–20 mg l-1 at L1 (10 m), 1.27–7.38 mg l-1 at L3 (30 m) and 1.4–7.9 mg l-1 at L2 (15 m). In general, in situ SPM concentrations followed the expected gradient across Potter Cove with L1 > L3 > L2 (Fig. 2). Decreasing concentrations were observed at greater depth (Fig. 2) as the sediment runoff plume is mostly confined to the upper 0–5 m layer of the water column. Due to the high temporal variability during the field season a significant difference in SPM concentration between stations L2 and L1 with L3 was observed only in the bottom layer (Fig. 2). However, the results corroborate the initial assumption that animals from L1, which are closer to the glacier and downstream of the glacier outflow, are exposed to higher sedimentation rates than animals from L2 (1 km away from the glacier and upstream of the outflow). Parallel measurements of secchi depth indicate that SPM concentrations higher than 10 mg l-1 can be reliably estimated by secchi depth measurements, whereas for lower concentrations this method is not sensitive enough and also the secchi disk is not applicable in greater water depths. Nevertheless, the secchi measurements also indicate station L2 to be less influenced by sediment (higher secchi depth) than stations L1 and L3 (Fig. 3). Stations L1 and L3 were very similar with respect to secchi depths, indicating similar sediment conditions in both locations.
Field measurements of sediment load in different water depth of the disturbed (L1) and undisturbed (L2) sampling station of L. elliptica and an in-between (L3) station. Shown are means ± standard error of the mean (sem) of total suspended particulate matter (SPM, inorganic and organic) of 11 weekly measurements per depth, starting on 27 December 2006 (sampling event 1) and ending on 9 March 2007 (sampling event 11). Bottom measurements of the stations L2 (15 m) and L3 (30 m and 15 m water depth) were different from L1 (10 m) with P < 0.05 (ANOVA).

Weekly measurements of secchi depth (circles) and gravimetrically analysed surface water SPM (squares) throughout the season (27 December 2006–9 March 2007) at the stations L1 (black symbols), L2 (white symbols) and L3 (grey symbols). n = two per sampling event.

Laternula elliptica densities at the experimental stations in Potter Cove
The analysis of the underwater pictures from the disturbed station L1, the ‘Matias creek’ Station M4, and the undisturbed station L2 revealed c. 30% higher mean individual density of L. elliptica at L2 (34.20 ± 39.54 SD individuals m-2, number of analysed pictures = 274) compared to L1 (23.78 ± 28.78 SD individuals m-2, number of analysed pictures = 377) and M4 (25.31 ± 35.23 SD individuals m-2, number of analysed pictures = 278). Stations L1 and M4 were not significantly different (ANOVA) and both were less densely colonized than the undisturbed L2 site.
Respiration measurements
When comparing L. elliptica from the disturbed L1 and the undisturbed L2 station that had not been experimentally treated with sediment, we found that standard metabolic rates increased more clearly with animal size (age) in animals from L1 compared to the undisturbed station (L2, Fig. 4). Using the Johnson-Neyman technique, significantly higher whole animal respiration at L1 compared to L2 was recorded only in individuals heavier than 4 g tissue dry mass (Fig. 4).
Respiration rate of L1 (grey circles) and L2 (black squares) individuals under control condition (no sediment). Each data point represents the mean of two measurements for one individual. Size range for L1 is 39.83–84.02 mm, and for L2 is 35.49–91.47 mm. Slopes are significantly different with F = 7.39, degrees of freedom numerator (dfn) = 1, degrees of freedom denominator (dfd) = 46, P = 0.0092. n = 24 (L1), 25 (L2). Broken line = region of no significance (min: -2.239, max: 4.04 gDW), calculated using Johnson-Neyman technique Scatter Plot (White Reference White2003).

Treatment of experimental animals with 12 hours of 54 and 76 mg sediment l-1 had different effects on the respiration rate of animals from both stations (Fig. 5). The respiration rates of the animals from the undisturbed L2 station were not affected by either of the two sediment concentrations (Fig. 5b), although these concentrations are well beyond the values the animals experience in their natural environment (see above field sedimentation measurements). In contrast, larger animals from the disturbed L1 station reduced respiration rates by on average 20% when exposed to either sediment concentration, compared to non-treated control animals. This response did not differ between different amounts of sediment in large L1 specimens (Fig. 5a). Using the Johnson-Neyman technique, a comparison between respiration rates of L1 animals under control conditions and exposed to the highest sediment concentration (76 mg sediment l-1) showed that animals of > 4.68 g tissue dry mass respired significantly less under sediment treatment compared to sediment free control conditions (P < 0.05) whereas respiration rates of animals of < 4.68 g tissue weight was not affected by sediment exposure. Comparing respiration rates of control animals and animals kept with 54 mg l-1 sediment, no animal size-region of non-significance could be defined with a P < 0.05 although slopes were significantly different (P < 0.05). When setting the significance level to P < 0.1, again animals of > 4.56 g tissue dry mass had significantly lower respiration rates under sediment treatment compared to control conditions.
Respiration rates (μmol O2 l-1 h-1) plotted against dry mass (g) of a. L1 (circles), and b. L2 (squares) animals under control conditions (clear symbols, no sediment) or 54 ± 2.8 mg sediment l-1 (grey symbols) and 76.4 ± 1.13 mg sediment l-1 (black symbols) incubation. Slopes were not significantly different for L2 animals. Slope of control animals from the L1 station were significantly different from 54 ± 2.8 mg l-1 (F = 4.95, dfn = 1, dfd = 44, P = 0.031) and 76.4 ± 1.13 mg l-1 (F = 6.53, dfn = 1, dfd = 44, P = 0.014) treated animals. Both sediment treatments of L1 animals were not significantly different. n = 24 (L1), 17 (L2).

For a better quantification of sediment effects on respiration, the response was calculated for individual specimens from stations L1 and L2 in percent increase or decrease compared to the control rates (without sediment) of the same animal. ANOVA of the entire set of small and large animals studied at both stations found no significant difference in the quantitative response of L1 and L2 animals to either sediment concentration. However, when only animals beyond the limit defined by the Johnson-Neyman technique for the L1 station (> 4.68 g dry mass) were compared, again large L1 animals displayed a significant decrease of respiration in both sediment treatments, whereas L2 animal respiration even increased slightly (average < 10%) above the 100% line of the control rates (Fig. 6).
Percentage change in respiration compared to control conditions without sediment of animals from stations L1 (circles) and L2 (squares) under 54 ± 2.8 mg sediment l-1 (grey symbols) and 76.4 ± 1.13 mg sediment l-1 (black symbols) in the incubation water. Each data point represents the mean of two replicate measurements with the same individual. L1: range of dry weight = 4.88–8.32 g, mean 6.16 ± 1.22 SD (n = 9), L2: range of dry weight = 4.9–9.1 g, mean 6.68 ± 1.3 SD (n = 11). Dry weight of experimental animals did not differ significantly between both experimental groups from the stations. * = significant difference between groups with P < 0.05. Dotted line marks 100% control respiration without sediment treatment.

A higher percentage of animals from the L2 station displayed IPs compared to animals from the L1 station (Table I) in all three treatments. In animals of both stations which showed IPs, the pattern did not differ between control and sediment treatments. Also, IP duration, i.e. the time individuals spent respiring or not, did not vary between stations or treatments. Instead, all L1 and L2 animals which were showing IPs spent a similar time in the active or interrupted respiration phase (Table I).
Analysis of interrupted respiration patterns (IPs). For each individual of the different stations and sediment treatments the occurrence of apneal patterns was recorded.

Burrowing experiments in the field
Smaller animals reburrowed faster than medium- and large-sized animals (Fig. 7). Between stations, no difference was observed between small individuals from stations L1 and L2. In a short-term experiment ten out of eleven small animals of both stations were already completely burrowed at the first time point, i.e. after three hours, and all small animals had reburrowed after six hours. When only large- and medium-sized animals are considered, individuals from the disturbed L1 station appeared to burrow faster compared to animals from station L2 (Fig. 8).
Velocity of reburrowing in different L. elliptica size classes, both stations combined. Differently shaded bars represent mean percent of L. elliptica remaining at the sediment surface (black), 50% reburrowed (grey), 75% reburrowed (light grey) or completely reburrowed (white) after 0, 10, 30, 60 and 110 hours in the different size classes. n = 8 experiments (53 animals) for large size class (shell length 76.04 mean ± 0.86 sem), 4 experiments (14 animals) for medium size class (shell length 62.88 mean ± 1.68 sem) and 5 experiments (60 animals) for smaller size group (shell length 37.31 mean ± 0.56 sem).

Burrowing experiment separated in stations. Differently shaded bars represent mean percent of animals which lay on top of the sediment (black) or were 50% (grey), 75% (light grey) or completely reburrowed (white) after 0, 30, 60 and 110 hours in the different size classes. L1: n = 4 experiments (22 animals) for large size class (75.84 mean ± 1.03 sem), 3 experiments (11 animals) for medium size class (62.07 ± 1.96); L2: n = 4 experiments (31 animals) for large size class (76.18 ± 1.282), 1 experiment (3 animals) for medium size class (65.81 ± 3.14).

Injury experiment: simulation of ice scouring in the laboratory
Neither in the injury groups nor in the control group did any of the small individuals die during the 38 days experimental period. Within the large animal group, only one out of 12 animals died in the control group at day 38. In the injury groups, animals started to die at day 11 and continued to die so that on day 38 none of the animals inflicted with shell cracks and muscle cuts were alive. In the group of animals with siphon cuts only two animals out of twelve were still alive after 38 days (Fig. 9).
Percentage survival of animals under simulated ice scouring inflicted injury experiment in the laboratory. Small (circles) and large animals (squares) were subjected to siphon cuts (grey line), adductor muscle cuts (black broken line) and shell cracks (grey broken line) as well as without injuries as control (black solid line). Note that all lines of the small animal groups are overlapping as no animal died during the treatment.

Discussion
The shallow Antarctic shelf areas off the WAP, where the animals of this study were sampled, is already influenced by increasing air and water temperatures, and future climate change scenarios predict continued aerial and ocean warming (Meredith & King Reference Meredith and King2006, Ducklow et al. Reference Ducklow, Baker, Martinson, Quetin, Ross, Smith, Stammerjohn, Vernet and Fraser2007, Smale & Barnes Reference Smale and Barnes2008). The shallow areas in Potter Cove are periodically smothered by sediment runoff and abraded by icebergs, one of the most intense natural forces in Antarctic shallow water environments (Gutt Reference Gutt2001, Barnes et al. Reference Barnes, Fuentes, Clarke, Schloss and Wallace2006). In the present study we showed that L. elliptica experiences different sediment loads in Potter Cove depending on the location and the distance from the glacial runoff source, wind speed and direction, and the depth distribution of the animals. At station L1, which was situated within the plume of glacial runoff, highest values between 19 and 36 mg l-1 SPM were recorded at 5 and 10 m water depth, where a high number of L. elliptica were found. On the opposite side of the cove, animals were less affected by sedimentation and peak values at the bottom (15 m) amounted only to 7.9 mg l-1 SPM (for comparison with L1: 20 mg l-1 at 5 m depth). Even our small dataset of SPM in the water column indicates that the daily air temperatures seem to have an immediate influence on sediment discharge into the cove. Peaks of SPM at bottom depths were observed mostly following a short period of rapid warming of air temperatures (Fig. 10a & b) and SPM values correlate well with the daily fluctuating air temperature maxima (Fig. 10b). This is in keeping with Dominguez & Eraso (Reference Dominguez and Eraso2007) who reported a direct effect of air temperature on sediment discharge at Collins Glacier for the Potter Cove region. Our data document the immediate effect of short-term rises of air temperature on the marine communities in the vicinity of the glaciers. When temperatures drop at the end of summer (March), creeks freeze and sediment discharge comes to a halt.
a. Individual weekly measurements of SPM in bottom water of the undisturbed station (L2, squares) and the disturbed station (L1, circles) as well as daily average air temperatures (grey circles). Note the high variance in sediment load during the season which follows the air temperature pattern. b. Bottom measurements of SPM on the three sampling stations plotted against the daily average air temperatures at the specific sampling date. Sampling time from 27 December 2006–9 March 2007. Air temperature data from www.tutiempo.net/en/Climate/BASE_JUBANY/10-2001/890530.htm, accessed December 2009).

Both intense sedimentation and ice scouring impact L. elliptica physiology and population dynamics. In our study we analysed several features of bivalve behaviour under stress exposure in relation to size/age of the animals from stations L1 and L2 and some differences emerged. Larger individuals from strongly affected L1 changed respiration rates in response to sediment treatment whereas small animals did not, and on both stations larger animals reburrowed less rapidly and were much more susceptible to injury compared to small individuals. Concerted sedimentation and iceberg stress in an area like Potter Cove could therefore lead to a shift in the population size/age structure of L. elliptica towards more smaller/younger individuals. This is in line with observations of Peck & Bullough (Reference Peck and Bullough1993) and Brown et al. (Reference Brown, Fraser, Barnes and Peck2004) who found a shift towards smaller/younger individuals for the bivalve Yoldia eightsi (Couthouy) and the bryozoans Fenestrulina rugula (Hayward & Ryland) in areas around Signy and Adelaide Island with high ice scouring frequency, compared to less disturbed sites.
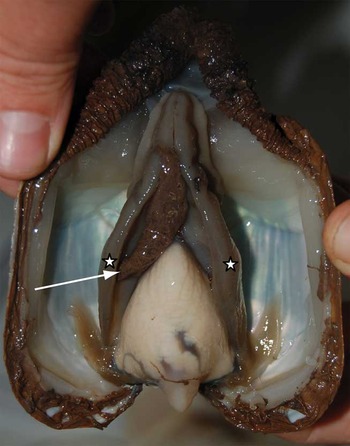
However, the respiratory decrease under sedimentation and faster reburrowing response in the larger individuals of the disturbed compared to the less disturbed station may be first indications of an adaptation the animals undergo when exposed to increased sediment and iceberg impact. Fast reburrowing is necessary in areas with high ice scouring frequency which unearth the individuals from the sediment and expose them to predators. Decreasing respiration rates during sediment exposure has been described for several bivalve species (see Summers et al. Reference Summers, Thorp, Alexander and Fell1996) but the mechanism causing the reduction is not clear. Interrupted respiration event patterns recorded in the present study indicate L. elliptica do not close siphons more often under sediment treatment than under control conditions. Hence, the decreasing respiration rates might be due to impairment of ciliary activity by the silt film covering the gill surface (Stevens Reference Stevens1987, Summers et al. Reference Summers, Thorp, Alexander and Fell1996), or to a general depression of metabolic rate under these conditions. Based on previous studies with temperate Dreissena and Unionid species from North America (Aldridge et al. Reference Aldridge, Payne and Miller1987, Summers et al. Reference Summers, Thorp, Alexander and Fell1996) we would have expected the less disturbed L2 animals to show a depression of respiration and the animals from L1 station to be adapted to high sediment loads and thus, less affected. However, the reduction in oxygen uptake in the large L1 individuals under sedimentation is only 20% compared to control respiration and seems to be a preventive response rather than the drastic drop in respiration by 25–70% observed in different Dreissena species (Alexander et al. Reference Alexander, Thorp and Fell1994, Summers et al. Reference Summers, Thorp, Alexander and Fell1996). We interpret the response pattern at the impacted L1 station as a behavioural change, presumably due to a learning effect of the animals exposed to frequent sediment runoff plumes. Recently undertaken studies on krill and different ascidians in Potter Cove indicate that those groups are much more sensitive to sedimentation than L. elliptica and already respond to concentrations of < 50 mg l-1 with decreased feeding rates and changes of respiration (V. Fuentes, Torre et al. unpublished data). Nevertheless, the bivalves have to transport sediment particles over the gills, cover them with mucus and excrete them through pumping movements (Fig. 11). Higher sedimentation rates that lead to a reduction of aerobic metabolism and increased energy expenses for pseudo faeces production in larger, older animals, which are important for the reproductive output of the population (Abele et al. Reference Abele, Brey and Philipp2009), may therefore in the long run further impact the population structure in addition to the reduced reburrowing ability and injury tolerance.
Ventral view of L. elliptica after sediment exposure. A large amount of sediment packed in mucus (arrow) is located between the gills (stars).
A small number of studies in the Arctic investigated the abundance and community structure of benthic fauna with respect to the sedimentation rate at different distances from the glacier or fjord heads (Syvitski et al. Reference Syvitski, Farrow, Atkinson, Moore and Andrews1989, Holte & Gulliksen Reference Holte and Gulliksen1998, Wlodarska-Kowalczuk et al. Reference Wlodarska-Kowalczuk, Pearson and Kendall2005). A decrease in fauna biomass and richness close to the glaciers in areas with high sedimentation, as well as a diminished abundance of filter feeders and surface detritus feeders is found in these areas. This is consistent with lower numbers/density of L. elliptica in the sediment discharge zone in Potter Cove. Detailed studies of the physiological effect are, however, also missing in the Arctic region.
Taken together, L. elliptica seems to be well adapted as a species to survive under changing environmental conditions with respect to high sedimentation rates and ice scouring frequencies. Sediment effects on respiration are marginal and possibly protective as the decrease in respiration and thus presumably filtration rate will reduce the uptake of inorganic particles during times of high environmental sediment loads. Further, at least the small individuals can rapidly reburrow into the sediment and endure severe injury. This might however change when seawater temperatures increase. Peck et al. (Reference Peck, Webb and Bailey2004) found L. elliptica to suffer 50% failure to reburrow into the sediment at 2–3°C and a complete loss at 5°C. The combined effect of increasing temperature, sediment load and ice scouring frequencies therefore threaten to change the population structure and abundance of L. elliptica if climate change proceeds. In the Arctic small surface deposit feeders such as the bivalves Yoldiella sp., Portlandia arctica (Gray) or Nuculuna tenuis (Montagu) were found in high sedimentation areas fronting glaciers (Syvitski et al. Reference Syvitski, Farrow, Atkinson, Moore and Andrews1989, Holte & Gulliksen Reference Holte and Gulliksen1998, Wlodarska-Kowalczuk et al. Reference Wlodarska-Kowalczuk, Pearson and Kendall2005). Possibly in Antarctic environments like those of Potter Cove, detritus feeders such as polychaetes or the bivalve Y. eightsi (Davenport Reference Davenport1988) will take over in places where L. elliptica will be reduced in abundance. This will change the shallow Antarctic ecosystems as the larger and deeper burrowing L. elliptica has a much greater effect for pelago-benthic carbon flux through biodeposition of material into deeper sediment horizons (Ahn Reference Ahn1993, Momo et al. Reference Momo, Kowalke, Schloss, Mercuri and Ferreyra2002).
Acknowledgements
We would like to thank Oscar Gonzales for the excellent support at Jubany Station and iceberg observations, M. Schwanitz, head of the AWI-Expedition-Diving group, and the Argentinean divers for great field work, J. Strahl for field and laboratory help in the 2006–07 expedition, C. White (University of Birmingham) for provision of the analysis program, as well as comments from two anonymous reviewers which greatly improved the manuscript. The study was funded through the German Science foundation (DFG) PH141/5-1. This paper is dedicated to the Argentine ice breaker ARA Almirante Irizar which was incapacitated in a fire accident in 2007.
Supplemental data
Underwater photographs of sites – see www.journals.cambridge.org/jid_ANS.



