1. INTRODUCTION
The most dramatic social and economic shock to Europe between the Middle Ages and the Industrial Revolution was the arrival of the Black Death in 1347–1349. The first onset of the plague carried off as much as a third of the population. But the plague became endemic for the next 300 years, keeping populations well below pre-plague levels until 1600. The population losses from the plague caused wages to soar to levels that often exceeded even those of the early 20th century.
In this paper, I test whether the Black Death in England had effects on the medieval economy beyond those expected from the population losses. We shall see that the plague was associated with gains in the measured efficiency of the economy, but these gains were transitory and disappeared when population rose towards its pre-plague levels in 1600. In the end, the plague effected no significant long run economic changes.
Historians’ estimates of the wider economic effects of the plague have varied substantially. While there is general agreement that 1066 to 1300 was as an era of expansion and economic growth, and 1300–1349 a period of stasis or retrenchment, the narrative attached to the Black Death has diverged greatly. Michael Postan saw the Black Death as compounding the economic weakness of the early 14th century, and as causing an economic recession that lasted until the 16th century when economic growth revived.Footnote 1 Others, such as A. P. Usher, saw the plague as the final breakup of the institutional bonds that restricted the medieval economy, creating the possibilities for later economic growth. Direct cultivation of manorial estates using labor services became unprofitable, bonded labor acquired new bargaining power in a labor scarce economy, and market forces were set loose to do their creative destruction. The total scale of the economy may have shrunk, but the level of efficiency with which resources were used increased in the new free market economy [Usher (Reference Usher1920, 132)].
Modern descriptions of the Black Death period have been more nuanced, sometimes to the point of obscurity. Richard Britnell, for example, surveying the commercialization of the economy from 1000 to 1500 notes that “change in the medieval period was slower than that of modern times, and yet its cumulative effects are not difficult to demonstrate” [Britnell (Reference Britnell1993, 1)]. But he attributes no importance in this movement to any specific events, such as the plague. Over the years production technology and commercial organization improved slowly, but not in association with any specific events.
Recently, however, claims have been made for the plague having wider social and economic consequences. Plague mortality has been claimed to have helped stimulate a new capital-intensive agriculture, and proto-industrialization [Van Zanden and Van Bavel (Reference van Zanden and van Bavel2004)]. It has been argued to have created new household structures and marriage patterns that limited fertility and thus drove up wages in the move to the Industrial Revolution [De Moor and Van Zanden (Reference De Moor and van Zanden2010) and Voigtländer and Voth (Reference Voigtländer and Voth2013a)]. It certainly created in the interval 1350–1550 a period of high real wages in Europe that were in excess of those in any country until the 19th century. Did the shock of these high wages launch the European economy onto a new social and economic trajectory?
Estimates of GDP in England 1270–1870 by Broadberry, Campbell et al. support the idea that the onset of the Black Death represented potentially a significant break in terms of income per person. Figure 1 shows the Broadberry, Campbell et al. estimated GDP per capita 1270–1600. The onset of the Black Death is associated with a near 50% rise in output per person. But in this picture, it is a one-time upwards movement in output per person, that persists even when population rises again in the 16th century. The Black Death thus seems a key break in English economic history.
Output per person, England, 1270–1599, from [Broadberry et al. (Reference Broadberry, Campbell, Klein, Overton and van Leeuwen2015)].

Though this paper mainly focuses on the years 1349–1600, the material presented here can also be used to address another claimed period of transformation in the pre-industrial England. As noted, 1066–1300 is generally regarded as an era of expansion and economic growth in England in particular, and in Europe in general. Robert Lopez, for example, who coined the term the commercial revolution for the years 950–1350 in Europe, argued that long distance trade in these years “became the driving force of economic progress, and in the end affected every aspect of human activity almost as decisively as the Industrial Revolution changed the modern world” [Lopez (Reference Lopez and Dent1967, 126)]. Others have attributed the growth in England 1066–1300 to improvements in technology.Footnote 2
In a Malthusian world, if population is increasing as a result of technological advance, then population growth will be associated with a rise (at least temporarily) in real wages. Even at the end of the growth phase real wages will be no lower than before. If however population growth is being driven by purely demographic factors such as rising birth rates or declining death rates, then population growth will be associated with lower real wages. The decline of wages with population growth is exactly what we observe in the interval 1250–1317, and indeed over the whole interval 1210–1317, though population and real wage estimates are much less reliable before 1250. Thus, it is possible that nothing of any significance happened to medieval technological and commercial efficiency in the years 1210–1600, that the only forces at play were those of demography and disease all the way from 1210 to 1600.
2. THE BLACK DEATH AND WAGES
After 1348–1349, the Black Death became endemic in England, with widespread outbreaks on the plague recurring every few decades. Thus, while there was a significant initial loss of population of 20–25% in 1348–1349, the population continued to fall in subsequent years, so that by the 1440s at its minimum population was 50% less than in the 1340s. Also in the decades before the onset of the Black Death population had been falling from its medieval high of 5.8 million just before the famine of 1316–1317, to 4.5 million in 1348. So the population by the 1440s was at 2.3 million, just 40% of the population at the medieval peaks of the 1310s. Figure 2 shows the movement of estimated population by decade from 1250–1600.Footnote 3 Also shown in the figure is an alternative population estimate from Bruce Campbell. This shows a much more dramatic population loss from the initial onset of the plague and then for the next 150 years relative population stability. However, the estimated population decline in percent terms from the peak in 1315 to 1450 is very similar: a near 60% decline.
English population by decade, 1250s–1590s.
What was the effect of these population changes on the economy, specifically on wages, land rents, and returns on capital? Annual real wages in England, deflated by the price of domestic expenditures, are shown in Figure 3.Footnote 4 The nominal day wage series here is a weighted average of nominal day wages for farm workers, and nominal day wages for building craftsmen and their assistants. Real wages rose substantially after the onset of the Black Death in 1348–1349, but that advance continued from the 1350s all the way to the 1440s. The wage index here is set at 100 in 1860–9, at the end of the Industrial Revolution. So Figure 3 suggests that by the 1440s real wages in England had attained a level that was within 10% of those at the end of the Industrial Revolution. At their minimum in the 1310s, however, English real wages were only one-third of their level at the end of the Industrial Revolution. So the real wage movements within this period are dramatic.
Real wages, England, 1250–1600.
We can graph these wages against population, as is done in Figure 4. There is a remarkably stable relationship between real wages and population in the interval 1250–1600. It would seem that the movement of real wages in this interval can be explained purely as a response to shocks to the level of population driven by disease and by patterns of family formation. This stable relationship suggests that the Black Death had no further economic consequences than would be created just by the change in the scarcity of labor relative to land and capital. When it reduced population levels, real wages rose. When its severity declined in the 16th century real wages fell back to their earlier levels.
Real wages versus population, 1250s–1590s.
2.1. The Black Death and Economic Efficiency
Clearly, the onset of the Black Death saw no significant change in the relationship between real wages and population. But while wages are the easiest factor payment to measure in the medieval period, they are not an indicator, on their own, of the overall efficiency of production. A Malthusian interpretation of the Black Death period would expect that the shocks to population left the efficiency of the economy (output per unit of input), a function of technology and institutions, also unchanged.
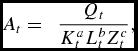
The efficiency of any economy can be measured equivalently in two ways. The first is by measuring average output, Q, relative to a weighted average of input of labor, L, capital, K, and land Z. The weights are the share of factor payments to land, a, labor, b, and capital, c. Thus, if At is the index of efficiency,
 $$\begin{equation}
{A_t} = \ \ \frac{{{Q_t}}}{{K_t^aL_t^bZ_t^c}},
\end{equation}$$
a, b, c are the shares in factor payments of capital, labor, and land respectively.Footnote 5 Though the index has the Cobb–Douglas form, as long as the weights a, b, and c are changed continuously across each period there is no underlying assumption of a Cobb–Douglas technology. In fact, the index is agnostic on the form of the production function. Below these shares are changed every 10 years to reflect changes in the earnings of the different factors over time.
The second, equivalent, efficiency measure is
 $$\begin{equation}
{A_t} = \ \ \frac{{r_{Kt}^aw_t^bs_t^c}}{{{p_t}}} = \ {\left( {\frac{{{r_{Kt}}}}{{{p_t}}}} \right)^a}{\left( {\frac{{{w_t}}}{{{p_t}}}} \right)^b}{\left( {\frac{{{s_t}}}{{{p_t}}}} \right)^c},
\end{equation}$$
where rKt = index of capital rental payments, w = index of wages, s = index of farmland rents, p = output price index.Footnote 6 The advantage of this measure is that it does not require that we estimate the output of the medieval economy.
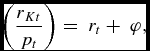
Here, we use this second measure and estimate efficiency by estimating the real payments to capital, labor, and land, as well as the share of each of these in the economy. To implement this measure, because of limitations of information in the years before 1600, I estimate the real return on capital as
 $$\begin{equation}
\left( {\frac{{{r_{Kt}}}}{{{p_t}}}} \right) = \ {r_t} + \ \varphi ,
\end{equation}$$
where rt is the nominal return on risk free assets (here land and rent charges), and φ is an allowance for risk. This makes the measured efficiency of the economy
 $$\begin{equation}
{A_t} = \ \ \frac{{r_{Kt}^aw_t^bs_t^c}}{{{p_t}}} = \ {\left( {{r_t} + \ \varphi } \right)^a}{\left( {\frac{{{w_t}}}{{{p_t}}}} \right)^b}{\left( {\frac{{{s_t}}}{{{p_t}}}} \right)^c}.
\end{equation}$$
To estimate the shares a, b, and c by decade, I need to estimate the quantity of land, labor, and capital employed in each decade. For labor, we have decent population estimates, at least from 1250 onwards. For land, we assume that the same area was cultivated 1200–1600.Footnote 7 There are, however, no estimates of the capital stock, which consisted largely of housing, buildings, and animals. Here, I assume that the capital-output ratio did not change over the years 1200–1600. Since the share of labor and land, b and c, are allowed to vary freely, this is not as restrictive as imposing a Cobb–Douglas production function throughout this period. So to measure whether the Black Death had any effect on economic efficiency, we need to construct series on farmland rentals, and on the risk free return on capital.
2.2. Farmland Rentals, 1250–1600
There are three potential sources of medieval land rental values, where “rental value” is the amount the land would rent for if offered for rent on a competitive basis. The first of these is Inquisitions post mortem, valuations of estates by local juries on the death of the holder. The second is Manorial accounts and manor court records which record income from short-term leases of parts of the demesne. This is the main source used here. But for the 13th century a third source, which suggests even higher land rental values than our demesne leases, are Cartularies, transcriptions of the property charters of religious houses and private families. These mainly show the prices of land, but this can be easily converted into implied rental values.Footnote 8
Each of these sources unfortunately has its limitations. And they also seem to give conflicting information as to the market rental values of land. Their temporal coverage is as follows:

The IPMs have been used extensvively by Campbell, Raftis, and others to examine the relative values of land in different counties. These inquisitions, however, record rental values for arable land particularly that are extraordinarily low. Poos, for example, in his study of Essex finds that in the period 1377–1399, the IPMs value arable at 3.1 d. per acre, the manorial accounts at 6–7 d [Poos (Reference Poos1991), 48–50)]. I shall show below that manorial accounts and charters consistently suggest land rental values greatly in excess of those recorded in the IPMs. We thus concentrate here on these sources.Footnote 9
On at least some years in many manors parts of the demesne would be leased out piecemeal at will or for a term of years. This leasing would be recorded in manorial accounts under the heading “firme” as opposed to “redditus assise”. Sometimes these rents are recorded as such with no indication of the length of the lease or when it was formed. In other cases, it may be recorded such as “leased for 10 years this being the second”. Now, land could be leased for a fixed rent per year, or it could be leased for an initial payment, an entry fine, followed by a lower annual rent.Footnote 10 These entry fines if they existed are not recorded for specific holdings in the accounts, and thus the rents reported may understate the true rents per acre.Footnote 11 If these entry fines were significant relative to the annual rents, and their size changed over time, this would potentially lead to a misleading index of rent movements from this source.
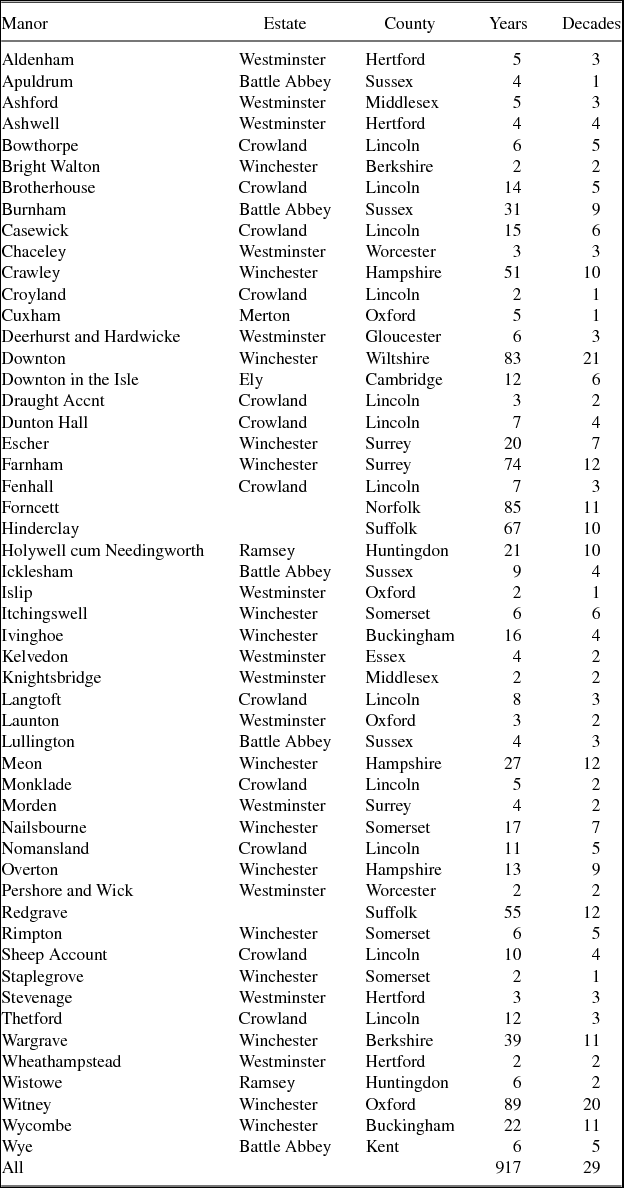
Utilizing a variety of sources, I have constructed a data set of such land farms from 1210 to 1499. The total number of individual plots observed is 3,098. But some manors produce many plots in a single year. Thus, there were 48 plots observed in Hinderclay, Suffolk in the year 1400, but only one plot in Aldenham, Hertford in 1301. To avoid overweighting manors where we have a lot of observations, I calculated for each manor in each year the total amount of land at farm and the total rent, constructing thus one observation for each manor in each year. If the sources indicated that land was farmed on a 10 year lease, I created an observation only for the first year of the lease even if the lease was recorded in multiple accounts. To control for variations in the average value of land in different manors, and for potential variations in land measures, I also retained in the data set for estimation only those manors where land was observed in at least two years. What I estimate statistically is thus the average movement of rents across the decades in a set of manors controlling for differences in the level of rent in each manor so that changes in the composition of the data from decade to decade do not influence the results.Footnote 12 This reduced the data to 52 manors with 1,013 years observed in total.
Table 1 summarizes the surviving observations in this data set. First is listed the manor, then the estate to which it belonged, the county it lay in, the number of years in which there were observations, and finally the number of decades in which there were observations.
Manorial land farm data
To estimate the average level of rent in each decade, the following expression, in simplified form, was fitted to the data, where TYPE indicators the share of land of various types, DEC the decade, and Manor is an indicator for each location. The øj provide an index of the movement of rents by decade, controlling for land types and location.
 $$\begin{equation*}
\log (rent/area) = \sum {{\beta _i}TYPE}_i + \sum {\varphi _j}DEC_j + \sum {{\theta _k}Manor_k} + \varepsilon ,
\end{equation*}$$
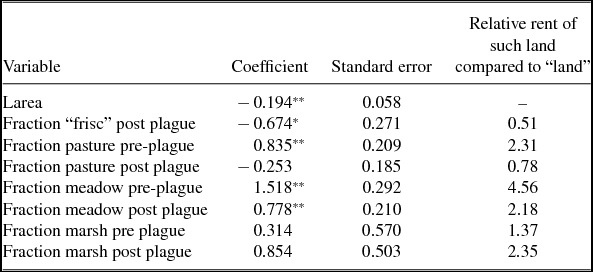
The level of rent per acre (in logarithmic form) in each of the 29 decades was thus estimated allowing for differences in the type of land and the buildings associated with land with a set of TYPE variables, and for differences in the average level of rents across the 52 different manors used. Sometimes the accounts specified that land was arable, pasture, meadow, marsh, or “friscus” which was arable land turned to pasture use. Overall about 40% of land was described in such terms, the other 60% just being described as “land”. In the estimation, it was assumed that most of this “land” was arable since the overwhelming majority of land in medieval England seems to have been arable. Also sometimes land was leased with associated messuages, houses, cottages, or “tofts”. Further at least in the years after 1600, there is a tendency for land leased in larger parcels to let for less per acre, so that the average plot area in each year was also included as a control in the regression.
To allow for changes in the relative value of pasture, meadow, marsh, and “frisc” after 1349 and the onset of the Black Death, these type effects were estimated separated for the years before and after 1349. This yielded 12 type variables in all.Footnote 13Table 2 shows the estimated effect of the land use variables. As can be seen, for example, meadow shows up as the most valuable land type as we would expect. Before the plague, it is estimated as renting for an average of nearly five times the rental of “land”. After the plague onset, it rents for 2.75 times the rental of “land”. “Frisc”, arable turned as fallow or permanently to pasture is less valuable than “land” both pre and post plague. Plots with “messuages”, “houses”, “cottages”, or “tofts” attached in general rent for more. Thus, the estimation of rents in this way generally produces sensible results as far as these land types and attributes are concerned.
Estimated effect of the control variables
Notes: **significantly different from 0 at 1% level, *significantly different from 0 at 5% level. Standard errors clustered at the manor level.
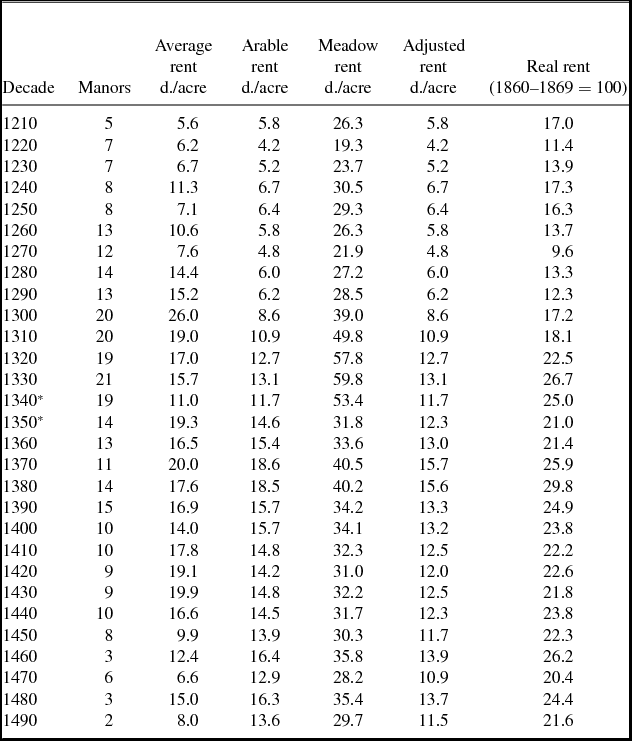
The shift in relative values of land after the plague is clear and statistically significant in the case of both pasture and meadow. Grassland and meadow both becomes less valuable relative to arable. Indeed when we plot the average estimated value of arable and meadow by decade (correcting for location, area etc.), as is done in columns 4 and 5 of Table 3, we see surprisingly that in nominal terms arable and “land” show little decline in rental value after the plague, but the nominal value of meadow drops by about half. The reason this result is surprising is that arable land was the land on which most labor was employed, and where a rise in the cost of labor would hurt the land owners most. However, two processes seem to have been at work which could explain this result. First, after the plague more land was used as pasture and meadow. Presumably, the land transferred was not as valuable as the land used as meadow before the plague, depressing rents. And the land kept as arable would be the land most productive in this use. Second, there is some sign that the price of grains rose relative to the price of pasture products: after 1349 there was about a 25% rise in the relative price of grains.
Estimated average rents per acre by decade
Notes: The average rents in each case are averages across the rent levels in all the 52 manors. *1340–1348 and 1349–1359.
Given these estimates, we can estimate the average rental value per acre in each decade by assigning land in proportion to arable, meadow, pasture, and frisc. In the data, I have the overall proportions before 1349 are 68% “land” or arable, 0% frisc, 1% pasture, and 26% meadow. After 1349, the proportions are 78% “land” or arable, 2% frisc, 8% pasture, and 10% meadow. But these proportions are heavily influenced by the type of manors which happened to be included in each period. So instead for weighting, I rely on data from the Inquisitiones Post Mortem reported in Campbell et al. (Reference Campbell, Galloway and Murphy1992) and Poos (Reference Poos1991).Footnote 14 This suggests a weighting before 1349 of arable at 88%, pasture at 6%, and meadow at 6%, but after 1349 of arable 68%, frisc 2%, pasture 18%, and meadow 12%. With these weightings, we get the implied average nominal rents shown in column 6 of Table 3. For comparison, the raw estimates of average rents by decade are shown in column 3 of the table.
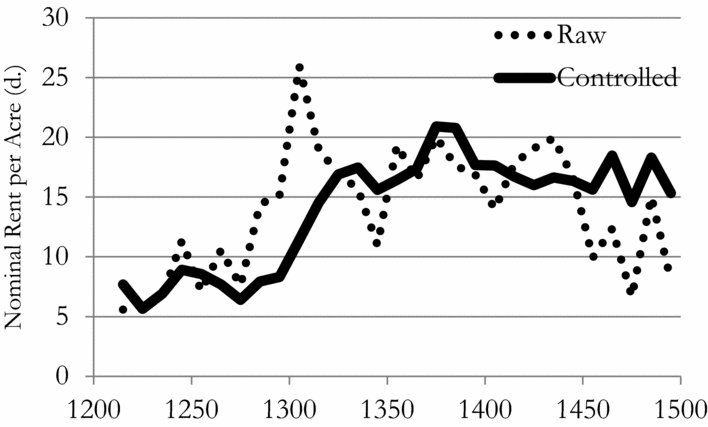
Figure 5 portrays estimated average nominal rents by decade from these manorial sources, controlling for location and type (column 6 of Table 3), compared to the raw decadal averages (column 3 of Table 3). Surprisingly, there is no decline in nominal farmland rents after the onset of the plague, despite significant gains in nominal wages.
Nominal rents per acre, 1210–1500.
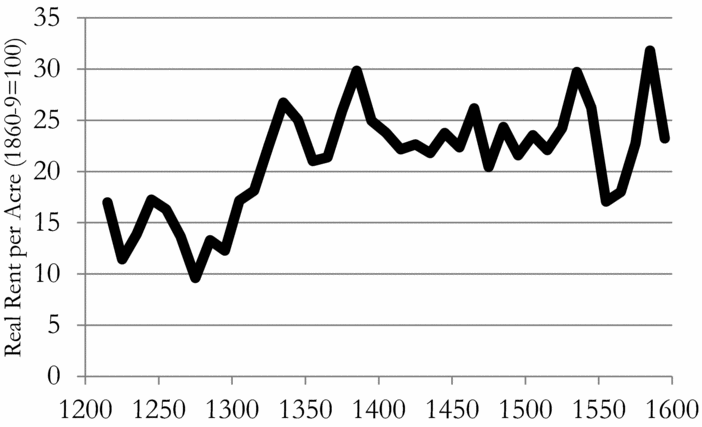
Figure 6 shows real land rents per acre from 1210 to 1600 (nominal rents deflated by the domestic output price level), as an index, with rents in the 1860s set at 100. The medieval rent series has been spliced to a later series derived from the rentals of lands held by charities, 1500–1914 [Clark (Reference Clark2002)]. The big surprise here is the failure of real land rents to decline from 1350 on after the onset of the Black Death, given the large rise in wages in these years. As can be seen, real land rents are largely flat from the 1330s to the 1590s, changing little in response to the large changes in population. If these numbers are correct, there would have been little real loss to landowners consequent on the plague. Land let on customary terms before the plague which were below real market rental values would continue to supply these payments, since the market rental value fell relatively little. Demesne land directly cultivated should have brought in incomes no less than those of the pre-plague level, even when leased to farmers. The wage gains after the onset of the plague were seemingly not mainly just a transfer of income from land owners. These modest real rent declines after the plague also suggest that it is unlikely that there was any abandonment of cultivation on marginal land.
Real rents per acre, 1210–1600.
Equation (4) above implies that for the efficiency of the economy to have been unaffected by the plague, real land rents would have fallen to explain the rise in real wages. The fact that they fell little, if at all, implies that unexpectedly the reason for the rise in real wages after the onset of the plague was not just the relative shortage of labor, but also gains in the efficiency of the economy.
2.3. Rates of Return on Capital
There seems to be only one feasible source of information on medieval rates of return on capital and this is from the cartularies constructed by religious houses and secular land owners. A cartulary was a collection of copies of documents transferring land and other property by gift or by sale to a religious house, compiled to record the various property holdings of the institution or family. Over the years, many of these cartularies have been printed.
One property transferred in these deeds was rent charges – payments of specified nominal sums of money in perpetuity secured by houses or land. Where the deed specifies a “gersuma”, an amount of money paid for the transfer, the implied rate of return on the capital so invested is just the rent divided by the payment. Transfers deeds from the 1170s up until the 1310s often contain statements of the amounts paid for the rent charge. After this, the deeds general contain no statement of the amount paid for the rent.
A problem with these deeds as a source is that the transfer may not reflect the full price paid for the rent. The medieval legal system apparently countenanced later claims by the spouse and the heirs of someone selling property. So sometimes the deeds of institutions or families include also deeds from these potential claimants renouncing their claims to the property. If only some of these deeds survive to be copied into the cartulary at a later date, then only part of the full purchase price of the property will be recorded. In this case, the apparent rate of return on the purchase will be inflated.
A second problem is that many of the surviving transactions are transfers of rents to religious institutions. If there is an element of gift in the transfer again the purchase price will be depressed and the return inflated. If there is an element of charity, the price may be inflated and the return correspondingly depressed. We can check on this possibility, however, by comparing the returns on transfers of rents between lay parties and between lay and religious.
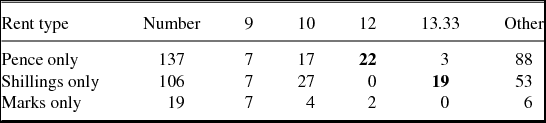
Figure 7 shows the range of years purchase (the inverse of the rate of return, and the way prices were in fact calculated) for all the transfers recorded before 1300 when the median rate of return as we shall see seems to have been stable at around 10% or 10 years purchase. As can be seen, there is a considerable range in the years purchase paid, ranging from 2 to 53. But almost half the transactions involved a year's purchase of between 9 and 11. Some of this variation in the years purchased used seems just to have stemmed from computational convenience. If a rent is denoted in pence only, then if it is capitalized at 12 years purchase the sum required is just the same numbers of shillings. Similarly, if a rent is denoted in shillings only, then if it is capitalized at 13.33 years purchase the capital sum in just the same in marks. If the rent is measured in marks only, there is no particular years purchase that will make the capital sum easy to calculate. Table 4 shows the years purchase used when the rent was denoted in pence only, in shillings only and in marks only in the years before 1300.
The distribution of years purchase before 1300.
Years purchased used and the denomination of rent charges before 1300
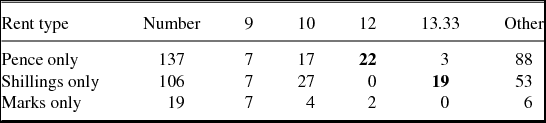
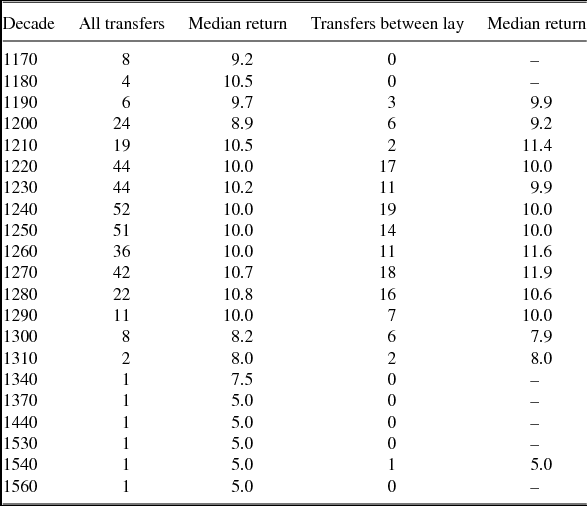
Table 5 lists the number of rent charge sales where a consideration was recorded from 40 cartularies by decade, with the limitation that the consideration had to be at least two times the rent transferred. Where a range of years was given as the possible date for the deed, the midpoint year was used to assign it to a decade. The total number of calculated returns is 384. The table also shows the median rate of return implied by these transfers for each decade. The median rather than the mean is used to avoid over weighting the problematic transfers with very low and very high consideration prices. As can be seen, the median rate of return is typically about 10% for the years before 1300. This is true also if we restrict ourselves to transfers between lay parties where there might be less likelihood of a gift by one party or the other. By the 1370s, all five transactions imply a rate of return on capital of only 5%. Other evidence for the early 1400s confirms that by then the typical return from rent charges was only 5%. Thus, sometime between 1300 and 1400, the rate of return earned by capital seems to have roughly halved.Footnote 15
The rate of return from rent charge conveyances
Sources: See the list of printed cartularies in the bibliography.
The evidence from the 11 transfers between 1300 and 1348 is that some of this decline had already occurred before the plague struck. Thus, the median return in these years was 8.1%, which is lower than in any of the previous 13 decades with evidence on returns. The chance that in choosing 11 returns from the sample of returns seen in the years before 1300, that at least six would be below 8.2% or less can be calculated at 0.5 in 100.Footnote 16 Thus, we can say with better than 99% confidence that the rate of return was lower in the years 1300–1349 than before. Thus, there is clear sign that the rate of return had begun to fall already by 1300 long before the onset of the Black Death, and that the fall in returns on capital between 1300 and 1400, dramatic as it was, had no connection with the Black Death.
The fall in rates of return from above 10% in 1300 to 5% by 1400 was the most significant change in real rates of return in English history. Rates of return on rent charges did fluctuate somewhat after 1400, climbing back up to rates of 6% in the early 17th century, and eventually falling just below 4% in the late 19th century. But no period witnessed return on capital that ever again equaled those of the 13th century. The decline in rates of return should be associated with significant increases in income. With a reasonable ability to substitute capital for labor and land in the economy a fall in the real return on capital will imply much greater amount of capital is used per person, and consequently output per person will increase. Goods which embody a lot of capital such as housing and roads become much cheaper relative to their replacement costs. Consequently, at the same level of income workers in 1400 could consume much more housing space than in 1300. If a house, for example, costs 100/- to construct, then its annual rental cost will have to include 10/- in 1300 to cover just the capital embodied in the construction. By 1400, this element of rental costs would have fallen to 5/- with the lower rates of return. In areas such as the countryside where the main rental cost of housing would be construction costs (as opposed to site rental values as in the center of cities), housing consumption per capita should thus have increased sharply by 1400 as a result of both higher labor incomes, and of lower rental costs. Similar arguments will apply to a whole range of improvements to the infrastructure such as roads, mill ponds, weirs, and land drainage.
Why 1300 should be such a significant turning point in capital markets in England is mysterious. It is not associated with any significant legal or institutional developments, in state or in church. The expulsion of the Jews in 1290 would not be expected to have any effect on capital markets. The Jewish community was small, and had been forbidden from engaging in lending at interest since 1275 by an earlier Statute of Jewry. And at their expulsion their assets were seized by the Crown.
2.4. The Efficiency of the Medieval Economy
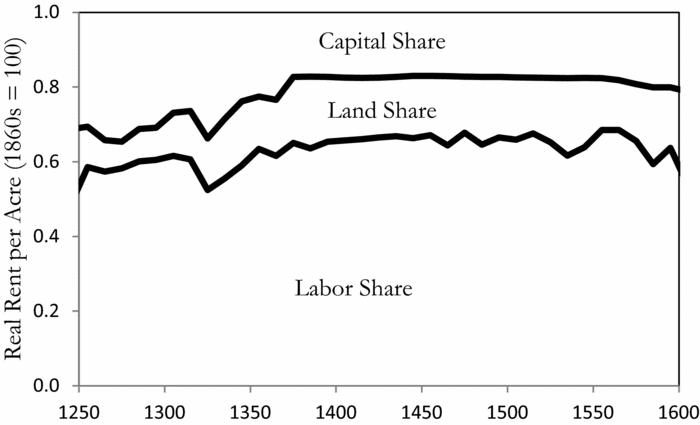
We now have the ingredients to estimate the overall efficiency of the English economy over the course of the Black Death years: output prices, wages, land rents, and returns on capital. To implement equation (4) above, the final element we need is the weights of capital, labor, and land in overall factor payments. Total implied wage payments are calculated from the population and the average day wage, assuming that workers work on average 300 days per year. The number of days worked per year for the average worker can be estimated for England circa 1800, and is this same number 300. With this assumption, payments to labor are typically more than 50% of factor payments, and the movement of real wages will dominate in estimating the efficiency level of the economy. Three hundred work days may be too high a number for medieval workers, especially given the large number of Feast Days where no work was supposed to be performed in the church calendar. But the evidence for a significantly smaller number of work days is limited.Footnote 17 So for want of a better figure it is adopted here. We consider below what the effects on estimated efficiency would be from assuming just a 200 day year. Total land rents are extrapolated back from a series for 1500–1914, assuming that the cultivated land area did not change 1250–1500 from its later level. There is no direct way of estimating the actual capital stock – houses, roads, bridges, ships, horses, livestock, implements. So here we just assume that the capital-output ratio was the same as for England in later years. This generates the implication that the large decline in the rate of return on capital witnessed over this period will be associated with a decline in the implied share of output paid to capital owners. Figure 8 shows the implied factor shares in income by decade 1250–1600.
Assumed factor shares, 1250–1600.
Figure 9 shows the implied level of efficiency of the economy by decade 1250–1600. The first surprising thing that emerges is the high estimated efficiency level of the economy, compared to the benchmark of the 1860s at the end of the Industrial Revolution. In the 1440s, the measured efficiency of the economy comes within 90% of its level at the end of the Industrial Revolution. The second surprise is that there is no apparent gain in economic efficiency all the way from 1250 to 1590. The third surprise is that the onset of the Black Death causes a distinct rise in the measured efficiency of the economy. This rise seems to be proportional to the population loses created by the plague. For if we graph estimated efficiency against the population level for 1210–1600, as in Figure 10, we see a quite distinct negative relationship.
Efficiency level of the economy by decade, 1250–1600.
Efficiency versus population by decade, 1250–1600.
Our expectation would be that economic efficiency would be independent of population. Yet, clearly in Figure 10 that in periods where population declined, 1310–1450, economic efficiency increased, and in periods where population advanced, 1250–1310 and 1450–1600, efficiency declined. This inverse population-efficiency relationship is not just an artifact of the Clark (Reference Clark2007a), population estimates. It can be seen in Figure 11 if we use instead the Campbell population estimates.
Efficiency versus population (Campbell) by decade, 1250–1600.
The growth of population 1250–1310 is that not a consequence of any measurable increase in the efficiency of the medieval English economy in this interval. Instead wages fall, returns on capital stagnate or fall, and land rents are flat. It is growth driven by demographic factors, such as exogenous changes in fertility or mortality, not efficiency advance.
From a low point in the 1310s, the measured efficiency of the economy steadily increases as population contracts from the 1310s to the 1440s. From the lows of the 1310s to the highs of the 1440s, there is a more than 70% gain in measured efficiency, largely driven by the extraordinary rise in real wages. However, the shock of the onset of the plague is not associated with any abrupt upturn in efficiency. There is instead a relatively smooth upwards movement as population contracts across this long interval.
Once population starts to increase again, however, measured efficiency declines, and the decline is sharper relative to population gains to the 1590s than was the rise from the 1310s. As a result, the measured efficiency of the English economy in the 1590s is no greater than in the 1310s, the previous low point in the middle ages. There is 350 years of stasis. Note, however, that the late 16th century was a period of significant inflation, and that though the rents measured here are aimed at being market rents, there may have been lags in adjustment since this followed a period of 300 years where nominal rents were flat or declining.
Are there potential problems with this efficiency measure that this covariance with population reveals?
The land rents here before 1500 reflect payments for land leased out from manorial desmesne to private cultivators. We are thus in some sense estimating the rental of the best practice cultivators, those who had to compete for their land in a competitive rental market.
If the efficiency of cultivation was lower on the directly cultivated demesne land, or on peasant land held under customary non-market rents, then the rents here would give an upward biased measure of the rental value of all land. But this would require that both the spiritual and temporal lords, and the peasants, preferred to cultivate land directly rather than lease it out for more profit. Thus, we are potentially overestimating rents, and hence economic efficiency, before 1500. But the long-term trend within that period would not be affected. And since the weight of rents in total output would be smaller than calculated here, the swing upwards in efficiency 1310–1440 would be even stronger, since real wages are the variable moving most dramatically across time.
A more significant issue is that we have assumed labor to be fully employed, and working 300 full days a year, in calculating the labor share in national factor payments. Some historians, such as John Hatcher, have argued that the extraordinarily high real day wages of the period 1350–1550 are not a good guide to annual labor earnings [Hatcher (Reference Hatcher, Dodds and Liddy2011)].Footnote 18 Workers were engaged for modest numbers of days per year at these wages, spending the rest of their time unemployed or working for much lower rewards on their own holdings. However, in the relatively free labor market of 1400 why would employers pay such high day wages in this case? If paid employment generated such a premium over the alternatives, why didn't these wages get bid down by workers anxious for these opportunities?
We can observe in all periods a part of the year when there was full employment. This was the harvest month, where all available labor was put to work. The amounts of grain and the numbers of acres harvested per farm worker increased substantially after the Black Death onset. Thus, the wages at harvest even in 1350–1550 would reflect the true market clearing wage. If the day wages of 1350–1550 were above market clearing levels the parts of the year outside harvest, then we would expect to see in these years, compared to 1600 and later, a compressed harvest wage premium. But we see no such thing. The harvest wage premium is similar all the way from 1250 to 1870 in England, as is shown in Figure 12, suggesting a competitive labor market in all the pre-industrial era.
The harvest wage peak, 1270–1869.
There is no evidence on the length of a day in the medieval period, since clocks were rare. But there is indirect evidence in the form of the amount of standard types of labor that piece workers are calculated to have accomplished in a day. For threshing wheat by hand, for example, a worker in 1300 produced five bushels per day, more than in 1850 [Clark (Reference Clark2007a, Table 7)].
Another possibility is that workers voluntarily chose to work fewer days per year, because of a greater preference for leisure. As noted above, there is some evidence that days per year were somewhat lower in the middle ages, though nothing conclusive [Clark and van der Werf (Reference Clark and van derWerf1998)]. When accounts refer to workers working for a week in 1800, for example, they always are attached to a wage payment which is six times the daily wage. In medieval accounts, sometimes a work week equals just 5.5 days of wages. But such references are a minority, and for building workers the six day week was in the majority of references all through the years 1250–1550. So the average work week may have been shorter on this evidence – but only by very modest amounts.
But we do not know if workers took many weeks off, or if they worked irregular days each week. The accounts of Exeter Cathedral, for example, show individual building workers hired far less than 300 days per year. Voth (Reference Voth2001), interprets this as suggesting medieval workers worked few days per year. But when they were absent from the Cathedral, they may have been engaged elsewhere. If you had used the records of my recent house remodel to measure the number of days worked by workers now, you would have concluded that building workers put in less than 100 days per year.
If the day laborers of the 13th–15th centuries were largely landless, then likely they worked all through the year, since they needed their wage to sustain themselves. But the extent of the landless laboring population is not known. So the balance of the evidence seems to be that the length of the day was similar, and that there may have been somewhat fewer days worked per year, but with no strong evidence supporting this.
If the days worked per year was substantially lower in the medieval period, then again it would affect the efficiency calculated through equation (4) by changing the weights of the different factors in the economy. The share of labor, b, would fall and that of land and capital rise. But the effects on these shares would be relatively modest. If the average work year was 250 days as opposed to 300, for example, then the estimated share of labor in the 1400–1409 would fall from 62% of earnings to 58%, and in 1300–1309 from 56% to 51%. Even a 200 day year would change the share in 1400–1409 from 62% of earnings to 53%, and in 1300–1309 from 56% to 46%. These changes would mute the inverse correlation between population and measured economic efficiency. But they are not sufficient to remove it. So the puzzle would remain. Indeed even if medieval workers on average only worked 150 days a year, half the level of 1800, wages would still constitute typically 40–50% of earnings in the years before 1600. In that case, the movement of wages between 1350 and 1450 would still imply gains in overall economic efficiency between 1350 and 1450, given that land rents did not decline in this period, and that capital returns were only about a quarter of income.
The rise in efficiency between 1310 and 1440, when population fell from 6 to 2.2 million, is all the more surprising given the shrinking size of the economy. In trade and industry, we would expect economies of scale, which were being lost as the population size contracted. Certainly England in the years 1350–1500 was largely a rural economy, with none of the urbanization and concentration of population which would be expected to lead to greater efficiencies in trade and manufacture [Clark (2013)]. The populations of cities such as London contracted somewhat after the onset of the plague, though not in proportion to the national population decline.
This raised the issue of whether there was a positive effect of higher wages on worker nutrition, stature, and work abilities that explains the correlation of measured efficiency with population? Could it be that the very well fed workers of 1450 were capable of delivering much more work than the undernourished workers of the lean years around 1300? As noted, the workers of 1400 mowed more meadow per day, reaped more acres of wheat per day, and threshed more grain per day than those of 1300. The work rate was 33–40% higher, which if it represented a true gain in labor inputs per worker would explain most of the puzzle of higher efficiency when population was lower [Clark (Reference Clark2007a, Table 7)]. However, an alternative explanation is that the work technique was adjusting in response to the greater cost of labor, with workers sacrificing output to get work done more quickly. Fields reaped rapidly in 1400 may have seen more grain scattered to the ground and so lost than in 1300. While a nutrition based enhancement in work capabilities is an intriguing possibility, discriminating between this and simple labor saving in response to higher labor costs is not easy. Thus, the increase of economic efficiency in response to population declines remains an unsolved mystery of the medieval economy.
2.5. CONCLUSION
The Black Death in England was associated with a surprising, but temporary, increase in the efficiency of the medieval English economy. This efficiency gain, which by the 1440s made the measured efficiency of the economy come within 10% of its level by the end of the Industrial Revolution in the 1860s, as well as the scarcity of labor, are both important in explaining the extraordinarily high living standards of 1450. However, these efficiency gains receded as soon as population began to rise again after 1500. The early high wage era did not lead to any permanent enhancement of economic growth rates through technological innovation, as has been alleged to be the effect of high wages in the Industrial Revolution of 1780 and later [Allen (Reference Allen2009, Reference Allen2011)]. Thus, the Black Death and associated population losses created no permanent break in the long history of the pre-industrial English economy. Had the Black Death not occurred, and population never suffered its long decline 1350–1450, we would seemingly have been at the same place in 1600.
The efficiency estimates in this paper also suggest that the expansion of the English economy 1200–1315 was driven by demography, and not by efficiency gains within the medieval economy driven by the expansion of trade and commerce or other forces. From 1250 to 1310, the measured efficiency of the economy actually declined as population and trade expanded, and towns grew. Real returns to labor and capital were both declining, and though land rents were rising they did not compensate for the declines to these other factors of production.
MANUSCRIPT SOURCES FROM MANORIAL ACCOUNTS
Beveridge Collection, Robbins Library, LSE. Extracts from manorial accounts.
Battle Abbey: Burnham, Icklesham, Morley (Box H7). Apuldrum, Bright Walton, Bromlain, Brownmarsh, Dengemarsh, Hutton, Lullington, Sampford, Wye (Box H8).
Crowland Abbey: Oakington (Box G10)
Hinderclay (Box G14)
Redgrave (Box G15)
Winchester: Brightwell, Downton, Escher, Farnham, Itchingswell, Ivinghoe, Meon, Nailsbourne, Overton, Staplegrove, Witney, Wargrave, Wycombe (Box A46).
Westminster Abbey: Knightsbridge (Box P1). Aldenham, Launton, Morden, Todenham, Turweston, Westerham (Box P5).