1. Introduction
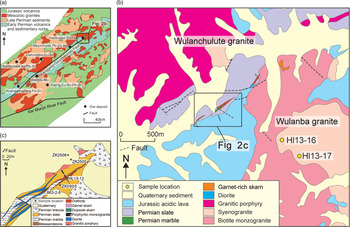
The Great Xing’an Range (GXR) is located in the eastern part of the Central Asian Orogenic Belt (CAOB) where the Palaeozoic Palaeo-Asian tectonic domain is superimposed on the Mesozoic Western Pacific tectonic domain in the east and the Mongol-Okhotsk Ocean tectonic domain in the northwest. This region is believed to have experienced the world’s largest amount of juvenile crust formation during Neoproterozoic to Phanerozoic times (Fig. 1) (Nie et al. Reference Nie, Jiang, Su and Wang2002; Jahn, Reference Jahn, Malpas, Fletcher, Ali and Aitchison2004; Wu et al. Reference Wu, Zhang, Wan, Chen, Xiang, Pirajno, Du, Qu and Wu2011a,b; Zeng et al. Reference Zeng, Liu, Chu, Wang, Sun, Duan, Zhou and Qu2013; Zhai et al. Reference Zhai, Liu, Wang, Yao, Wu, Fu, Liu, Wang and Li2013). Three periods of granite magmatism occurred in the GXR: Late Palaeozoic calc-alkaline volcanic rocks and later A-type granites, Triassic to Jurassic highly fractionated I- and A-type granites, and Cretaceous I-type granites followed by A-type granites (Li & Yu, Reference Li and Yu1993; Wang & Zhao, Reference Wang and Zhao1997; Wu et al. Reference Wu, Jahn, Wilde and Sun2000, Reference Wu, Sun, Li and Wang2001, Reference Wu, Sun, Li, Jahn and Wilde2002; Sun et al. Reference Sun, Wu, Li and Lin2001). However, distinguishing between the A-type granites and the highly differentiated I-type granites is difficult (Chappell & White, Reference Chappell and White2001; King et al. Reference King, Chappell, Allen and White2001). In the southern part of the Great Xing’an Range (SGXR), the skarn-type, hydrothermal vein-type and porphyry-type deposits in the Huanggang–Ulanhot polymetallic metallogenic belt are all related to the Early Cretaceous magmatism (~143–129 Ma), which was caused by magmatic underplating in an extensional tectonic environment at < 145 Ma (Fig. 2a) (Zhang et al. Reference Zhang, Gao, Ge, Wu, Yang, Wilde and Li2010a; Jia et al. Reference Jia, Wei, Gong and Zhao2011; Jiang et al. Reference Jiang, Nie, Bai, Liu and Liu2011a, Reference Jiang, Liang, Liu and Liu2012, Reference Jiang, Chen, Bagas, Liu, Han, Kang and Wang2017; Zhou et al. Reference Zhou, Mao and Lyckberg2012; Wang, Reference Wang2015; Liu et al. Reference Liu, Jiang and Bagas2016, Reference Liu, Jiang, Bagas, Han, Chen and Kang2017). As a typical skarn deposit, the geological characteristics, mineralization and ore-forming processes of the Haobugao Zn–Fe deposit have been studied in detail (Fig. 2b, c; Zhang et al. Reference Zhang, Ai, Bao and Rui1994; Sheng & Fu, Reference Sheng and Fu1999; Wang et al. Reference Wang, Xu, Zhao, Bao, Xu and Xiong2004, Reference Wang, Xu, Lv, Wei, Mei, Fan and Sun2018; Li et al. Reference Li, Wang, Quan, Sun, Zhao and Zhang2016; Liu et al. Reference Liu, Jiang, Bagas, Han, Chen and Kang2017). Liu et al. (Reference Liu, Zhou, Zhang, Yuan, Liu, Zhao, Sun and White2018) proposed that the Haobugao skarn-type mineralization (134–139 Ma) is mainly related to the Wulanba granite (137–144 Ma). However, several periods of magmatism have been identified around the mining area (Fig. 2b) (Li et al. Reference Li, Wang, Quan, Sun, Zhao and Zhang2016, Reference Liu, Jiang, Bagas, Han, Chen and Kang2017). Therefore, apart from geochronological data, direct geological field evidence is required to assess the potential of using magma mineralogy to identify ore-related rocks. In addition, Liu et al. (Reference Liu, Zhou, Zhang, Yuan, Liu, Zhao, Sun and White2018) classified the Wulanba granite as an A-type granite, whereas we classify it as a highly differentiated I-type granite.
(a) Simplified geological map showing the location of the Central Asian Orogenic Belt; and (b) geological map of the Great Xing’an Range and its adjacent areas (modified after Liu et al. Reference Liu, Jiang, Bagas, Han, Chen and Kang2017).

Geological map of (a) the Huanggangliang–Ganzhu’ermiao metallogenic belt in the southern part of the Great Xing’an Range; (b) the Wulanba granite and its adjacent areas; and (c) the Haobugao Zn–Fe deposit (modified after Liu et al. Reference Liu, Jiang, Bagas, Han, Chen and Kang2017).

Apatite (Ca5(PO4)3(F, OH, Cl)) can record important petrogenetic and metallogenic information concerning the volatile composition and magmatic properties of ore-related rocks (Mathez & Webster, Reference Mathez and Webster2005; Marks et al. Reference Marks, Wenzel, Whitehouse, Loose, Zack, Barth, Barth, Worgard, Krasz, Eby, Stosnach and Markl2012; Scott et al. Reference Scott, Humphreys, Mather, Pyle and Stock2015; Pan et al. Reference Pan, Hu, Wang, Bi, Zhu and Li2016; Chakhmouradian et al. Reference Chakhmouradian, Reguir, Zaitsev, Couëslan, Xu, Kynický, Mumin and Yang2017; Mitchell et al. Reference Mitchell, Chudy, McFarlane and Wu2017). In addition, the geochemical composition of apatite may be an effective indicator of potential minerals in porphyry deposits, which could aid in exploration efforts (Ballard et al. Reference Ballard, Palin and Campbell2002; Qiu et al. Reference Qiu, Yu, Santosh, Zhang, Chen and Li2013; Zhang et al. Reference Zhang, Sun, Wang, Zhang, Sun and Wu2017). Although skarn deposits are similar to porphyry deposits (Mao et al. Reference Mao, Wang, Lehmann, Yu, Du, Mei, Li, Zang, Stein and Zhou2006; Sillitoe, Reference Sillitoe2010), the analysis of apatite in skarn deposits is rare (Ding et al. Reference Ding, Ma, Lu and Zhang2015; Zhong et al. Reference Zhong, Feng, Seltmann, Li and Dai2018). Defining the distinct geochemical signatures of the fertile and barren rocks in the Haobugao skarn deposit may enhance our understanding of the role that magmas played in the formation of the deposit. In this study, the major/trace-element geochemistry and the Sr–Nd isotopic compositions of apatite grains from the Wulanba granite were analysed using electron microprobe analysis (EMPA) and laser-ablation inductively coupled plasma mass spectrometry (LA-ICP-MS). Whole-rock geochemical, geochronological and Sr–Nd–Pb–Hf isotopic data were also obtained. In this paper, we attempt to (1) constrain the origin and petrogenesis of the Wulanba granite; (2) identify the ore-related rock; and (3) examine the different geochemical characteristics of the fertile and barren rocks in the Haobugao deposit based on apatite geochemistry.
2. Regional geology
The GXR is located in the eastern CAOB between the Siberian Craton to the north and the North China Craton to the south (Fig. 1a). The SGXR is bounded by the Erlian–Hegenshan Fault to the north, by the Xar Moron Fault to the south and by the Nenjiang Fault to the northeast (Fig. 1b). This region has a complex geological history characterized by the evolution of the Palaeo-Asian Ocean in Palaeozoic to Early–Middle Triassic times, the closure of the Mongol–Okhotsk Ocean in the northwest and the subduction of the Palaeo-Pacific oceanic plate in the east since Late Triassic time (Wang et al. Reference Wang, Zhou, Zhang, Ying, Zhang, Wu and Zhu2006; Li et al. Reference Li, Li and Li2007; Windley et al. Reference Windley, Alexeiev, Xiao, Kröner and Badarch2007; Xu et al. Reference Xu, Pei, Wang, Meng, Ji, Yang and Wang2013). The NE-trending SGXR tectonic domain is characterized by widespread faulting and magmatism. This includes the Huanggang–Ganzhu’ermiao Fault, which hosts Late Mesozoic magmatism and related polymetallic deposits (Fig. 2a) (Zhao & Zhang, Reference Zhao and Zhang1997; Sheng & Fu, Reference Sheng and Fu1999; Ouyang et al. Reference Ouyang, Mao, Zhou and Su2015). The widespread Mesozoic granites include granodiorites, monzogranites, peralkaline granites and syenogranites, which can be separated into Jurassic and Cretaceous groups (Meng, Reference Meng2003; Xiao et al. Reference Xiao, Zhang and Zhao2004; Xu et al. Reference Xu, Charvet, Chen, Zhao and Shi2012). The Yanshanian magmatism changed from felsic to alkaline, and the degree of differentiation of the rocks increased from the early stage of magmatism to the late stage. Spatially, the southwestern part of the SGXR contains felsic intrusive rocks, while the northeastern part contains intermediate-felsic intrusive rocks. The Yanshanian magmatic activity is closely related to the formation of the Cu, Ag, Pb, Zn, W, Mo and Sn deposits (Zhang et al. Reference Zhang, Zhai, Shen, Liu, Yang, Zhai, Yao, Wang, Wang, Gao and Zhang2011).
The study area contains outcrops of Precambrian orthogneiss and paragneiss unconformably overlain by metamorphosed Palaeozoic volcanic and sedimentary rocks and Jurassic to Cretaceous intermediate to felsic volcanic rocks and sedimentary rocks (Fig. 2a; Rui et al. Reference Rui, Shi and Fang1994; Zhou et al. Reference Zhou, Mao and Lyckberg2012; Zhai et al. Reference Zhai, Liu and Zhang2014b). The Palaeozoic units in the region consist of the felsic volcanic rocks of the Middle Ordovician Duobaoshan Formation and the Early Permian Dashizhai Formation and the Upper Permian sedimentary rocks of the Linxi Formation. The Dashizhai Formation is a shallow submarine volcanic succession, which is composed of felsic and intermediate-mafic rocks in the Huanggang–Ganzhu’ermiao–Wulanhaote area.
The LA-ICP-MS U–Pb zircon ages of the volcanic rocks are similar to those of the plutonic rocks in the region (Ouyang et al. Reference Ouyang, Mao, Santosh, Wu, Hou and Wang2014). Zhang et al. (Reference Zhang, Gao, Ge, Wu, Yang, Wilde and Li2010a) proposed that the mafic to intermediate volcanic rocks (174–124 Ma) were derived from the continental lithospheric mantle and formed in an extensional intraplate setting based on their slightly enriched Sr and weakly depleted to slightly enriched Nd isotopic ratios. In contrast, the felsic volcanic rocks have been interpreted to have a mixed mantle and crustal magmatic source based on their wide variations in Ba and Sr and highly positive εNd(t) and εHf(t) values (Zhang et al. Reference Zhang, Gao, Ge, Wu, Yang, Wilde and Li2010a).
3. Wulanba granite
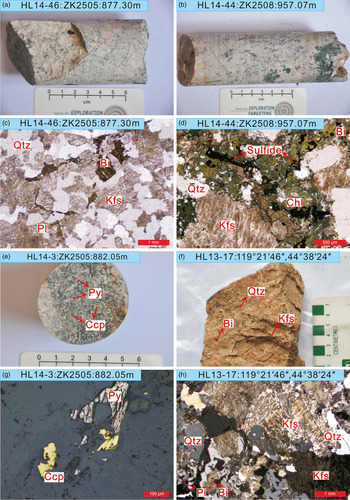
Two plutonic rock outcrops occur near the Haobugao Zn–Fe deposit: the ∼25 km2 Wulanba granite and the ∼30 km2 Wulanchulute granite. These granites intrude the Permian and Jurassic strata (Fig. 2b). The Wulanba granite, which consists of biotite monzogranites and syenogranites, was emplaced at 137–144 Ma, while the Wulanchulute granite, which is a granitic porphyry, was emplaced at 140–142 Ma (Li et al. Reference Li, Wang, Quan, Sun, Zhao and Zhang2016). The Haobugao Zn–Fe mineralization principally occurs in the skarn zones, which formed in the contact zone between the Wulanba granite and marine pyroclastic rocks and marble of the Lower Permian Dashizhai Formation (Fig. 2b, c) (Sheng & Fu, Reference Sheng and Fu1999; Liu et al. Reference Liu, Jiang, Bagas, Han, Chen and Kang2017). The biotite monzogranite of the Wulanba granite is pale red (Fig. 3a) and consists of perthitic K-feldspar (35–50 vol. %; 1.0–2.5 mm) with carlsbad twinning, plagioclase (20–30 vol. %, 0.2–2.0 mm) with polysynthetic twinning, quartz (15–35 vol. %; 0.5–2.0 mm), biotite (5–15 vol. %; 0.25–1.0 mm) with dark-brown pleochroism, and accessory magnetite, apatite, titanite and zircon (Fig. 3c). Based on photographs, the samples are also locally hydrothermally altered, including the partial alteration of K-feldspar to sericite, variable alteration of biotite to sericite-chlorite, and alteration of plagioclase to sericite (Fig. 3b, d). In drill core, the contact between the granite and the carbonate is difficult to pinpoint since it presents as a transitional zone containing chalcopyrite and pyrite (Fig. 3e, g). The medium- to coarse-grained syenogranite is rust brown, equigranular (Fig. 3f) and consists of K-feldspar (65–75 vol. %; 1.0–3.0 mm) with a perthitic texture and weak sericite alteration, plagioclase (5–10 vol. %; 1.0–5.0 mm) with polysynthetic twinning and slight sericitic alteration, quartz (20–30 vol. %; 0.5–1.0 mm), partially chloritized biotite (2–5 vol. %; 0.3 mm) (Fig. 3h), and accessory magnetite and apatite. Significant hydrothermal alteration and mineralization was also observed in the country rock, which mainly consists of slate. Several porphyritic monzogranite, diorite, monzonite porphyry and syenite porphyry dykes were observed in the Haobugao deposit area. These dykes often cut the skarns and orebodies.
Photographs and photomicrographs of (a) the biotite monzogranite, 877.30 m, drill core ZK2505 (sample HL14-46); (b) biotite monzogranite with sulfides and chlorite alteration (sample HL14-44); (c) biotite monzogranite containing K-feldspar, plagioclase, quartz and biotite (plane-polarized light); (d) sulfides and chlorite alteration in the biotite monzogranite (plane-polarized light); (e) pyrite and chalcopyrite mineralization in the biotite monzogranite (sample HL14-3); (f) the medium- to coarse-grained syenogranite (sample HL13-17); (g) pyrite and chalcopyrite mineralization in the biotite monzogranite (reflected light); and (h) syenogranite containing K-feldspar, plagioclase, quartz and partly chloritized biotite (cross-polarized light). Abbreviations of minerals: Qtz – quartz; Kfs – K-feldspar; Chl – chlorite; Pl – plagioclase; Bi – biotite; Py – pyrite; Ccp – chalcopyrite.

4. Samples and analytical methods
We collected biotite monzogranite samples from drill cores ZK2505 and ZK2508, syenogranite from the outcrops, dykes (porphyritic monzogranite and diorite) form tunnels, and sulfides from the drill cores and tunnels. The sample locations are shown in Figure 2b, c and are listed in online Supplementary Material Table S1.
4.a. LA-MC-ICP-MS zircon and apatite U–Pb dating
Six samples were collected from drill cores, outcrops and tunnels for laser-ablation multi-collector inductively coupled plasma mass spectrometry (LA-MC-ICP-MS) U–Pb zircon dating. The samples were crushed and sieved, and the heavy mineral fraction was separated using magnetic and heavy liquid separation methods to concentrate the zircon grains. The zircon grains were then handpicked, mounted in standard GJ-1 epoxy resin mounts and polished. Binocular microscope and cathodoluminescence (CL) images were obtained to study the morphology and internal structures of the zircons. Based on this information, grains were selected for U–Pb isotope analyses. The CL images were taken using a JEOL JXA-8900RL microprobe at the Chinese Academy of Geological Sciences (CAGS) in Beijing. All of the U–Pb isotope data were collected at the Institute of Mineral Resources at CAGS using an LA-MC-ICP-MS and a Thermo-Finnigan Neptune MC-ICP-MS connected to a New Wave 213 Nd–YAG laser-ablation system (Hou et al. Reference Hou, Li and Tian2009). Concordia plots were created and weighted means were calculated using the Isoplot/Ex-V3 Microsoft Excel macro (Ludwig, Reference Ludwig2003).
The apatite grains were separated using conventional heavy liquid and magnetic techniques. Then, they were handpicked under a binocular microscope, mounted in epoxy resin and polished down to expose the centres of the grains. CL images of the apatite grains and apatite U–Pb dating analyses of the biotite monzogranite (HL14-46) were obtained using LA-MC-ICP-MS at the Beijing Kehui Testing International Co. Ltd. The operating conditions for the laser-ablation system and the ICP-MS and the data reduction methods are described in detail by Hou et al. (Reference Hou, Li and Tian2009). Laser sampling was performed using an ESI NWR 193 nm laser-ablation system. An Analytik Jena PQMS Elite ICP-MS was used to acquire ion-signal intensities. The offline raw data selection, integration of the background and analyte signals, time-drift correction and quantitative calibration for the U–Pb dating was performed using ICPMSDataCal. Apatite NW-1 was used as an external standard for the U–Pb dating and was analysed twice for every five to ten analyses. The U, Th and Pb concentrations were calibrated using NIST 610. The concordia diagrams and weighted mean calculations were completed using Isoplot/Ex_ver3.
4.b. Major- and trace-element analyses
The whole-rock geochemical analyses were completed at the Analytical Centre of the Beijing Institute of Geology for Nuclear Industry (ACBIGNI). The major-element compositions were analysed using an X-ray fluorescence spectrometer (Philip PW2404) and the fused disc methods. The trace-element compositions were analysed using an ICP-MS (Finnigan MAT Element I) after acid digestion in Teflon bombs. The analytical precision and accuracy of the analyses were better than 5 % for the major elements and 10 % for the trace elements.
The apatite compositions were determined using EMPA at the Beijing Kehui Testing International Co. Ltd. The EMPA was performed with a fully automated JEOL JXA-8230 electron microprobe equipped with four wavelength dispersive spectrometers with a 15 kV excitation voltage, 10 nA beam current and a 10 µm beam diameter. The peak and background counting times were 20 s for F, S, Cl and Fe and 10 s for Na, Si, P and Ca. Fluorine was always measured in the first cycle because of migration during analysis.
4.c. Sr–Nd and lead isotope analyses
First, the sample powders were spiked with mixed isotopic tracers for the Sr and Nd isotopic analyses, and then they were placed in Savillex Teflon screw-cap beakers and dissolved in distilled HF + HNO3 at 100 °C for seven days. A conventional cation resin exchange technique was used for element separation. The isotopic analyses were carried out on a Finnigan MAT-262 thermal ionization mass spectrometer (TIMS) at the Beijing Institute of Nuclear Geological Research. The whole-rock Sr–Nd isotopic ratios were determined using an ISOPROBE-T at the ACBIGNI. The 147Sm/144Nd and 87Rb/86Sr ratios were calculated using the Sm, Nd, Rb and Sr concentrations measured using the ICP-MS. The measured 143Nd/144Nd and 87Sr/86Sr ratios were normalized to 146Nd/144Nd = 0.7219 and 86Sr/88Sr = 0.1194, respectively. The SHINESTU Nd standard and NBS-987 Sr standard were measured during the analyses, yielding a 143Nd/144Nd ratio of 0.512118 ± 3 (2σ) and a 87Sr/86Sr ratio of 0.710250 ± 7 (2σ).
The in situ apatite Sr–Nd isotopic analyses were conducted using an LA-MC-ICP-MS (New Wave 213 nm + Neptune plus) at the Beijing Kehui Testing International Co. Ltd. The isotopic data was obtained in low resolution static mode. During the experiment, the laser energy was ∼80 mJ and the energy density ∼5.2 J/cm2. A beam diameter of 80 µm and a frequency of 10 Hz were used for the laser denudation. Using the single point denudation mode, the denuded substances were extracted from the sample pool with high-purity He as the carrier gas, mixed with high-purity Ar and N2, and introduced into the mass spectrometer for isotopic analysis. The He flow rate was 0.7–0.9 L/min and the N2 flow rate was 4–7 ml/min. A 10 s blank was run prior to the laser denudation for Sr isotopic samples. The integration time of the Sr isotopic samples was 20 s and the integration time of the Nd isotopic samples was 30 s. The Sr isotopic data were corrected to 85Rb/87Rb = 2.593 to exclude the interference of 87Rb in the 87Sr values. Using the law of exponential fractionation, 88Sr/86Sr = 8.375209 was used as an internal standard to correct for the fractionation of 87Sr/86Sr. The Nd isotopic data was calibrated using 147Sm/149Sm = 1.0868 for the mass fractionation of Sm. 144Sm/149Sm = 0.22332 was used to account for the interference of 144Sm with 144Nd.
The sample powders for Pb isotopic analysis were dissolved in HF and HNO3 in Savillex Teflon screw-cap beakers placed on a hotplate for seven days at 100 °C. The Pb was separated and purified using the anion resin exchange technique with HBr as the eluant. The isotopic ratios were obtained using the Finnigan MAT-262 TIMS at the Beijing Institute of Nuclear Geological Research. Repeated analysis of standard NBS 981 yielded 204Pb/206Pb = 0.05897 ± 15, 207Pb/206Pb = 0.91445 ± 80 and 208Pb/206Pb = 2.16170 ± 180.
4.d. In situ zircon Hf isotopic analysis
In situ zircon Hf isotopic analysis was conducted using a Neptune MC-ICP-MS at the MLR Key Laboratory of Metallogeny and Mineral Assessment at the Institute of Mineral Resources, CAGS. The ICP-MS was connected to a New Wave UP213 UV laser-ablation system with He as the carrier gas and an erosion diameter of 55 L/m. The Hf isotopic analysis and U–Pb dating were conducted on the laser-ablation points (cf. Hou et al. Reference Hou, Li, Zhou, Qu, Shi and Xie2007). The weighted average value of 176Hf/177Hf for zircon international standard GJ1 was 0.282024 ± 0.000023 (2σ, n = 18), which is consistent with and within the error range of reported values (Elhlou et al. Reference Elhlou, Belousova, Griffin, Pearson and O’Reilly2006; Hou et al. Reference Hou, Li, Zhou, Qu, Shi and Xie2007).
5. Results
5.a. In situ U–Pb zircon and apatite geochronology
5.a.1. U–Pb zircon dating
The analysed spots and geochronological data for six samples are presented in online Supplementary Material Table S2. Figure 4 presents the zircon U–Pb concordia diagrams. All of the zircon grains were subhedral to euhedral and exhibited typical oscillatory growth zoning, which is consistent with a magmatic origin.
(a–f) Zircon and (g) apatite U–Pb concordia diagrams.

The Th/U ratios of the zircons from biotite monzogranite samples HL14-45 and HL14-46 were 0.26–0.65 and 0.23–1.11, respectively. Nineteen zircons from sample HL14-45 yielded a weighted mean 206Pb–238U age of 141 ± 1 Ma (MSWD = 1.2) (Fig. 4a, online Supplementary Material Table S2), and 22 zircons from sample HL14-46 yielded a weighted mean 206Pb–238U age of 140 ± 1 Ma (MSWD = 0.94) (Fig. 4b, online Supplementary Material Table S2). Within error, these two ages are the same and are taken to be the crystallization age of the biotite monzogranite.
Two syenogranite samples (HL13-16 and HL13-17) were selected for U–Pb zircon dating. The Th/U ratios of the zircons from samples HL13-16 and HL13-17 were 0.41–0.86 and 0.42–1.30, respectively. Nine zircons from sample HL13-16 yielded a weighted mean 206Pb–238U age of 142 ± 1 Ma (MSWD = 1.7) (Fig. 4c, online Supplementary Material Table S2), and 14 zircons from sample HL13-17 yielded a weighted mean 206Pb–238U age of 146 ± 1 Ma (MSWD = 1.3) (Fig. 4d, online Supplementary Material Table S2). These results indicate that the crystallization age of the syenogranite is ∼146–142 Ma.
The Th/U ratios of the zircons from the porphyritic monzogranite (sample HL13-12) were 0.37–0.76. Nineteen zircons yielded a weighted mean 206Pb–238U age of 129 ± 1 Ma (MSWD = 3.1) (Fig. 4e, online Supplementary Material Table S2), which was taken to be the crystallization age of the porphyritic monzogranite.
The Th/U ratios of the zircons from the diorite (sample HL863-2-6) were 0.32–0.60. Nineteen zircons yielded a weighted mean 206Pb–238U age of 135 ± 1 Ma (MSWD = 0.6) (Fig. 4f, online Supplementary Material Table S2), which was taken to be the crystallization age for the diorite.
5.a.2. U–Pb apatite dating
The apatite grains from the biotite monzogranite (sample HL14-46) were dated using the U–Pb method. The separated apatite grains were colourless and predominantly long, prismatic, euhedral crystals or fragments of euhedral crystals (0.02–0.20 mm). Some of the CL images showed obvious zoning (Fig. 6). The LA-ICP-MS U–Pb analytical data for the apatites are presented in online Supplementary Material Table S3, and the concordia and weighted average 207Pb corrected age plots are shown in Figure 4g. All of the U–Pb ages were calculated at a 95 % confidence level. These apatite grains yielded a weighted average 207Pb-corrected age of 138.2 ± 7.3 Ma (MSWD = 3.1, n = 17). Within error, this is the same age as that determined from the zircons and is taken to be the crystallization age of the biotite monzogranite.
Cathodoluminescence images of representative apatite grains from the Wulanba granite. Red numbers represent logfO2 values.

5.b. Major- and trace-element compositions
5.b.1. Whole-rock major- and trace-element compositions
The major- and trace-element compositions of seven whole-rock samples are presented in Table 1. The results were normalized to 100 % after accounting for loss on ignition (LOI). The biotite monzogranite and the syenogranite had similar geochemical compositions (Table 1). They are characterized by high SiO2 contents (71.37–75.47 wt %), low Al2O3 contents (11.55–14.89 wt %) and significantly lower MgO contents (0.03–0.67 wt %). Their Na2O contents ranged from 2.92 to 3.95 wt %, and their K2O contents ranged from 4.46 to 6.15 wt %. The SiO2 content of sample HL14-45 (67.36 wt %) was lower than those of the other Wulanba granite samples, but it had higher Al2O3 (14.89 wt %), MgO (0.67 wt %), Na2O (3.95 wt %) and K2O (5.81 wt %) contents, indicating that it may have been slightly hydrothermally altered. These granite samples are slightly peraluminous high-K–shoshonites with A/CNK values of 0.87–1.06 (<1.1). The chemical index of alteration (CIA = (Al2O3/(Al2O3 + CaO* + Na2O + K2O))*100) estimates the extent of weathering and alteration (Nesbitt & Young, Reference Nesbitt and Young1982). Fresh basalt has a CIA value of 30–45, whereas fresh monzogranite and granodiorite have higher values ranging from 45 to 55 (Nesbitt & Young, Reference Nesbitt and Young1982). The CIA values of all of our samples ranged from 54 to 61 (Table 1), indicating that the majority of the samples are only slightly altered. Therefore, alteration has not affected the geochemical data.
Major- and trace-element compositions of the Wulanba granite

The total rare earth element (ΣREE) values ranged from 99.84 ppm to 309.05 ppm, and the chondrite-normalized REE patterns of all of the samples are slightly right-inclined with moderately fractionated light REEs (LREEs) and heavy REEs (HREEs) (Fig. 5a; Table 1) and Eu/Eu* values of 0.02–0.31. The Wulanba granite has LREE/HREE values ranging from 2.41 to 5.55 (except for a value of 10.99 for sample HL14-46), and LaN/YbN values ranging from 1.25 to 5.29 (except for a value of 12.33 for sample HL14-46). All of the samples have similar primitive mantle-normalized trace-element patterns with depletions in the high field strength elements (HFSEs), i.e. Ba, Nb, Sr, P and Ti, and enrichments in the large ion lithophile elements (LILEs), i.e. Rb, K, Th, U, La, Ce and Nd (Fig. 5b; Table 1). The Rb content (174–335 ppm) was higher than the continental crustal value of 32 ppm (Taylor & McLennan, Reference Taylor and McLennan1985), indicating that these samples are highly differentiated. In addition, the calculated zircon saturation temperatures (TZr) of the biotite monzogranites and syenogranites ranged from 711 °C to 851 °C and from 756 °C to 763 °C, respectively (Watson & Harrison, Reference Watson and Harrison1983).
Trace-element plots for the Wulanba granite and apatite. (a) Chondrite-normalized REE patterns (after Taylor & McLennan, Reference Taylor and McLennan1985); and (b) primitive mantle-normalized spider diagrams (after Sun & McDonough, Reference Sun, McDonough, Saunders and Norry1989).

5.b.2. Major- and trace-element compositions of apatite
The CL images of the apatite revealed oscillatory zoning, indicating that these grains have not experienced significant alteration (Fig. 6). The apatite in the biotite monzogranite and the syenogranite occurred as euhedral–subhedral crystals. Table 2 lists the major-element compositions of the apatite grains from the Wulanba granite. The P2O5 content of the apatite showed little variation with increasing whole-rock SiO2 content (Fig. 7a), whereas the Na2O and MnO contents of the apatite from the biotite monzogranite were higher than those of the apatite from the syenogranite (Fig. 7b, c). The apatite samples had CaO contents ranging from 53.24 to 56.06 wt %, FeO contents ranging from 0 to 0.14 wt %, and SO3 contents ranging from 0 to 0.04 wt %. The Al2O3, MgO, K2O, TiO2, Cr2O3, NiO and chlorine contents were extremely low. However, all of the apatite grains analysed had high fluorine contents (2.79–3.76 wt %; Table 2), classifying them as fluorapatite. On a plot of MnO versus SiO2, all of the apatite grains plotted in the magmatic field (Fig. 7d), indicating that the composition of these apatite grains reflects the characteristics of the parent magma.
EMPA major-element compositions of apatite grains from the Wulanba granite

(a–c) Correlation between the major-element compositions of the apatite and the whole-rock SiO2 contents; (d) plot of MnO versus SiO2, the magmatic and hydrothermal apatite fields are from Chen et al. (Reference Chen, Yan, Wang and Wang2017); (e) plot of U versus Th for apatite; and (f) plot of Hf versus Zr for apatite.

Online Supplementary Material Table S4 lists the trace-element compositions of the apatite from the Wulanba granite. Similar to the Wulanba granite, the apatite REE patterns exhibit a slight LREE enrichment with LREE/HREE values ranging from 0.65 to 9.68 and distinctly negative Eu anomalies (δEu = 0.01–0.79) and positive cerium anomalies δCe (0.36–1.69). However, they have significantly higher REE concentrations (2527–17667 ppm) than the Wulanba granite (online Supplementary Material Table S4; Fig. 5a). However, nine apatite grains from sample HL13-16 had ∑REE (34–413 ppm) values similar to those of the granite (Fig. 5a). The relatively low thorium and uranium contents of these nine apatite grains may have been influenced by interaction with later hydrothermal fluids (Fig. 7e). The zirconium and hafnium contents of the apatite from the biotite monzogranite were lower than those of the syenogranite, which also suggests magmatic differentiation (Fig. 7f).
5.c. Sr–Nd–Pb–Hf isotopes
5.c.1. Sr–Nd–Hf isotopes of the whole rock and apatite
The Sr–Nd isotopic compositions of the Wulanba granite and the apatite from it are summarized in online Supplementary Material Table S5. The initial Sr isotope ratios (ISr) and ϵNd(t) values of the apatite were calculated using the U–Pb apatite age of the biotite monzogranite (138 Ma) and the U–Pb zircon age of the syenogranite (142 Ma). The 87Rb/86Sr and 87Sr/86Sr ratios of the apatite were very low because of their low Sr contents, so only two usable results were obtained. However, the 147Sm/144Nd and 143Nd/144Nd ratios obtained were quite good owing to the high Nd contents of the apatite (9–4254 ppm). The calculated ISr values ranged from 0.70184 to 0.70703 (except for one anomalous value of 0.69888 obtained for sample HL13-17). The εNd(t) values ranged from −0.2 to 4.8, and the two-stage depleted mantle Nd model ages (T2DM) ranged from 540 to 950 Ma (online Supplementary Material Table S5).
Four samples were chosen for in situ zircon Hf isotopic analysis (online Supplementary Material Table S6). Most of the 176Lu/177Hf values of the zircon grains were less than 0.002, indicating little radiogenic Hf accumulation after zircon formation. All of the samples had similar Hf isotopic compositions. The 176Lu/177Hf values reflect the Hf isotope compositions of the system during zircon formation (Amelin et al. Reference Amelin, Lee, Halliday and Pidgeon1999). The 176Hf/177Hf ratios of the biotite monzogranite (t = 141 Ma for sample HL14-45 and t = 140 Ma for sample HL14-46) ranged from 0.282848 to 0.282998, with εHf(t) values of 5.6–10.7. The single-stage Hf model ages (TDM1) ranged from 583 to 394 Ma, and the two-stage Hf model ages (tDM2) ranged from 834 to 509 Ma (Fig. 8a, b). The 176Hf/177Hf ratios of the syenogranite ranged from 0.282857 to 0.283095 (t = 142 Ma for sample HL13-16, and t = 146 Ma for sample HL13-17), the εHf(t) values from 5.9 to 14.3 (Fig. 8c), the TDM1 from 576 to 238 Ma, and the tDM2 from 814 to 494 Ma (Fig. 8d).
Histograms of the εHf(t) and tDM2 values of (a, b) the biotite monzogranite; and (c, d) the syenogranite.

5.c.2. Lead isotopes
The Wulanba granite and the sulfides from the Haobugao Zn–Fe deposit had relatively similar whole-rock Pb isotope compositions with (206Pb/204Pb)i values of 18.179–18.739 and 18.026–18.408, (207Pb/204Pb)i values of 15.509–15.547 and 15.499–15.687, and (208Pb/204Pb)i values of 38.021–38.119 and 37.986–38.615, respectively (online Supplementary Material Table S7).
6. Discussion
6.a. Petrogenesis
6.a.1. Source of the Wulanba granite
Most Phanerozoic granites in the CAOB are characterized by low initial Sr isotope ratios (<0.707), positive εNd(t) values and young Sm–Nd model ages (TDM) of 1200–300 Ma, indicating their ‘juvenile’ character and suggesting derivation from source rocks or magma from the upper mantle (Kovalenko et al. Reference Kovalenko, Yarmolyuk, Kovach, Kotov, Kozakov and Sal’nikova1996; Hong et al. Reference Hong, Wang, Xie and Zhang2000; Jahn et al. Reference Jahn, Wu and Chen2000b, Reference Jahn, Wu, Capdevila, Fourcade, Wang and Zhao2001; Wu et al. Reference Wu, Jahn, Wilde, Lo, Yui, Lin, Ge and Sun2003; Liu et al. Reference Liu, Siebel, Li and Pan2005, Reference Liu, Pan, Xie and Li2007; Shao et al. Reference Shao, Mu, Zhu and Zhang2010). These characteristics are shared by the Wulanba granite. The syenogranite and the biotite monzogranite were emplaced at 146–142 Ma and 141–140 Ma, respectively, and the cross-cutting diorite and porphyritic monzogranite dykes were emplaced at 134 Ma and 129 Ma, respectively. A high Rb/Sr ratio and low Sr content (<20 ppm) due to fractional crystallization can lead to a significant analytical uncertainty in the initial Sr isotopic composition. This is supported by the low value of 0.69888 for sample HL13-17, which should be >0.7 (Chappell et al. Reference Chappell, Bryant, Wyborn, White and Williams1998; Wu et al. Reference Wu, Jahn, Wilde and Sun2000; Jahn et al. Reference Jahn, Wu, Capdevila, Fourcade, Wang and Zhao2001). The other (87Sr/86Sr)i values of the Wulanba granite and the apatite from it vary from 0.70184 to 0.70703. The Wulanba granite and the apatite from it have εNd(t) values (−0.2 to 4.8) similar to those of the Early Cretaceous granitic rocks related to the mineralization in the SGXR ((87Sr/86Sr)i = 0.70211–0.70945, (εNd(t) = −2.00–2.88), which have a juvenile crustal source (Han et al. Reference Han, Wang, Jahn, Hong, Kagami and Sun1997; Chen et al. Reference Chen, Jahn, Simon and Xu2000; Heinhost et al. Reference Heinhost, Lehmann, Ermolov, Serykh and Zhurutin2000; Wu et al. Reference Wu, Jahn, Wilde and Sun2000, Reference Wu, Sun, Li, Jahn and Wilde2002). Generally, granitic rocks with positive εHf(t) values are interpreted to represent partial melting of either the depleted mantle or a juvenile crustal source derived from the depleted mantle (Zhou et al. Reference Zhou, Mao and Lyckberg2012). On the plot of εHf(t) versus T, all of the samples from the study area with high zircon εHf(t) values of 5.6–14.3 plot between the DM (depleted mantle) and CHUR (chondritic uniform reservoir) fields, similar to the Early Cretaceous granites in the SGXR (−0.80 to 14.20), which have been interpreted to have a juvenile crustal source derived from the depleted mantle (Fig. 9) (Guo et al. Reference Guo, Fan, Li, Gao and Miao2009; J. F. Liu, unpub. Ph.D. thesis, Univ. Jilin, 2009; Zhang et al. Reference Zhang, Zhang, Jin, Wu, Xiang and Chen2010b; Wu et al. Reference Wu, Zhang, Wan, Chen, Zhang and Xiang2011b; Zhou et al. Reference Zhou, Ge and Wang2011, Reference Zhou, Mao and Lyckberg2012; Shu et al. Reference Shu, Lai, Wang, Xu and Sun2013b; Ouyang et al. Reference Ouyang, Mao, Zhou and Su2015). The depleted mantle model age represents the time at which the parental magma was derived from a source that had been separated from the depleted mantle; while the depleted mantle Nd (T2DM) and Hf (tDM2) model ages are used to estimate the ages of their protoliths. The Wulanba granite has young Nd model ages (T2DM) of 950–540 Ma and Hf model (tDM2) ages of 834 and 494 Ma. Most of the Nd model ages (T2DM) overlap with the range of the Hf model ages, indicating that they were derived from the Late Neoproterozoic to Early Palaeozoic juvenile crust (Wu et al. Reference Wu, Sun and Lin1999; Li et al. Reference Li, Zhou, Brouwer, Xiao, Wijbrans and Zhong2014b). The young T2DM and tDM2 ages suggest that the SGXR experienced crustal growth during Neoproterozoic to Early Palaeozoic times (Hong et al. Reference Hong, Wang, Xie and Zhang2000; Cai et al. Reference Cai, Yan, Xiao, Wang, Mu and Zhang2004).
Initial ϵHf isotopic values versus the U–Pb ages of the zircon grains from the Wulanba granite. Data for the Early Cretaceous igneous rocks and Middle to Late Jurassic granites are from Ouyang et al. (Reference Ouyang, Mao, Zhou and Su2015 and references therein). Abbreviations: DM – depleted mantle; CHUR – chondritic uniform reservoir.

The large range in εHf(t) values along with the T2DM and tDM2 ages suggests that the protolith of the Wulanba granite is complex. The lower εNd(t) values of the Cretaceous igneous rocks in this region are due to the involvement of crustal rocks (Jahn et al. Reference Jahn, Capdevila, Liu, Vernon and Badarch2004). The proportion of mantle material involved in the petrogenesis of the Early Cretaceous igneous rocks was estimated by Jahn et al. (Reference Jahn, Wu and Chen2000a) to be 62–92 %. According to the method proposed by Wu et al. (Reference Wu, Sun, Li, Jahn and Wilde2002), the proportion of juvenile lower crust involved in the petrogenesis of the Wulanba granite is ∼60–80 %. We speculate that the source rocks may have originated from partial melting of juvenile crust (∼60–80 %) derived from the depleted mantle with a minor input of older crust (Cai et al. Reference Cai, Yan, Xiao, Wang, Mu and Zhang2004; Shao et al. Reference Shao, Mu, Zhu and Zhang2010).
6.a.2. Petrogenesis of the Wulanba granite
Intermediate-acid magmas cannot be derived directly from partial melting of the mantle (Green, Reference Green1980; Defant & Drummond, Reference Defant and Drummond1990; Martin, Reference Martin1999). Theoretically, granitoids can form from magma mixing, assimilation–fractional crystallization (AFC) or melting of the lower crust (Liu et al. Reference Liu, Pan, Xie and Li2007). The Wulanba granite did not experience significant magma mixing based on the absence of microgranular mafic enclaves (MMEs) (Poli & Tommasini, Reference Poli and Tommasini1991; Tepley et al. Reference Tepley, Davidson, Tilling and Arth2000). The presence of oscillatory zoned magmatic zircon grains and the Th/U zircon values (>0.1) (Zhou et al. Reference Zhou, Lü, Yang and Li2010) indicate that the zircon grains were not inherited as a result of contamination by the surrounding host rocks. Lin et al. (Reference Lin, Ge, Wu, Sun and Cao2004) argued that the source of the low-Sr Mesozoic granites in the GXR was composed of young crustal material that originated in the mantle during Phanerozoic crustal growth. Moreover, the chemical compositions of the Late Mesozoic granitic rocks in the SGXR are similar to those of experimental melts derived from basaltic rocks (Ellis & Thompson, Reference Ellis and Thompson1986; Sisson et al. Reference Sisson, Ratajeski and Hankins2005). Chen & Fu (Reference Chen and Fu1992) and Chen et al. (Reference Chen, Pirajno and Qi2005) summarized the three models for the formation of granitic magmas from partial melting of a thickened lower crust. (1) During the main period of continental orogeny, lower crustal thickening caused by the collision of continental plates and the heat generated by tectonic shearing could induce partial melting of the lower crust. (2) After the main orogenic event, tectonic decompression results in dehydration reactions involving hydrous minerals and induced partial melting of the crust. (3) After the main orogenic period, lithospheric delamination leads to mantle upwelling and underplating, causing partial melting of the lower crust. The Mesozoic mafic–ultramafic cumulate xenoliths and mafic granulite xenoliths in the GXR have been concluded to be the product of upwelling and asthenospheric underplating (Shao et al. Reference Shao, Han, Zhang and Mu1999, Reference Shao, Liu, Chen and Han2001).
Liu et al. (Reference Liu, Zhou, Zhang, Yuan, Liu, Zhao, Sun and White2018) classified the Wulanba granite as an A-type granite based on enrichments in Zr, Y and Ga and the plot of Zr versus 1000 Ga/Al. However, it is difficult to distinguish highly differentiated granites from A-type granites. Aluminous A-type granites contain mafic minerals such as annite and/or amphibole, whereas peralkaline A-type granites contain alkali mafic minerals such as arfvedsonite, riebeckite and sodium pyroxene (Wu et al. Reference Wu, Sun, Li, Jahn and Wilde2002). A-type granites have unique geochemical characteristics, including significant enrichments in alkalis and Ga, Zr, Nb, Y and REEs and high Ga/Al ratios (Whalen et al. Reference Whalen, Currie and Chappell1987; Bonin, Reference Bonin2007). However, alkaline Fe–Mg minerals have not been observed in the Wulanba granite. In addition, the geochemical characteristics of the Wulanba granite differ from those of A-type granites. First, the average FeOT/MgO ratio of the Wulanba granite ranges from 5.28 to 6.98 (except for a value of 27.87 obtained for sample HL14-44 due to its ultra-low MgO content), which is lower than that of A-type granites (FeOT/MgO >10) (Whalen et al. Reference Whalen, Currie and Chappell1987). Second, its average Zr + Ce + Nb + Y content is 335 ppm, which is lower than that of A-type granites (350 ppm). Its average Zr content is 184 ppm (except for a value of 365 ppm obtained for sample HL14-45), which is lower than that of A-type granites (250 ppm). Third, the Ga content is very low (average 23.1 ppm), and the 104*Ga/Al ratio varies from 2.84 to 3.81 with an average of 3.42, which is lower than the average value of A-type granites (3.75) suggested by Whalen et al. (Reference Whalen, Currie and Chappell1987). Most of the samples plot in the highly differentiated granite field (Fig. 10a, b). However, when their FeOT/MgO ratios are greater than 16, the Zr + Ce + Nb + Y contents and the Ga/Al ratios of differentiated A-type granites can be lower (Bonin, Reference Bonin2007). The low K/Rb and Zr/Hf ratios of these granites indicate magmatic differentiation (Halliday et. al. Reference Halliday, Davidson, Hildreth and Holden1991; Claiborne et al. Reference Claiborne, Miller, Walker, Wooden, Mazdab and Bea2006; Ballouard et al. Reference Ballouard, Poujol, Boulvais, Branquet, Tartèse and Vigneresse2016). The Wulanba granite has significant negative Eu anomalies (δEu = 0.02 – 0.31), high K/Ba ratios (56–567), low Zr/Hf ratios (17–29) and Nb/Ta ratios (7–12) (common range for granitic rocks is 15–40 for K/Ba, 35–40 for Zr/Hf and 17–18 for Nb/Ta; Irber, Reference Irber1999), and depletions in Ba, Sr, P and Ti on the spider diagram, indicating that they are the products of high amounts of differentiation (Miller & Mittlefehldt, Reference Miller and Mittlefehldt1982, Reference Miller and Mittlefehldt1984; Jahn et al. Reference Jahn, Wu, Capdevila, Fourcade, Wang and Zhao2001; Gelman et al. Reference Gelman, Deering, Bachmann, Huber and Gutiérrez2014). In addition, their high differentiation index (DI) values of 86.79−96.20 are indicative of highly differentiated granites. The Wulanba granite is weakly peraluminous (A/CNK = 0.87–1.06 <1.1) and there is no dolomite, cordierite or garnet in the granite, which is not characteristic of S-type granites with strong peraluminous characteristics. The P2O5 content of the Wulanba granite is less than 0.1 wt %, which differs from that of S-type granites (>0.2 wt %) (Chappell, Reference Chappell1999). In addition, the samples also fall into the I-type granite field on the plot of TiO2 versus Zr (Fig. 10c). In fact, the Wulanba granite has high SiO2 and Na2O + K2O contents, low Ti, Mn and P contents, and high Rb/Sr and Nb/Ta ratios. In addition, it is significantly enriched in Rb, Th and U and depleted in Ba, Sr and Eu. These characteristics are also consistent with those of highly differentiated I-type granites (Chappell, Reference Chappell1999; Wu et al. Reference Wu, Jahn, Wilde, Lo, Yui, Lin, Ge and Sun2003; Li et al. Reference Li, Li and Li2007; Zhu et al. Reference Zhu, Lai, Qin and Zhao2015). Therefore, we conclude that the Wulanba granite is a highly differentiated I-type granite.
(a) 104*Ga/Al versus (Zr + Nb + Ce + Y) discrimination diagram; (b) (Na2O + K2O)/CaO versus (Zr + Nb + Ce + Y) discrimination diagram; and (c) TiO2 versus Zr discrimination diagram. A – A-type granite; FG – fractionated I-, S- and M-type granites; OGT – unfractionated I-, S- and M-type granites. The base diagrams for figures (a) and (b) are from Whalen et al. (Reference Whalen, Currie and Chappell1987).

The degree of magmatic differentiation of the apatite is exhibited by the (La/Sm)N and (Eu/Eu*)N values. The apatite grains exhibit very slight LREE enrichment. Previous experiments have shown that the apatite/melt partition coefficients of the middle REEs are higher than those of the LREEs and HREEs (Watson & Green, Reference Watson and Green1981; Fujimaki, Reference Fujimaki1986), which causes the (La/Sm)N values of the apatite grains (0.54–2.81) to be lower than those of the melt (0.78–5.09). Crystallization of plagioclase depletes the Eu value of the magma, resulting in the low Eu content of the apatite, which crystallizes later. Therefore, the significantly negative Eu anomalies of the apatite were most likely caused by the crystallization of plagioclase before the apatite crystallized.
6.b. Constraints on Zn–Fe mineralization
6.b.1. Ore-related rocks
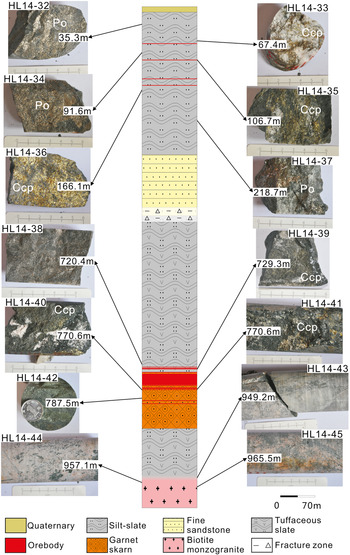
The evolution of northeastern China was controlled by the closure of the Palaeo-Asian Ocean at ∼250 Ma, which was characterized by crustal accretion and the amalgamation of micro-blocks and terranes in Palaeozoic time and possibly extension until Early–Middle Triassic times (Jahn, Reference Jahn, Malpas, Fletcher, Ali and Aitchison2004; Windley et al. Reference Windley, Alexeiev, Xiao, Kröner and Badarch2007; Xiao et al. Reference Xiao, Windley, Huang, Han, Yuan, Chen, Sun, Sun and Li2009; Jiang et al. Reference Jiang, Nie, Liu, Hou, Bai, Liu and Liang2011b; Wu et al. Reference Wu, Zhang, Wan, Chen, Zhang and Xiang2011b; Han et al. Reference Han, Liu, Neubauer, Johann, Zhao, Wen, Li, Wu, Jiang and Zhao2012; Li et al. Reference Li, Zhou, Brouwer, Xiao, Wijbrans and Zhong2014a,b). In Late Jurassic to Early Cretaceous times, the subduction of the Palaeo-Pacific Plate and the closure of the Mongol–Okhotsk Ocean caused lithosphere delamination and asthenosphere upwelling (Ouyang et al. Reference Ouyang, Mao, Zhou and Su2015; Jiang et al. Reference Jiang, Zhang, Liu, Liu, Kang and Wang2018). As a result, strong crust–mantle interaction occurred and N–S-striking sinistral shear zones developed, e.g. the NE-striking Huanggang–Ganzhu’ermiao Fault, which played a significant role in controlling the magmatism and mineralization in the SGXR. Therefore, a series of mineralization, granite emplacement, exhumation of metamorphic core complexes and large-scale lithosphere destruction occurred during Early Cretaceous time, indicating an extensional setting (140–120 Ma) (Gao et al. Reference Gao, Rudnick, Carlson, McDonough and Liu2002; Wu et al. Reference Wu, Sun, Li, Jahn and Wilde2002, Reference Wu, Lin, Wilde, Zhang and Yang2005; Mao et al. Reference Mao, Xie, Zhang, Li, Wang, Zhang and Li2005, Reference Mao, Xie, Bierlein, Qu, Du, Ye, Pirajno, Li, Guo, Lie and Yang2008, Reference Mao, Xie, Pirajno, Ye, Wang, Li, Xiang and Zhao2010; Wang et al. Reference Wang, Zhou, Zhang, Ying, Zhang, Wu and Zhu2006; Zhang et al. Reference Zhang, Gao, Ge, Wu, Yang, Wilde and Li2010a; Zhu et al. Reference Zhu, Chen, Wu and Liu2011; Li et al. Reference Li, Bi, Selby, Chen, Vasconcelos, Thiede, Zhou, Zhao, Li and Qiu2012). As a skarn deposit, the typical lithological succession observed in drill core ZK2508 near the Haobugao deposit (Fig. 11) includes biotite monzogranite, followed by a mineralized garnet skarn, mineralized tuff and mineralized slate from bottom to top. Silicification, chlorinification and carbonation of the various units was also observed. In addition, sulfides such as chalcopyrite and pyrite were observed in the biotite monzogranite (Fig. 3e, g). These geological characteristics undoubtedly prove that the biotite monzogranite contributed to mineralization. The U–Pb zircon ages of the biotite monzogranite (141–140 Ma) are consistent with the timing of the Haobugao Zn–Fe mineralization (142 Ma) (Liu et al. Reference Liu, Jiang, Bagas, Han, Chen and Kang2017), suggesting a genetic relationship between the Zn–Fe mineralization and the emplacement of the biotite monzogranite. Spatially, along the Huanggang–Ganzhu’ermiao Fault (HGF; Fig. 2a), the ages of the granites in the area around the Haobugao Zn–Fe deposit (in the northeastern HGF area), the Hashitu molybdenum deposit (in the central HGF area) and the Huanggangliang Sn–Fe deposit (in the southwestern HGF area) are 146–140 Ma, 147–143 Ma (Zhai et al. Reference Zhai, Liu, Wang, Yang, Zhang, Wang, Zhang, Wang and Liu2014a) and 139 Ma (Zhou et al. Reference Zhou, Mao and Lyckberg2012), respectively. The magmatism in the SGXR (Wang et al. Reference Wang, Zhou, Zhang, Ying, Zhang, Wu and Zhu2006; Zhang et al. Reference Zhang, Ge, Wu, Wilde, Yang and Liu2008a,b, Reference Zhang, Zhang, Jin, Wu, Xiang and Chen2010b) and the associated porphyry- and skarn-type deposits (132–139 Ma) (Zeng et al. Reference Zeng, Liu and Zhang2010, Reference Zeng, Liu, Yu, Ye and Liu2011; Shu et al. Reference Shu, Lai, Sun, Wang and Meng2013a; W. Mei, unpub. Ph.D. thesis, China Univ. Geosciences, 2014; Zhai et al. Reference Zhai, Liu and Zhang2014b) and hydrothermal vein-type deposits (135–143 Ma) (Liu et al. Reference Liu, Jiang and Zhang2010; Ouyang et al. Reference Ouyang, Mao, Santosh, Zhou, Zhou, Wu and Hou2013; Ruan et al. Reference Ruan, Lv, Yang, Liu, Yu, Wu and Munir2015) defined a widespread magmatic-metallogenic event created in Early Cretaceous time (∼140 Ma).
Samples from drill core ZK2508 (∼1000 m) containing biotite monzogranite → mineralized garnet skarn → mineralized tuffaceous slate → mineralized slate from deep to shallow, demonstrating that the biotite granite is the ore-related intrusion.

The lead isotope compositions of the samples from the study area vary within a narrow range. The majority of the sulfides plot between the mantle evolution line and the orogenic evolution line, while only a small number of samples plot between the mantle and upper crust evolution lines (Fig. 12) (Zartman & Doe, Reference Zartman and Doe1981; Canals & Cardellach, Reference Canals and Cardellach1997; Hou et al. Reference Hou, Ding and Jiang2004; Jiang et al. Reference Jiang, Yang, Li, Zhao and Ling2006). The similar Pb isotope compositions of the sulfides from the Haobugao deposit and those of other deposits in the SGXR indicate that they have similar lead sources (Ouyang et al. Reference Ouyang, Mao, Zhou and Su2015). Furthermore, most of the samples plot within the field of the Mesozoic granitic rocks in the SGXR. The sulfides from the Haobugao deposit are more similar to those from the biotite monzogranite than those from the syenogranites (Fig. 12). In addition, the FeOT (wt %), Cu (ppm) and Zn (ppm) contents of the sulfides in the biotite monzogranite (1.79–3.99, 5.97–185 and 75.4–366, respectively) are much higher than those in syenogranite (0.82–0.92, 2.41–2.63 and 36.38–37.86, respectively), suggesting that the biotite monzogranite can supply more ore-forming elements (Fe–Zn–Pb–Cu) than the syenogranite.
Lead isotope compositions of the Wulanba granite and sulfides (base map modified after Ouyang et al. Reference Ouyang, Mao, Zhou and Su2015). Data for the mantle, orogen, and lower and upper crust evolution curves are from Zartman & Doe (Reference Zartman and Doe1981), data for the Mesozoic intrusive rocks in the SGXR are from Zhao & Zhang (Reference Zhao and Zhang1997), Chu et al. (Reference Chu, Huo and Zhang2001), Xiao et al. (Reference Xiao, Zhang and Zhao2004), Zhu et al. (Reference Zhu, Zhang, He, Zhu and Huang2006), Guo et al. (Reference Guo, Fan, Gao, Li, Miao, Zhao and Li2010) and Jiang et al. (Reference Zhou, Lü, Yang and Li2010), and data for the sulfide minerals in the SGXR are from Ouyang et al. (Reference Ouyang, Mao, Zhou and Su2015 and references therein).

6.b.2. Apatite compositional constraints on the fertile and barren rocks in the Wulanba granite
The presence of redox-sensitive elements such as Mn, As, Fe, S, Eu and Ce in various oxidation states in the apatite may be related to the redox conditions of the host magma (Sha & Chappell, Reference Sha and Chappell1999; Prowatke & Klemme, Reference Prowatke and Klemme2006; Konecke et al. Reference Konecke, Fiege, Simon, Parat and Stechern2017). As the available As, Fe, Ce and Eu data were limited, the Mn content of the apatite was used to evaluate the oxygen fugacity of the magma. Because apatite crystallizes prior to other Mn-bearing minerals, the crystallization of other Mn-bearing minerals would not significantly influence Mn partitioning between the apatite and the melt (Xie et al. Reference Xie, Tang, Chen and Lang2018). Apatite has an elevated Mn content at low oxygen fugacities at which manganese primarily exists as Mn2+ (Zhong et al. Reference Zhong, Feng, Seltmann, Li and Dai2018). Miles et al. (Reference Miles, Graham, Hawkesworth, Gillespie, Hinton and Bromiley2014) explored the use of the Mn concentration of apatite, which varies linearly and negatively with logfO2 (logfO2 = −0.0022(±0.0003)Mn (ppm) − 9.75(±0.46)), as an oxybarometer in intermediate and felsic igneous rocks. On the plot of logfO2 versus T (Fig. 13a), the apatite grains from the biotite monzogranite and syenogranite plot between the magnetite–haematite (MH) and NiNiO (NNO) buffers, indicating the apatite crystallized from a melt with a high oxygen fugacity. This is also supported by the negative Ce anomalies of the magnetite, which indicates an oxidized ore-fluid (Liu et al. Reference Liu, Jiang, Bagas, Han, Chen and Kang2017). The calculated logfO2 values of the syenogranite range from −10.9 to −14.4, while those of the biotite monzogranite range from −9.8 to −11.9 (Figs 6, 13b) (Miles et al. Reference Miles, Graham, Hawkesworth, Gillespie, Hinton and Bromiley2014). This indicates that compared to the barren syenogranite, the fertile biotite monzogranite is more oxidized. From the centre to the edge of the apatite grains from the biotite monzogranite (Fig. 6), the logfO2 values increase, indicating that the oxygen fugacity of the magma increased during apatite crystallization. It is generally agreed that compared to reduced magmas, oxidized magmas facilitate skarn mineralization (Li et al. Reference Li, Chi, Zhou, Deng and Zha2017), because at higher oxygen fugacities, magmatic sulfur exists mainly as sulfate (SO42−), which is more soluble in silicate melts than sulfide and tends to delay or even prevent the saturation of magmatic sulfide phases (Ballard et al. Reference Ballard, Palin and Campbell2002; Richards, Reference Richards2003). Zhong et al. (Reference Zhong, Feng, Seltmann, Li and Dai2018) also concluded that in the Weibao Cu–Pb–Zn skarn deposit, the ore-bearing intrusions are significantly more oxidized than the barren diorite porphyry. These results suggest that oxygen fugacity can potentially be used to differentiate between fertile and barren rocks.
(a) Plot of logfO2 versus T (°C) for the Wulanba granite. In this study, the logfO2 values were calculated using the method of Miles et al. (Reference Miles, Graham, Hawkesworth, Gillespie, Hinton and Bromiley2014) and the temperature is the TZr. The oxygen fugacity buffer data are from Eugster & Wones (Reference Eugster and Wones1962). MH – magnetite–haematite buffer; NNO – NiNiO; FMQ – fayalite–magnetite–quartz buffer; WM – wustite–magnetite; IW – iron–wustite buffer; IQF – iron–quartz–fayalite. (b) Plot of whole-rock SiO2 (wt %) versus logfO2; (c) F/Cl of the magma versus whole-rock SiO2 (wt %); and (d) plot of F (wt %) versus Cl (wt %) for the apatite. The data for the skarn Cu–Zn–Pb deposits and porphyry Cu deposits are from Zhong et al. (Reference Zhong, Feng, Seltmann, Li and Dai2018).

Another key factor that may affect the production of magmas is the abundance of halogens (F and Cl), which can effectively complex and transport metals (Piccoli & Candela, Reference Piccoli and Candela1994; Coulson et al. Reference Coulson, Dipple and Raudsepp2001; Webster et al. Reference Webster, Thomas, Förster, Seltmann and Tappen2004, Reference Webster, Tappen and Mandeville2009). Apatite is a sensitive indicator of volatile composition (Boudreau et al. Reference Boudreau, Mathez and McCallum1986; Mathez & Webster, Reference Mathez and Webster2005; Doherty et al. Reference Doherty, Webster, Goldoff and Piccoli2014). The calculated F concentrations of the source magmas (Mathez & Webster, Reference Mathez and Webster2005) of fertile (0.83–1.10 wt %) and barren rocks (0.82–1.01 wt %) are high but indistinguishable. In contrast, the calculated Cl concentrations of the source magmas (Mathez & Webster, Reference Mathez and Webster2005) of fertile (0.00625–0.01000 wt %) and barren rocks (0.00625–0.02125 wt %) are lower and differ significantly. Thus, the average F/Cl ratio of the source magma that produces fertile rocks (∼123.45) is much higher than that of barren rocks (∼73.98; Fig. 13c). The F/Cl ratio of fresh apatite reflects the ratio of the system it crystallized from because apatite is not vulnerable to subsolidus halogen exchange (Tacker & Stormer, Reference Tacker and Stormer1989). Thus, our results provide indirect evidence that the F/Cl ratios of the parental magmas of fertile and barren rocks differ. The apatite grains from the Wulanba granite plot in the Cu–Zn–Pb skarn deposit field in Figure 13d. It can be seen that the Cl contents of the apatite in Cu–Pb–Zn skarn deposits are much lower than those of the apatite in typical porphyry Cu deposits (mostly >0.9 wt %), but their F contents are slightly higher, indicating that the high Cl content of the magma may have a greater influence on porphyry Cu deposits than on Cu–Pb–Zn skarn deposits. These results indicate that the logfO2 and F/Cl ratios (or Cl contents) of apatite may be used to distinguish between fertile and barren rocks, i.e. apatite can be used as an indicator of the mineralization potential.
7. Conclusions
In Early Cretaceous time, the Wulanba granite was produced by partial melting of juvenile crust derived from the depleted mantle with minor inputs of older crust in an extensional setting as a result of lithosphere delamination and asthenosphere upwelling, after which the magma was highly differentiated to produce an I-type granite. The Wulanba granite was most likely derived from a Late Neoproterozoic to Early Palaeozoic source during an important stage of crustal growth in the area.
Based on geological evidence from drill cores, the geochronology of the mineralization and the abundance of ore-forming elements (Fe–Zn–Pb–Cu) in the biotite monzogranite, the biotite monzogranite contributed to the mineralization. Based on the geochemical characteristics of the apatite, the fertile biotite monzogranite has higher logfO2 values and F/Cl ratios than the barren syenogranite, indicating that it can be regarded as an indicator of mineralization potential.
Acknowledgements
This research was financially supported by the National Key R&D Program of China (2017YFC0601303), the CAGS Research Fund (YYWF201715), the NSFC (41873051), and the Basic Work Program for Science and Technology (2014FY121000). We thank Professor Daming Bai from the Institute of Mineral Resources, CAGS for his assistance with the fieldwork. We are deeply indebted to the management of the Shandong Gold Group Co. Ltd for their permission to investigate and sample the Haobugao Fe–Zn deposit.
Supplementary material
To view supplementary material for this article, please visit https://doi.org/10.1017/S0016756819000876.