INTRODUCTION
Selenium (Se) is an essential element for humans, animals and microorganisms. It was classified among toxic elements until 1957 when the nutritional benefits of Se were first published (Schwarz & Foltz Reference Schwarz and Foltz1957). Since then, Se has been identified as a key component of amino acids, selenoproteins, enzymes, antioxidants and hormones (Spallholz et al. Reference Spallholz, Boylan and Larsen1990; Rayman Reference Rayman2002). It is also important in the prevention of several cancers (Clark et al. Reference Clark, Combs, Turnbull, Slate, Chalker, Chow, Davis, Glover, Graham, Gross, Krongrad, Lesher, Park, Sanders, Smith and Taylor1996; Yu et al. Reference Yu, Zhu and Li1997), viral infections (Beck et al. Reference Beck, Shi, Morris and Levander1995), oxidative stress, inflammation (Lyons et al. Reference Lyons, Stangoulis and Robin2003), suppression of HIV progression to AIDS (Dworkin Reference Dworkin1994), Keshan disease (cardiomyopathy), Kashin–Beck disease (osteoarthropathy) (Reilly Reference Reilly1996), immunodeficiency, thyroid problems, heart disease (Arthur & Beckett Reference Arthur and Beckett1994) and male infertility (Behne et al. Reference Behne, Kyriakopoulos, Kalcklösch, Weiss-Nowak, Pfeifer, Gessner and Hammel1997).
Worldwide over one billion people suffer from Se deficiency due to low dietary intake of Se (Lyons et al. Reference Lyons, Stangoulis and Robin2003). Plants absorb Se from the soil as selenite or selenate that is incorporated into organic or inorganic Se forms, which are then eaten by animals. Most soil Se levels range from 100 to 2000 μg/kg (Swaine Reference Swaine and Swaine1955). Soil Se deficiency has been reported in New Zealand, Australia, UK, Thailand, Africa, Denmark, Finland, Central Siberia, Northeast to South central China, Turkey, parts of India, Nepal and Bangladesh (Spallholz et al. Reference Spallholz, Boylan and Rhaman2004, Reference Spallholz, Boylan, Robertson, Smith, Rahman, Hook and Rigdon2008; Fordyce Reference Fordyce and Selinus2005; Lyons et al. Reference Lyons, Monasterio, Stangoulis and Graham2005), which is reflected in low Se levels in the local diet. These low levels can be rectified by dietary diversification, Se supplementation (seleno yeast or selenomethionine), food fortification during processing and the new approach biofortification (Rayman Reference Rayman2002, Reference Rayman2004).
Biofortification is the production of a nutrition-dense crop by means of agronomic management, plant breeding and modern biotechnology (Nestel et al. Reference Nestel, Bouis, Meenakshi and Pfeiffer2006; Chen et al. Reference Chen, Truong and Belzile2009). Agronomic management includes the application of Se fertilizer to soil, soaking seeds in Se solution and foliar application (Broadley et al. Reference Broadley, Alcock, Alford, Cartwright, Foot, Fairweather-Tait, Hart, Hurst, Knott, McGrath, Meacham, Norman, Mowat, Scott, Stroud, Tovey, Tucker, White, Young and Zhao2010). Soil and foliar application are commonly practiced in Finland, New Zealand, China and Australia. Soil Se application is less efficient than foliar application (Tveitnes et al. Reference Tveitnes, Singh and Ruud1995) due to higher fertilizer doses, leaching losses (Gissel-Nielsen et al. Reference Gissel-Nielsen, Gupta, Lamand and Westermarck1984) and Se fixing in the soil (Gissel-Nielsen Reference Gissel-Nielsen1977) by organic matter and clay particles (Reilly Reference Reilly1996).
The two forms of Se, selenate and selenite, can be used for foliar application (Sima & Gissel-Nielsen Reference Sima and Gissel-Nielsen1985). The uptake of selenate and its distribution in plants is faster than that of selenite (Arvy Reference Arvy1993); hence selenate is more efficient at increasing plant Se concentration (Sima & Gissel-Nielsen Reference Sima and Gissel-Nielsen1985).
Foliar application increased Se concentration significantly in seeds of wheat (Triticum aestivum L.) (Ducsay et al. Reference Ducsay, Lozek, Varga and Losak2007; Broadley et al. Reference Broadley, Alcock, Alford, Cartwright, Foot, Fairweather-Tait, Hart, Hurst, Knott, McGrath, Meacham, Norman, Mowat, Scott, Stroud, Tovey, Tucker, White, Young and Zhao2010), barley (Hordeum vulgare L.) (Sima & Gissel-Nielsen Reference Sima and Gissel-Nielsen1985), maize (Zea mays L.) (Cary & Rutzke Reference Cary and Rutzke1981), soybean (Glycine max [L.] Merr.) (Yang et al. Reference Yang, Chen, Hu and Pan2003; Djanaguiraman et al. Reference Djanaguiraman, Devi, Shanker, Sheeba and Bangarusamy2005), pea (Pisum sativum L.) (Smrkolj et al. Reference Smrkolj, Kreft, Stibilj and Eurola2005) and common bean (Phaseolus vulgaris L.) (Smrkolj et al. Reference Smrkolj, Osvald, Osvald and Stibilj2007). Cary & Rutzke (Reference Cary and Rutzke1981) demonstrated that Se foliar application of 15 g/ha as sodium selenite (Na2SeO3) at the reproductive stage (growth stage (GS) 51 of Zadoks et al. Reference Zadoks, Chang and Konzak1974) (240 μg/kg) in maize was more efficient than at the vegetative stage (GS14–16) (120 μg/kg), yet no Se application effect was found on yield. Sima & Gissel-Nielsen (Reference Sima and Gissel-Nielsen1985) found that foliar application of Se as selenate at 5–50 g/ha increased barley seed Se concentration from deficient to adequate levels for human consumption.
Lentil (Lens culinaris Medikus subsp. culinaris) is an edible pulse and a rich source of protein (0·20–0·30), prebiotic carbohydrates, essential fatty acids and a range of micronutrients including Se (Bhatty Reference Bhatty1988; Thavarajah et al. Reference Thavarajah, Thavarajah, Wejesuriya, Rutzke, Glahn, Combs and Vandenberg2011b; Johnson et al. Reference Johnson, Thavarajah, Combs and Thavarajah2013). Selenium in lentil ranges from 22 to 672 μg/kg and is easily incorporated with proteins (Thavarajah et al. Reference Thavarajah, Vandenberg, George and Pickering2007, Reference Thavarajah, Thavarajah, Sarker, Materne, Vandemark, Shrestha, Idrissi, Hacikamiloglu, Bucak and Vandenberg2011a). Cooking lentil seeds in boiling water does not change the total Se concentration (Thavarajah et al. Reference Thavarajah, Ruszkowski and Vandenberg2008). All these factors make lentil an appropriate crop for Se biofortification.
Australia grows lentil as an export commodity in rotation with cereals. During the 2007–2011 period Australia produced on average 171 579 tonnes (t) of lentil (0·03 of global production) annually from 142 352 ha of land (0·037 of the global lentil area) (FAO 2014). Australia was the 3rd largest lentil exporting country in 2011 (FAO 2014). On average during 2007–2011, Australia exported 129 222 t of lentil annually which comprised 0·75 of local production (FAO 2014) to Bangladesh, Egypt, India, Pakistan, Saudi Arabia, Sri Lanka, Turkey and the United Arab Emirates (Pulse Australia 2011). Dietary Se is low in many of these lentil-consuming countries and seed Se concentrations of non-Se fertilized Australian lentil are low (Thavarajah et al. Reference Thavarajah, Thavarajah, Sarker, Materne, Vandemark, Shrestha, Idrissi, Hacikamiloglu, Bucak and Vandenberg2011a). Selenium-rich biofortified Australian lentil could benefit these consumers, but biofortification has not been attempted. Therefore, the objectives of the present study were to evaluate: (1) the effect of foliar Se application at two locations on lentil seed yield, seed size and seed Se concentration, and (2) genotypic variability in Se uptake and seed Se concentration among lentil genotypes at seven locations in South Australia (SA) and Victoria, the main lentil-growing States in Australia.
MATERIALS AND METHODS
Materials
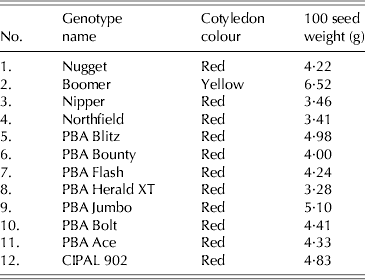
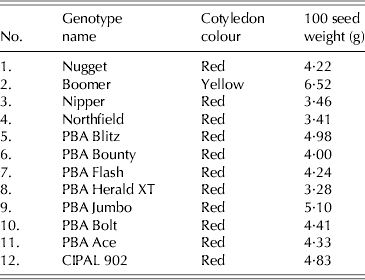
Two experiments were conducted in winter/spring of 2011. The trials had 12 common lentil genotypes including one green macrosperma lentil, Boomer, and 11 genotypes of red microsperma lentils. The identity, cotyledon colour and seed size of these genotypes are presented in Table 1.
Cotyledon colour and seed size of 12 lentil genotypes
Experiment 1: foliar selenium application
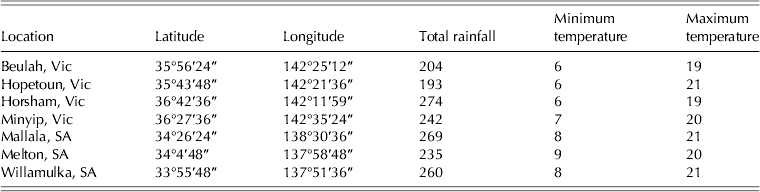
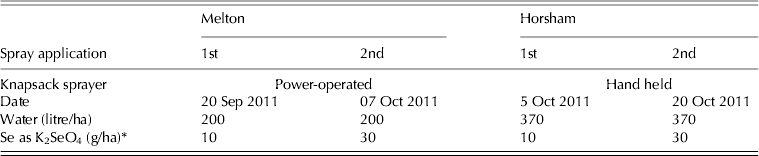
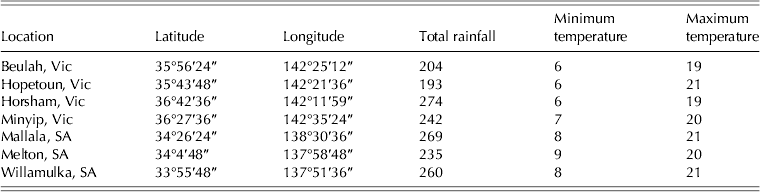
Experiment 1 was a two-factor – Se application and genotype – experiment in a split-plot design with three replications at Horsham, Victoria and Melton, SA (Table 2). Two levels of Se application (±Se) were the main plots (application details in Table 3) and 12 genotypes were the subplots. Plot size was 8·75 m2 in Victoria and 9·45 m2 in SA. The experiment was sown on 3 June 2011 at Horsham and on 9 June 2011 at Melton. Sowing was at 125 seeds/m2 with an inter-row distance of 30 cm in Victoria and 22·5 cm in SA. A total Se of 40 g/ha was applied over two applications: firstly 10 g Se/ha applied at full bloom (R2 in Erskine et al. Reference Erskine, Muehlbauer and Short1990 – flowers open on nodes 10–13 of the basal primary branch) and secondly 30 g Se/ha applied at flat pod stage (R4 – pods on nodes 10–13 of the basal primary branch have reached full length and are largely flat; seeds fill less than half of the pod area but can be felt as a bump between the fingers) (Erskine et al. Reference Erskine, Muehlbauer and Short1990). At maturity in November 2011 each plot was machine-harvested. The weight of 100 randomly selected seeds from each plot was measured after air drying (⩽40 °C) for 48 h. Seed yield was measured on an individual plot basis and converted to kg/ha. Selenium yield was calculated as the product of seed yield and seed Se concentration and expressed in mg/ha.
Latitude (S), longitude (E), total rainfall (mm), average minimum and maximum temperatures (°C) at seven locations from April to November 2011
SA, South Australia; Vic, Victoria.
Type of sprayer, date and rate of application used in foliar selenium application experiment at Melton and Horsham
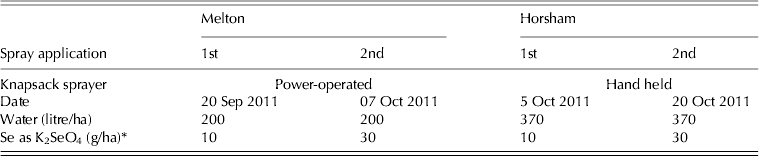
* Spray volume same as water volume.
Experiment 2: genotypic evaluation
Experiment 2 compared the same 12 genotypes in a randomized complete block design (RCBD) with three replications at seven locations (Table 2). Plot size, sowing rate and spacing were the same as in Expt 1. Plots were sown between the 3rd week of May and the 2nd week of June 2011. The trials were machine-harvested between the 1st week of November and the 1st week of December 2011. Seed weight, seed yield and Se yield were measured as described previously.
Soil sample collection, preparation and selenium measurement for both experiments
Three soil samples were collected from each location at 0–30 cm depth. Samples were stored separately in polyethylene bags and air dried (⩽40 °C). Clods were broken; roots, leaves and other inert material were removed from the samples, passed through a 2 mm sieve and stored at −20 °C until analysis. The samples were shipped to Cornell Nutrient Analysis Laboratory, Cornell University, Ithaca, USA for soil Se measurement. Total soil Se was measured by the perchloric acid digestion method (Rahman et al. Reference Rahman, Erskine, Zaman, Thavarajah, Thavarajah and Siddique2013).
Tissue and seed sample collection, preparation and selenium measurement
Three lentil branches were collected at the two crop GS from each plot in the foliar Se application trial. The first sample was collected at full bloom stage, before Se application. The second sample was collected 2 weeks after the first application, at flat pod stage prior to the second foliar application. Lentil branches were air dried at 40 °C for 24 h. Immature pods were removed from branches, and then the branches along with leaves were ground into powder. The ground samples were shipped to the Pulse Quality Laboratory, North Dakota State University (NDSU), Fargo, USA, where the samples were stored at −20 °C until analysis. Total Se concentration in lentil branches was determined using the modified HNO3–H2O2 method described by Thavarajah et al. (Reference Thavarajah, Ruszkowski and Vandenberg2008). Measurement of total Se concentration was validated using the National Institute of Standards and Technology standard reference (1567a wheat flour, Se=1·1±0·1 mg/kg) and a laboratory reference sample (CDC Redberry, Se=700 μg/kg). Total Se concentration was determined using Inductively Coupled Plasma Emission Spectrometry (ICP-ES; ICP-6500 Duo, Thermo Fisher Scientific, PA, USA) with a detection limit of 75 μg/l and quantified using a calibration curve that ranged from 1 to 5 mg/l.
Seed samples were collected from both experiments after harvesting and threshing individual plots. Seeds were air dried (⩽40 °C), cleaned and ground into a fine powder (<0·5 mm sieve). The samples were shipped to the Pulse Quality Laboratory, NDSU and stored at −20 °C until analysis. Seed Se concentration was determined using the modified HNO3–H2O2 method described by Thavarajah et al. (Reference Thavarajah, Ruszkowski and Vandenberg2008) and Rahman et al. (Reference Rahman, Erskine, Zaman, Thavarajah, Thavarajah and Siddique2013).
Statistical analysis
Two-factor split-plot analysis of variance (ANOVA) was performed in GenStat 14.1 (VSN International Ltd) for each foliar Se application trial and then a combined analysis was performed. For the genotypic evaluation trials, a general linear mixed model ANOVA was performed using restriction maximum likelihood (REML) procedure in ASReml–R version 3. For both trials, means were separated by Fisher's least significant difference test (LSD) at P<0·05. Genotypic and phenotypic correlation coefficients were estimated by the formulae of Johnson et al. (Reference Johnson, Robinson and Comstock1955), Miller et al. (Reference Miller, Williams, Robinson and Comstock1958) and Singh & Chaudhary (Reference Singh and Chaudhary1979).
RESULTS
Experiment 1: foliar selenium application
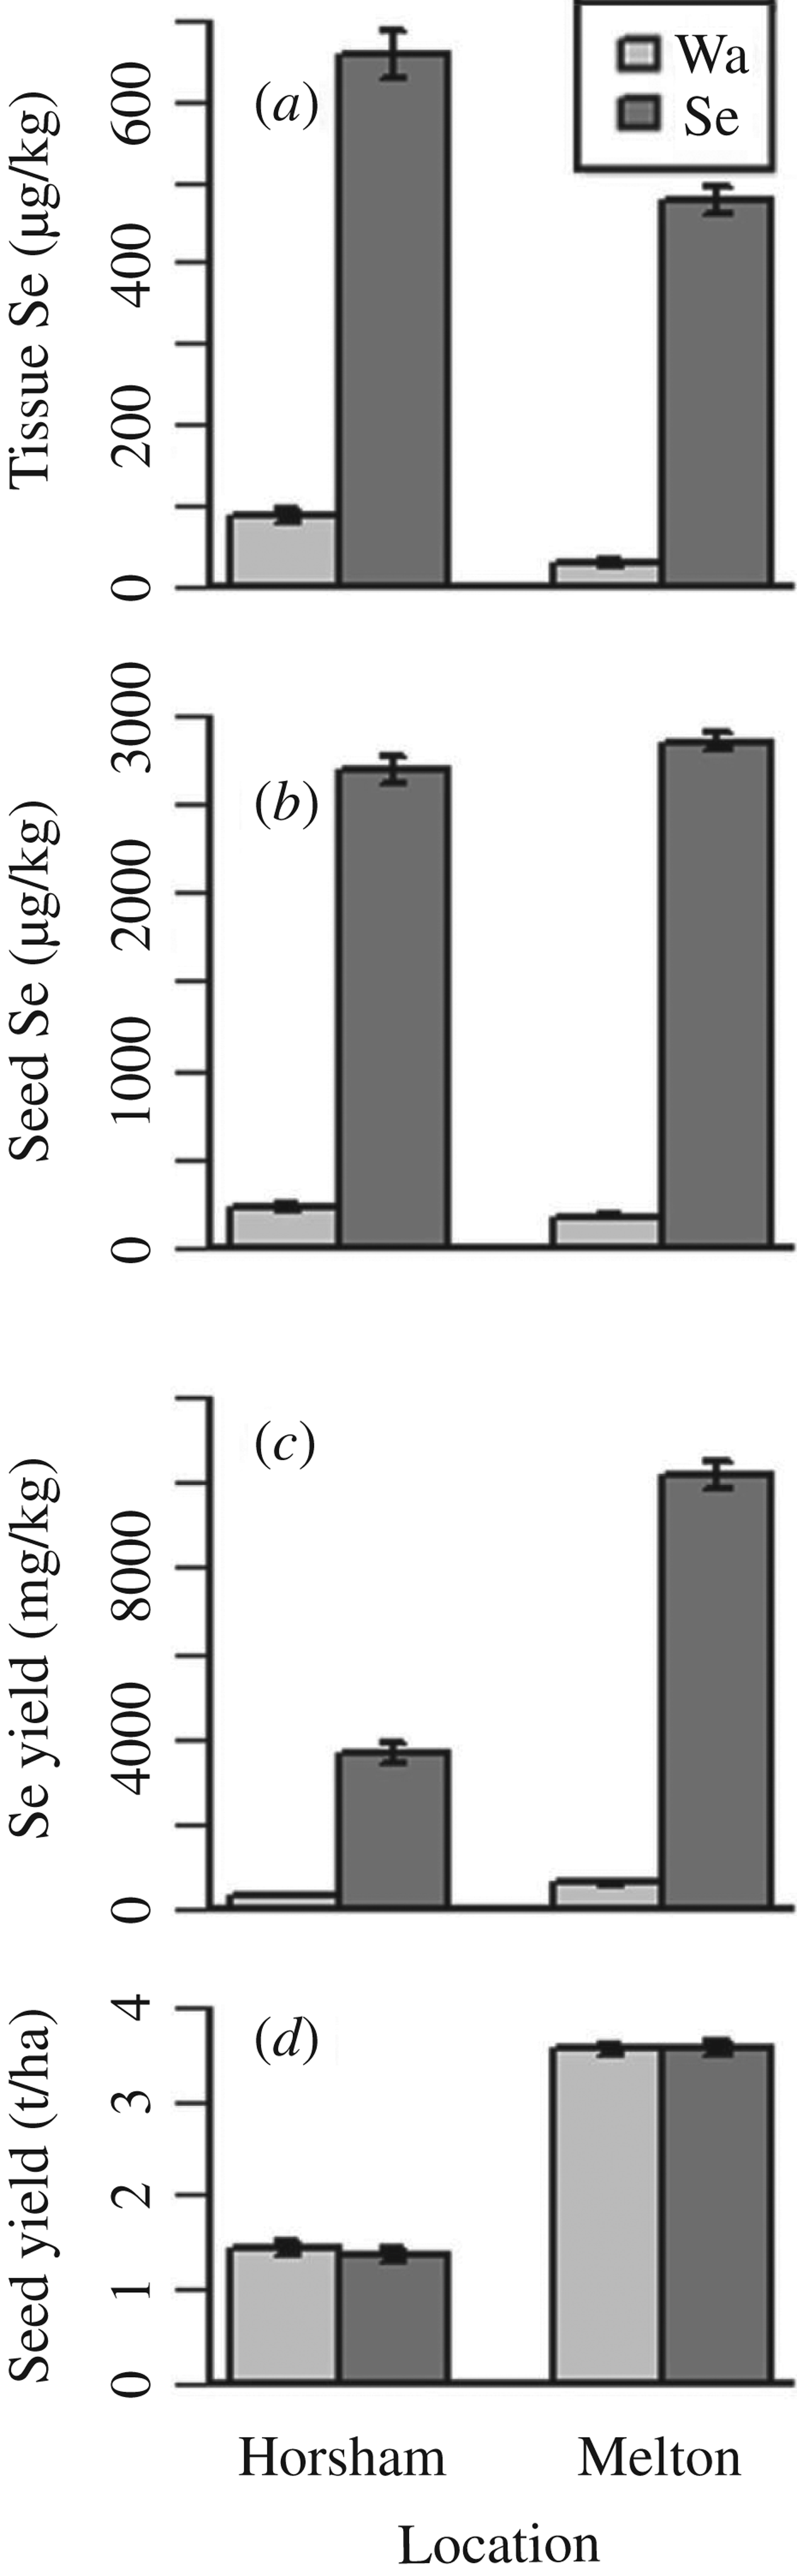
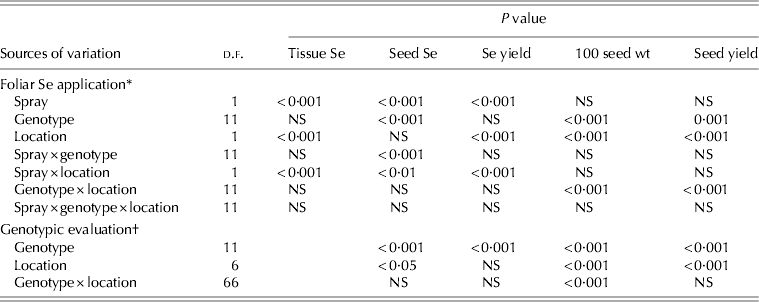
There were significant differences between the foliar application of water and Se for both tissue (P<0·001) and seed Se (P<0·001) concentration and Se yield (P<0·001), but not for seed size and seed yield (Table 4). The average tissue Se concentration increased from 29 μg/kg with water application to 478 μg/kg with Se application at Melton, and similarly from 85 to 659 μg/kg at Horsham (Fig. 1). On average, after Se application tissue Se concentration increased from 57 to 568 μg/kg, seed Se concentration from 201 to 2772 μg/kg and Se yield from 464 to 6917 mg/ha.
Effect of water v. selenium (Se) foliar application on mean (n=36) and standard error (s.e.-bar) of (a) tissue Se concentration (μg/kg), (b) seed Se concentration (μg/kg), (c) Se yield (mg/ha) and (d) seed yield (t/ha) in Horsham and Melton in the foliar Se application experiment.

Analyses of variance showing degrees of freedom (d.f.) and F-test (P) values for different variables of the foliar selenium (Se) application and genotypic evaluation experiments
NS, not significant.
* Number of samples=144.
† Number of samples=252.
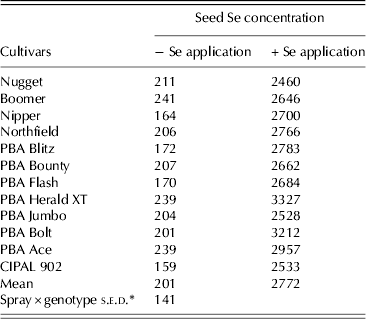
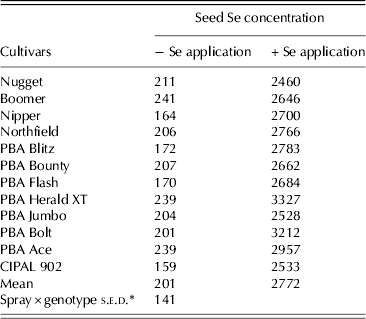
Seed Se concentration increased more than 13-fold in each cultivar after Se application. The water treatment ranged from 159 to 241 μg/kg and the Se treatment ranged from 2460 to 3327 μg/kg (Table 5). The spray×genotype interaction was significant for seed Se concentration (P<0·001). Seed Se concentration did not differ significantly among cultivars with the water treatment but it differed significantly with Se application (P<0·001). After Se application, cultivars PBA Herald XT (3327 μg/kg), PBA Bolt (3212 μg/kg) and PBA Ace (2957 μg/kg) had significantly higher seed Se (P<0·001) concentration than other cultivars (Table 5).
Effect of water and selenium (Se) foliar application on seed Se concentration (μg/kg) of 12 lentil cultivars grown in the foliar Se application experiment
* s.e.d., standard error of difference.
In the water treatment, seed Se concentration was significantly (P<0·001) higher in Horsham (230 μg/kg) than Melton (172 μg/kg); but this became statistically equivalent after Se application (Fig. 1).
Significant variation was also observed for Se yield at the two locations with Melton significantly higher than Horsham (P<0·001) (Fig. 1). In general, foliar Se application increased Se yield by 40-fold compared with the water application at both locations.
Genotypic evaluation
The ANOVA identified significant genotypic (P<0·001) and location (P<0·05) variation for seed Se concentration, seed size (P<0·001 for both genotype and location) and seed yield (P<0·001 for both genotype and location) (Table 4). There was also significant genotype variation for Se yield (P<0·001). However, the genotype×location interaction was not significant for all these characters except 100 seed weight (P<0·001).
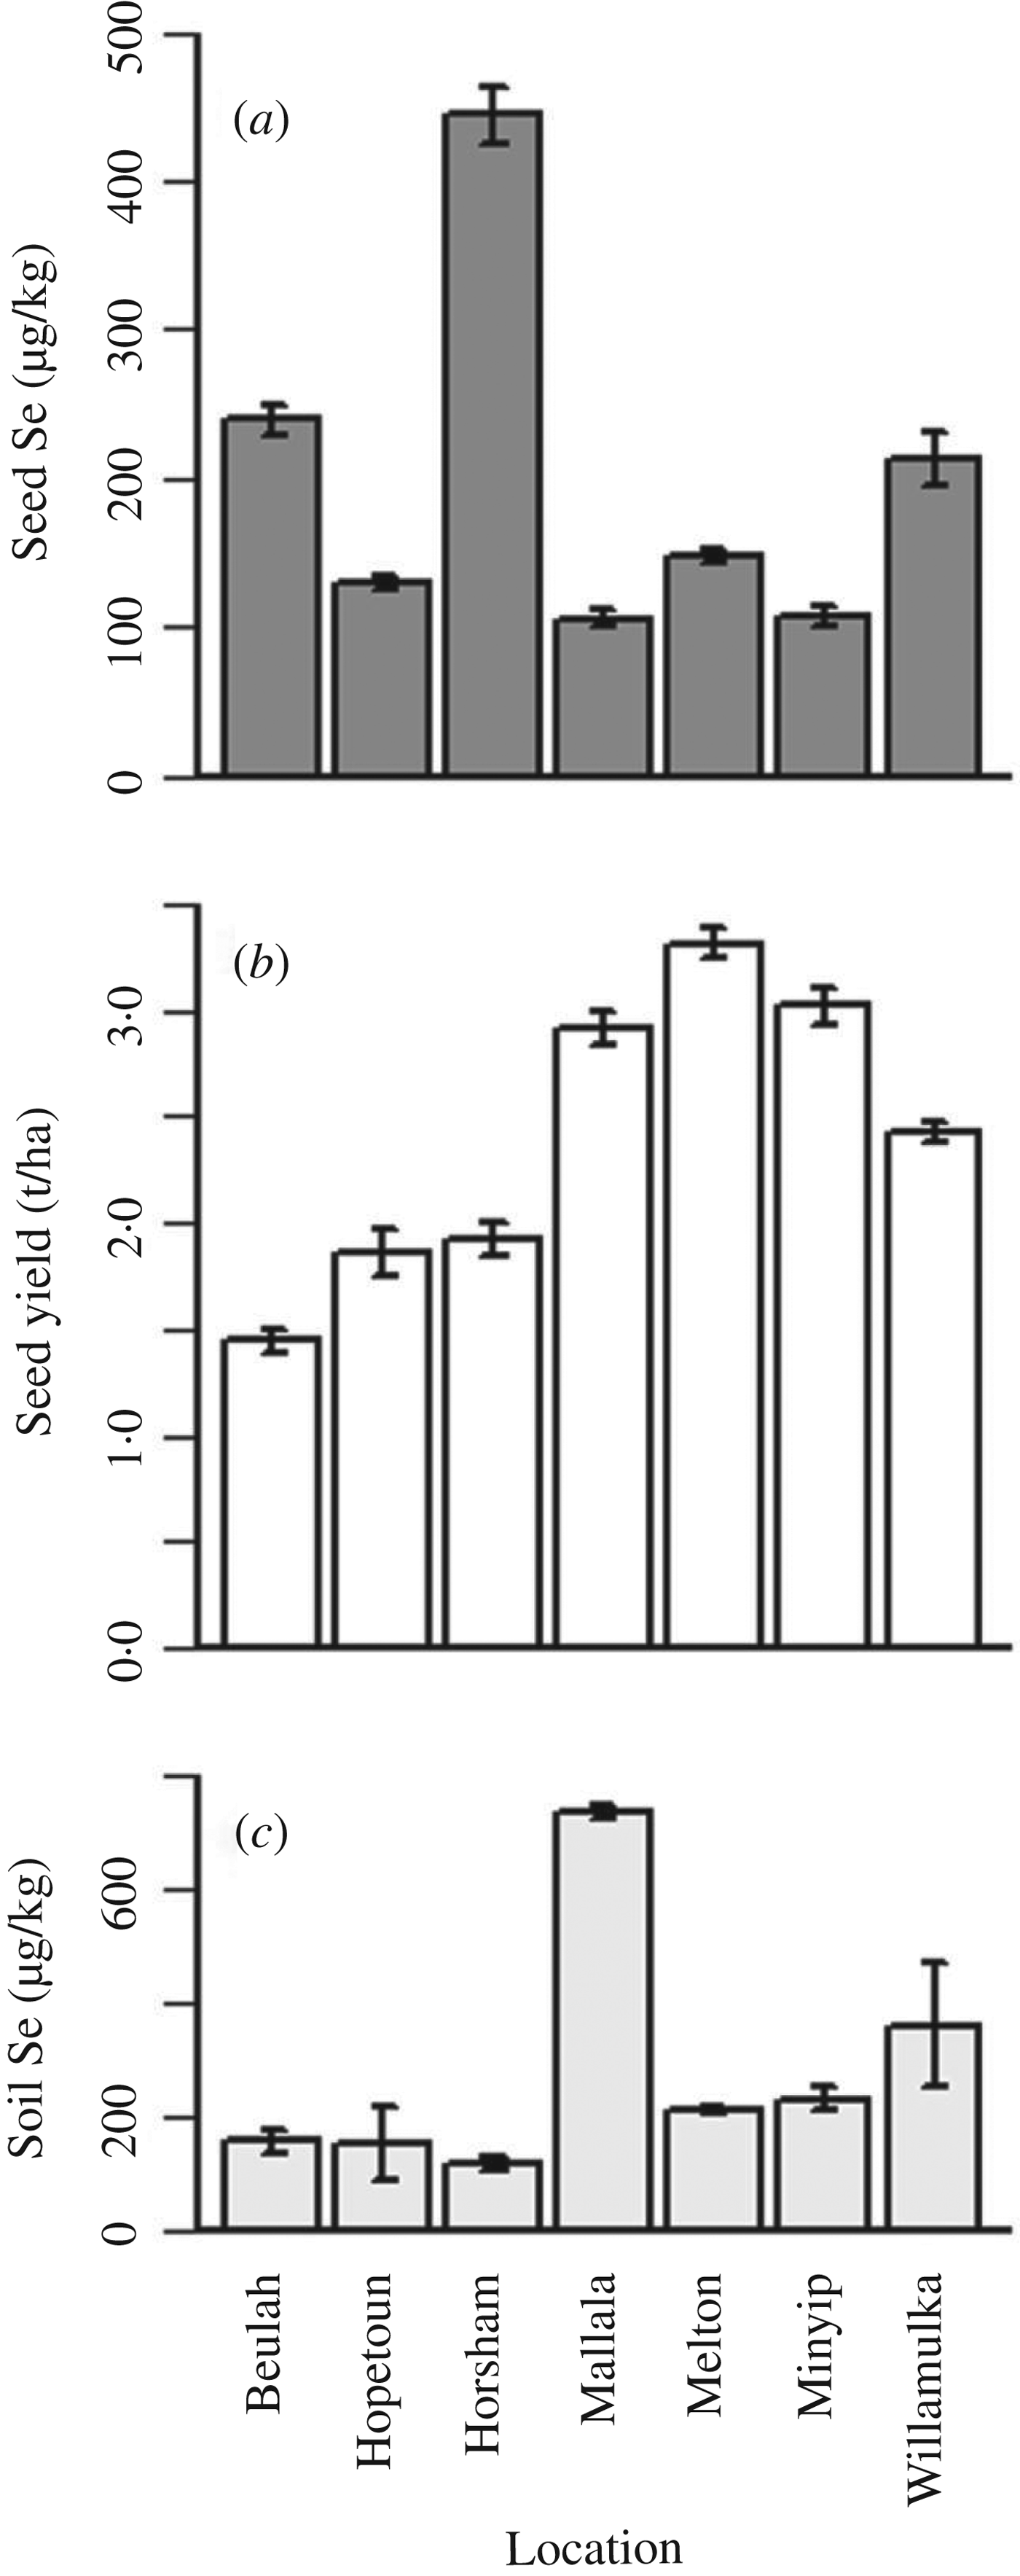
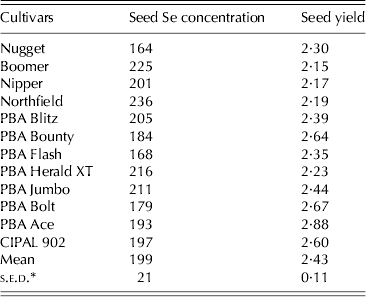
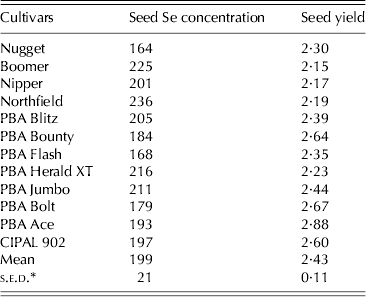
Seed Se concentration ranged from 164 to 236 μg/kg among the 12 genotypes with an average of 199 μg/kg. The cultivars Northfield (236 μg/kg), Boomer (225 μg/kg), PBA Herald XT (216 μg/kg) and PBA Jumbo (211 μg/kg) had significantly higher seed Se concentrations (P<0·001) than other cultivars (Table 6). Seed Se concentration across the seven locations ranged from 106 to 444 μg/kg, with the highest at Horsham (Fig. 2).
Mean and standard error (s.e.-bar) at seven locations for (a) seed selenium (Se) concentration* (μg/kg), (b) seed yield* (t/ha), (c) soil Se concentration† (μg/kg) across 12 cultivars in the genotypic evaluation trial. *n=36; †n=3.
Performance of 12 lentil cultivars for seed selenium (Se) concentration (μg/kg) and seed yield (t/ha) across seven locations in the genotypic evaluation trial
* s.e.d., standard error of difference.
Seed yield varied significantly for genotypes (P<0·001) and locations (P<0·001). The cultivars PBA Ace (2·88 t/ha), PBA Bolt (2·67 t/ha), PBA Bounty (2·64 t/ha) and CIPAL 902 (2·60 t/ha) had significantly higher seed yield (P<0·001) than other cultivars (Table 6). Across the seven locations, seed yield ranged from 1·45 to 3·32 t/ha with Melton, Minyip and Mallala producing significantly higher seed yield (P<0·001) than the other locations (Fig. 2).
Soil Se concentration across the seven locations varied from 151 to 737 μg/kg with an average of 281 μg/kg. Significantly higher soil Se concentrations (P<0·001) were observed at Mallala and Willamulka (Fig. 2).
Significant cultivar effects were observed for seed size (P<0·001) ranging from 3·28 to 5·10 g per 100 seed among the red lentil genotypes, while the large-seeded green cultivar Boomer had a seed size of 6·52 g/100 seed. A significant location effect was also observed for seed size (P<0·001) with the largest seeds produced at Mallala.
The genotypic correlation coefficient for seed Se concentration and seed yield (r g=−0·60, P<0·001) was negative, strong and highly significant, and the phenotypic correlation coefficient (r p=−0·21, P<0·01) was negative, weaker but still significant. Seed yield (r=0·44, P<0·05) was positively and significantly associated with soil Se concentration. The genotypic correlation coefficient between seed Se concentration and seed weight (r g=0·184, P<0·01) was positive, weak, but significant; whereas the equivalent phenotypic correlation was not significant.
DISCUSSION
Lentil exhibited a high capacity to store Se in the seed with foliar Se application, increasing from 201 to 2772 μg/kg. Selenium application had no effect on seed size or seed yield. The cultivars PBA Herald XT (3327 μg/kg), PBA bolt (3212) and PBA Ace (2957 μg/kg) had higher seed Se concentration with Se applications than other cultivars.
Based on information from wheat (Ducsay et al. Reference Ducsay, Lozek, Varga and Losak2007; Broadley et al. Reference Broadley, Alcock, Alford, Cartwright, Foot, Fairweather-Tait, Hart, Hurst, Knott, McGrath, Meacham, Norman, Mowat, Scott, Stroud, Tovey, Tucker, White, Young and Zhao2010), barley (Sima & Gissel-Nielsen Reference Sima and Gissel-Nielsen1985), maize (Cary & Rutzke Reference Cary and Rutzke1981), soybean (Yang et al. Reference Yang, Chen, Hu and Pan2003; Djanaguiraman et al. Reference Djanaguiraman, Devi, Shanker, Sheeba and Bangarusamy2005) and pea (Smrkolj et al. Reference Smrkolj, Kreft, Stibilj and Eurola2005), a total of 40 g/ha Se as K2SeO4 was applied in two applications at full bloom and flat pod stage and this regime was found to be very effective for lentil Se biofortification. Tissue Se concentration in lentil increased approximately tenfold after Se application from 58 to 569 μg/kg. Similarly, tissue Se concentration increased in barley from 30 to 527 μg/kg (Sima & Gissel-Nielsen Reference Sima and Gissel-Nielsen1985) and in soybean from 100 to 300 μg/kg (Djanaguiraman et al. Reference Djanaguiraman, Devi, Shanker, Sheeba and Bangarusamy2005).
Lentil seed Se concentration increased sharply from 201 to 2772 μg/kg with Se foliar application. At various application rates, foliar Se application significantly increased seed Se concentration in barley from 10 to 702 μg/kg (Sima & Gissel-Nielsen Reference Sima and Gissel-Nielsen1985), wheat from 16 to 2524 μg/kg (Broadley et al. Reference Broadley, Alcock, Alford, Cartwright, Foot, Fairweather-Tait, Hart, Hurst, Knott, McGrath, Meacham, Norman, Mowat, Scott, Stroud, Tovey, Tucker, White, Young and Zhao2010), soybean from 28 to 1211 μg/kg (Yang et al. Reference Yang, Chen, Hu and Pan2003) pea from 21 to 743 (Smrkolj et al. Reference Smrkolj, Kreft, Stibilj and Eurola2005) and common bean from 30 to 2379 μg/kg (Smrkolj et al. Reference Smrkolj, Osvald, Osvald and Stibilj2007).
In the present study, without Se application, the seed Se concentration in Australian lentil is 199 μg/kg, which is lower than in Canadian (672 μg/kg) and Bangladeshi (312 μg/kg) lentil; but higher than lentil grown in India (208 μg/kg), Nepal (180 μg/kg), Turkey (47 μg/kg), Morocco (28 μg/kg), Northwestern USA (26 μg/kg) and Syria (22 μg/kg) (Kumar & Krishnaswamy Reference Kumar and Krishnaswamy1997; Thavarajah et al. Reference Thavarajah, Ruszkowski and Vandenberg2008, Reference Thavarajah, Thavarajah, Sarker, Materne, Vandemark, Shrestha, Idrissi, Hacikamiloglu, Bucak and Vandenberg2011a; Rahman et al. Reference Rahman, Erskine, Zaman, Thavarajah, Thavarajah and Siddique2013). However, agronomic biofortification of Australian lentil by Se fertilization increased seed Se concentration beyond that reported for the no-Se applied lentil from Canada and Bangladesh.
Biofortified lentil represents a rich source of Se and is also safe for those with Se-rich diets. The World Health Organization (WHO) recommended daily allowance (RDA) of Se is 55 μg/person/day (Monsen Reference Monsen2000). Consumption of 20 g of this biofortified lentil will provide all of the RDA for Se. Data on the consumption of individual food grains, including pulse crops, are not as readily available as that for area, production and trade (Akibode & Maredia Reference Akibode and Maredia2012). Based on current pulse consumption, the average maximum lentil consumption in developing countries does not exceed 22 g/person/day (Akibode & Maredia Reference Akibode and Maredia2012). In developed countries such as Australia where Se is not deficient in the population, average daily consumption of lentil is 5·34 g/person/day (calculated from FAO 2014). Without changing food habits, consumption of biofortified lentil would supply adequate Se to consumers, similar to the supply of vitamin A and Fe to children in biofortified sweet potato and common bean, respectively in Uganda (Wagabaza Reference Wagabaza2013).
Selenium biofortification is more economical than Se supplementation, but from the farmers’ point of view Se biofortification of lentil is not economic. Foliar Se application costs were estimated as US$ 483/ha (113 g potassium selenate (K2SeO4) US$461, two applications US$22). Average seed yield of biofortified lentil was 2·47 t/ha, which can provide the whole RDA of Se to 123 500 persons/day or 338 persons/year: this is equivalent to US$1.42/person/year. Cost of equivalent Se supplementation with Se tablets commercially available in Australia is US$ 31/person/year (http://www.vitamingrocer.com.au), which is higher than Se biofortification. The cost of Se biofortification in other crops is unavailable. However, compared with fortification of wheat flour with iron (Fe) and zinc (Zn), Se biofortification is costly. Fortification of wheat flour with Fe costs US$0.12/person/year (Layrisse et al. Reference Layrisse, Chaves, Mendez-Castellano, Bosch, Tropper, Bastardo and González1996) and with Zn costs US$0.06–0·24/person/year (Horton Reference Horton2006). Farmers are unlikely to adopt Se foliar application unless there is a premium for high-seed Se concentration. In the present experiment, high-quality Se was applied for research purposes and further research is required with commercial Se fertilizers to reduce the cost of Se application.
There was a significant cultivar effect observed for Se application. The cultivars PBA Herald XT, PBA Bolt and PBA Ace were efficient in Se uptake with significantly higher seed Se concentration than other cultivars following Se application. This result differs with other crops, where cultivar differences were not significant in bean (Smrkolj et al. Reference Smrkolj, Osvald, Osvald and Stibilj2007), soybean (Yang et al. Reference Yang, Chen, Hu and Pan2003) and wheat (Curtin et al. Reference Curtin, Hanson, Lindley and Butler2006; Broadley et al. Reference Broadley, Alcock, Alford, Cartwright, Foot, Fairweather-Tait, Hart, Hurst, Knott, McGrath, Meacham, Norman, Mowat, Scott, Stroud, Tovey, Tucker, White, Young and Zhao2010) for seed Se concentration with foliar Se application. The lentil cultivars PBA Herald XT, PBA Bolt and PBA Ace may be used in a lentil biofortification programme.
Significant location effects for lentil seed Se concentration were found in the genotypic evaluation trial with the highest seed Se concentration observed at Horsham. Melton and Horsham were previously reported as contrasting for seed Se in Australia (Thavarajah et al. Reference Thavarajah, Thavarajah, Sarker, Materne, Vandemark, Shrestha, Idrissi, Hacikamiloglu, Bucak and Vandenberg2011a) and hence selected as sites for the Se application experiment. However, the difference between locations disappeared with Se application. Clearly, the massive response to Se application allows biofortification at contrasting sites.
Selenium foliar application did not affect lentil seed size or seed yield, confirming research on seed yield in wheat (Lyons et al. Reference Lyons, Lewis, Lorimer, Holloway, Brace, Stangoulis and Graham2004), barley (Sima & Gissel-Nielsen Reference Sima and Gissel-Nielsen1985), rice (Oryza sativa L.) (Hu et al. Reference Hu, Chen, Xu, Zhang and Pan2002) and soybean (Yang et al. Reference Yang, Chen, Hu and Pan2003). However, some beneficial effects have been reported on plant growth, i.e. drought tolerance in wheat (Kuznetsov et al. Reference Kuznetsov, Kholodova, Kuznetsov and Yagodin2003) and canola (Brassica napus L.) (Zahedi et al. Reference Zahedi, Noormohammadi, Rad, Habibi and Boojar2009), a 40% yield increase in Brassica rapa L. (Lyons et al. Reference Lyons, Genc, Soole, Stangoulis, Liu and Graham2009), and increased aphid resistance in Indian mustard (Brassica juncea L.) (Hanson et al. Reference Hanson, Lindblom, Loeffler and Pilon-Smits2004).
Agronomic biofortification is a rapid way to increase Se concentration in crops but not a complete and sustainable solution (Nestel et al. Reference Nestel, Bouis, Meenakshi and Pfeiffer2006). In contrast, breeding to improve Se uptake by plants may be an effective and sustainable strategy for the long term (Nestel et al. Reference Nestel, Bouis, Meenakshi and Pfeiffer2006). The main objective of the present study was to observe the effect of foliar Se application on lentil. However, some genetic variation for seed Se concentration in the genotypic evaluation trial was observed, which reflects similar findings in lentil (Thavarajah et al. Reference Thavarajah, Ruszkowski and Vandenberg2008; Rahman et al. Reference Rahman, Erskine, Zaman, Thavarajah, Thavarajah and Siddique2013), wheat, rice, brassica vegetables (Combs Reference Combs2001) and soybean (Wei Reference Wei1996). Genotypic variability also exists within cereal crops for Zn, Fe and other nutrients (Graham et al. Reference Graham, Senadhira, Beebe, Iglesias and Monasterio1999). The results of the genotype×environment interaction study are consistent with the results of a previous study on lentil in Bangladesh (Rahman et al. Reference Rahman, Erskine, Zaman, Thavarajah, Thavarajah and Siddique2013) and Canada (Thavarajah et al. Reference Thavarajah, Ruszkowski and Vandenberg2008). Both genotype and environment effects exist for seed Se concentration irrespective of seed size. However, the genotype×environment interaction was not significant for seed Se concentration. Wherever genotypic variation exists, there is scope for breeding (Nestel et al. Reference Nestel, Bouis, Meenakshi and Pfeiffer2006). Findings from the present study strongly suggest the possibility of selection for Se uptake in the early stages of a breeding programme.
Soil Se concentration in the present study ranged from 119 to 738 μg/kg across locations. Although the soil Se concentration in Australian lentil-growing soil was higher than in Canada (37–301 μg/kg) (Thavarajah et al. Reference Thavarajah, Ruszkowski and Vandenberg2008) and Bangladesh (113–189 μg/kg) (Rahman et al. Reference Rahman, Erskine, Zaman, Thavarajah, Thavarajah and Siddique2013), seed Se concentration in Australian lentil was lower than both these countries. Other factors that also indicate plant-available Se are soil texture, pH, organic matter, CEC and redox potential (Cary & Allaway Reference Cary and Allaway1969; Gissel-Nielsen et al. Reference Gissel-Nielsen, Gupta, Lamand and Westermarck1984; Johnsson Reference Johnsson1991). Clearly further investigation is required to identify the main driving factor(s) of seed Se concentration in lentil.
CONCLUSION
A total of 40 g/ha foliar application of Se during the reproductive stage increased seed Se concentration from 201 to 2772 μg/kg which is effective for lentil biofortification in Australia. Without changing food habits, biofortified lentil would provide adequate dietary Se which is low in many lentil-consuming countries. Therefore, biofortified lentil might be a good source of dietary Se to consumers.
The support of The University of Western Australia (UWA), Centre for Legumes in Mediterranean Agriculture and the UWA Institute of Agriculture for the PhD scholarship, operating expenses of M.M. Rahman is gratefully acknowledged. Trial management and sample collection and preparation were organized by the Department of Primary Industries (DPI), Horsham, Victoria, Australia and the South Australian Research and Development Institute (SARDI), Clare, South Australia, Australia.