Introduction
Forests are complex ecosystems and forest biodiversity assessment and monitoring require multidisciplinary approaches for defining structure and taxon-based indicators (Puumalainen et al. Reference Puumalainen, Kennedy and Folving2003; Blasi et al. Reference Blasi, Marchetti, Chiavetta, Aleffi, Audisio, Azzella, Brunialti, Capotorti, Del Vico and Lattanzi2010). Different taxonomic groups of organisms are proposed as suitable indicators for monitoring ecological integrity and estimating the biodiversity of forests (Welsh & Droege Reference Welsh and Droege2001; Blasi et al. Reference Blasi, Marchetti, Chiavetta, Aleffi, Audisio, Azzella, Brunialti, Capotorti, Del Vico and Lattanzi2010). A recent review of biodiversity indicators for forest ecosystems in Europe included lichens among the most valuable indicators for both stand and landscape level analyses (Gao et al. Reference Gao, Nielsen and Hedblom2015).
Lichens make a significant contribution to nutrient and water cycling, as well as to food-webs in forest ecosystems (Galloway Reference Galloway1992; McCune Reference McCune2000; Ellis Reference Ellis2012; Li et al. Reference Li, Liu, Li, Song, Shi and Lu2015). Moreover, they are a significant and sensitive component of the forest biota and for this reason are widely used for biomonitoring purposes and are included in continental-scale forest biodiversity assessments and monitoring programmes (e.g. Forest Health Monitoring program (McCune Reference McCune2000); ForestBIOTA (Stofer Reference Stofer2006)). In Europe, different sampling guidelines have been developed for lichen diversity monitoring (Asta et al. Reference Asta, Erhardt, Ferretti, Fornasier, Kirschbaum, Nimis, Purvis, Pirintsos, Scheidegger and Van Haluwyn2002; Scheidegger et al. Reference Scheidegger, Groner, Keller and Stofer2002; Stofer et al. Reference Stofer, Calatayud, Ferretti, Fischer, Giordani, Keller, Stapper and Scheidegger2003, Reference Stofer, Calatayud, Giordani and Neville2012; Giordani et al. Reference Giordani, Brunialti, Benesperi, Rizzi, Frati and Modenesi2009). Recently, the Comité Européen de Normalization (CEN) has adopted a standard procedure for sampling design and assessment of lichen diversity (Ambient air – Biomonitoring with lichens – Assessing epiphytic lichen diversity; European Standard EN 16413:2014). The sampling strategy included in that document was developed mainly for air pollution monitoring activities and focused only on tree trunks (1–1·5 m above ground) (Cristofolini et al. Reference Cristofolini, Brunialti, Giordani, Nascimbene, Cristofori, Gottardini, Frati, Matos, Batič and Caporale2014), thus overlooking several additional microhabitats relevant for lichens in forest ecosystems. A reduction of sampling effort on tree trunks has been suggested by previous studies (Nascimbene et al. Reference Nascimbene, Marini, Bacaro and Nimis2010) as a potential strategy to redirect the sampling effort to currently overlooked microhabitats, such as the canopy and coarse woody debris (CWD), and to design sampling schemes that would result in a more comprehensive species capture in forest ecosystems.
Forest canopy is a valuable habitat for a variety of organisms, especially cryptogams (Ozanne et al. Reference Ozanne, Anhuf, Boulter, Keller, Kitching, Körner, Meinzer, Mitchell, Nakashizuka and Silva Dias2003; Ellis Reference Ellis2012; Marmor et al. Reference Marmor, Tõrra, Saag, Leppik and Randlane2013). The vertical stratification of epiphytic lichens has been previously reported by several authors (McCune et al. Reference McCune, Amsberry, Camacho, Clery, Cole, Emerson, Felder, French, Greene and Harris1997; Fritz Reference Fritz2009; Li et al. Reference Li, Liu, Li, Song, Shi and Lu2015). However, a survey of canopy lichens is not included in current CEN lichen monitoring guidelines, mainly due to practical constraints. These constraints have been estimated to overlook 38–54% of lichen diversity (Boch et al. Reference Boch, Müller, Prati, Blaser and Fischer2013). It is therefore relevant to explore a possible trade-off that would allow this component to be included in lichen diversity monitoring by, for example, recording epiphytic litter on fallen branches which could provide information on canopy lichens.
Different types of CWD, important for forest biodiversity, provide a key microhabitat for lichens, bryophytes, saproxylic fungi, beetles and birds (Siitonen et al. Reference Siitonen, Martikainen, Punttila and Rauh2000; Travaglini et al. Reference Travaglini, Barbati, Chirici, Lombardi, Marchetti and Corona2007; Nascimbene et al. 2008 Reference Nascimbene, Marini, Caniglia, Cester and Nimisa , Reference Nascimbene, Marini, Motta and Nimisb ; Spribille et al. Reference Spribille, Thor, Bunnell, Goward and Björk2008; Blasi et al. Reference Blasi, Marchetti, Chiavetta, Aleffi, Audisio, Azzella, Brunialti, Capotorti, Del Vico and Lattanzi2010; Blasy & Ellis Reference Blasy and Ellis2014). In managed forests, natural CWD is often removed, and human-induced woody habitats such as tree stumps are the only available microhabitat for deadwood-associated lichens (Travaglini et al. Reference Travaglini, Barbati, Chirici, Lombardi, Marchetti and Corona2007; Nascimbene et al. 2008 Reference Nascimbene, Marini, Caniglia, Cester and Nimisa ). In consequence, stumps could be the most valuable CWD microhabitat to be included in standardized forest lichen monitoring in managed forests.
In this paper, we present results of a small-scale pilot study to evaluate the possible advantage of including four distinct microhabitats in CEN procedures for assessing epiphytic lichen diversity. Trunk bases, trunks between 100 and 150 cm above the ground, stumps, and fallen branches were each sampled with a different standardized sampling method along a forest age gradient in temperate deciduous forests of the Caucasian region. Plot-level species richness, between the standardized sampling procedures and a non-probabilistic floristic sampling, was also contrasted to evaluate the effectiveness of standardized sampling in capturing the plot-level lichen diversity.
Materials and Methods
Study area
The study area is the Noyemberyan Forest (24 942 ha) in the Tavush Province of Armenia. Deciduous stands dominate, occupying the north-western part of the Gugarats mountain range at elevations between 500–1850 m. Dominant trees are Fagus orientalis, Quercus iberica and Carpinus betulus (Ministry of Nature Protection 2008). Annual precipitation is 550–600 mm and mean annual temperature is 10·4 °C.
Lichen sampling design
The fieldwork, July to August 2015, was carried out in 15 circular plots (26 m in diam.) randomly selected in pure stands of Fagus orientalis across three age classes (five plots per class): 60-90, 110-130 and 150-180 years old. The forest stands are subjected to the same management type and are at comparable elevations (1000-1250 m). The distance between plots of the same age class was >1 km. In each plot, the 5 trees (DBH (diameter at breast height) >18 cm) closest to the plot centre were selected for the lichen survey. Lichen diversity was sampled using a standardized probabilistic method with two 10×50 cm frames subdivided into five 10×10 cm quadrats attached to the tree trunk at the N and S cardinal points, the shorter lower side positioned 1 m above the ground. Two additional 10×50 cm frames were placed at the base of the trunk at the same cardinal points. All lichen species inside the frames, including sterile crustose lichens, were listed and their frequency determined as the number of 10×10 cm quadrats in which they occurred. The lichen richness of the trunks was also recorded by carefully examining the whole surface of the trunks from the base up to 2 m according to a non-probabilistic sampling approach.
In each plot, the three fallen branches (1–2 cm in diam.) closest to the plot centre were surveyed. The first 20 cm of each branch length was divided into four equal parts of 5 cm and sampled for all lichens, starting from the more proximal end (larger diameter/attachment end). Afterwards, a non-probabilistic sampling approach was applied to record the lichen species along the whole branch length. We are aware that the inclusion of epiphytic litter and/or fallen branches for estimating lichen diversity poses several formal issues in terms of sampling design, which deal synthetically with the definition of the reference population from which the sample is sorted. However, we tried to develop a pragmatic approach to the inclusion of the lichen canopy component into a formal monitoring framework.
In each plot, the three tree stumps closest to the plot centre were surveyed. One quadrat (10×10 cm) was placed at the centre of the cut surface and four quadrats were placed at the centre of the N, S, E and W vertical parts of the stump. As for the other microhabitats, non-probabilistic floristic sampling on the whole stump surface was carried out.
Lichen identification
When possible, lichens were identified in the field but species identification was based mostly on the study of collected specimens (c. 1500) and some voucher specimens stored in the Herbarium of the Botanic Garden and Botanical Museum Berlin-Dahlem (B). In particular, crustose lichens were identified in the laboratory using both a stereomicroscope and compound microscope. Standard chemical spot tests and UV-light fluorescence were performed on some specimens. The identification of sterile leprose/crustose lichens (c. 120 specimens) was based on standardized thin-layer chromatography (TLC) following the protocols of Orange et al. (Reference Orange, James and White2010). Nomenclature of lichen species mainly follows Smith et al. (Reference Smith, Aptroot, Coppins, Fletcher, Gilbert, James and Wolseley2009).
Data Analysis
Species richness
To test the effect of including the four different microhabitats in the sampling procedure, we used the linear mixed model lme function in the package nlme (Pinheiro et al. Reference Pinheiro, Bates, DebRoy and Sarkar2016). The response variable was the number of species. The model included the sampling procedure (i.e. the four microhabitats), stand age and their interactions as fixed effects and plot ID as a random factor. A paired t-test was used to compare species richness estimates between standardized and non-probabilistic sampling strategies. Statistical analyses were implemented in R version 3.2.3. (R Core Team 2015).
Species composition
For each stand age class, differences in species composition among the four types of microhabitat (base of trunks, trunks between 100–150 cm above the ground, stumps and fallen branches) were tested by multi-response permutation procedures (MRPP) as implemented in PC-ORD (McCune & Mefford Reference McCune and Mefford1999), using the Sørensen distance measure on rank transformed distance matrices. MRPP was used to test differences between microhabitat types as well as for all the microhabitats in toto. The test statistic A in MRPP describes the separation between stand types. The pattern of species composition was also visually evaluated using non-metric multidimensional scaling (McCune & Grace Reference McCune and Grace2002) as implemented in PC-ORD (McCune & Mefford Reference McCune and Mefford1999), using the “slow and thorough” autopilot mode with the Sørensen distance measure. This procedure performed 40 runs with the real dataset compared with 50 randomized runs, each run with 400 iterations. This iterative ordination method is based on ranked distances between sample units in the data matrix, known as “species space” (McCune & Grace Reference McCune and Grace2002); it does not assume linear relationships or normally distributed data and is therefore suited for most ecological data.
Results
Species richness
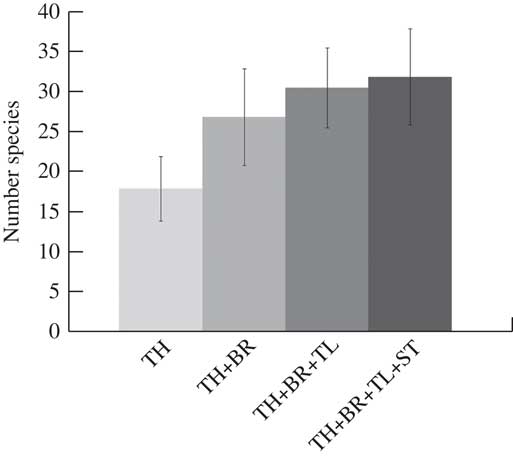
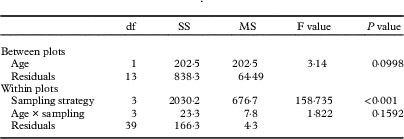
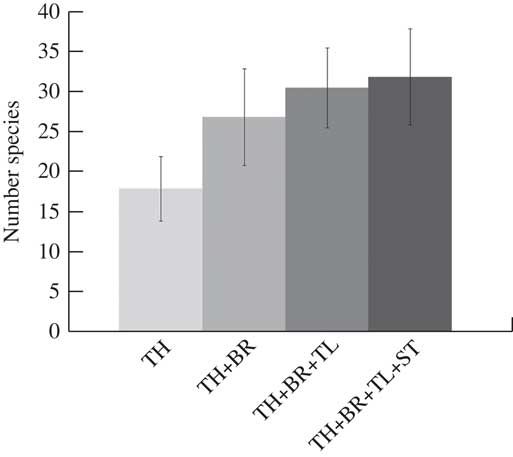
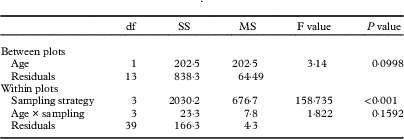
In total, 97 lichen taxa were recorded with non-probabilistic floristic sampling and 92 with standardized sampling methods. Mean species richness per plot was significantly different between non-probabilistic floristic sampling (37·7±5·8) and standardized sampling (32±5·8) (P<0·001). The highest mean number of species per plot was found on tree trunks (23·3±5·11) followed by fallen branches and stumps (13·1±3·76 and 6·40±2·38 respectively). The mean number of species recorded with non-probabilistic floristic sampling increased significantly with increasing stand age (P<0·05): 33·4±7·83 in young stands, 37·6±6·54 in intermediate stands, and 41±3·39 in older stands. Irrespective of stand age, the additional sampling of three currently neglected microhabitats in lichen monitoring surveys (i.e. fallen branches (BR), base of the trunk (TL) and stumps (ST)) increased species richness capture (Fig. 1). Adding only fallen branches led to a steep increase in species capture (51%) while the subsequent addition of the lower part of the trunks and stumps increased the recorded species richness by 21% and 8%, respectively. The results of the linear mixed model analyses showed that estimates of richness differed between sampling approaches regardless of stand age (Table 1). The survey of the plot by one person identifying/collecting the specimens and one person making notes/records lasted c. 3–6 hours. The oldest stands were the most time-consuming.
Plot level species richness recorded in standard sampling of tree trunks (TH) and incremental increases in species richness when neglected habitats are incorporated into surveys. BR=fallen branches; TL=base of trunks; ST=stumps. Mean values (n=15) are plotted±1 SE.
The effect of stand age and sampling strategy on lichen species richness using linear mixed models
Species composition
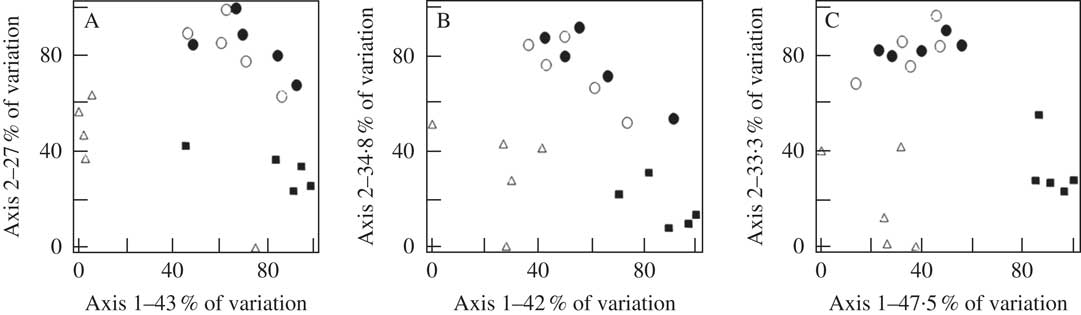
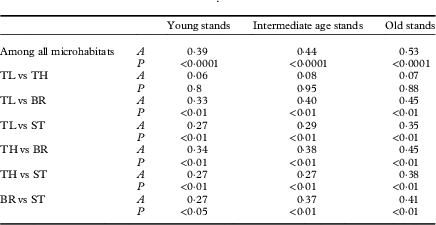
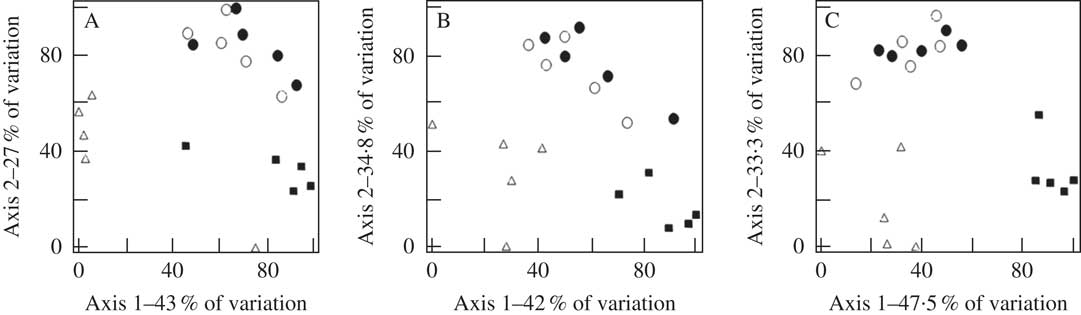
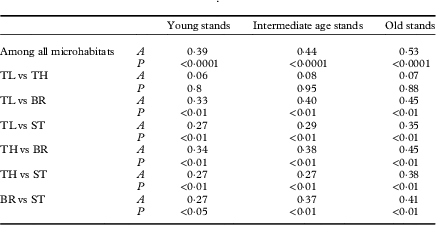
In each stand age class, significant differences in species composition were found among trees, fallen branches and stumps (Table 2). These differences increased with stand age, as indicated by the increasing A values from young to old stands. In contrast, communities at the base and at 100–150 cm on the trunks did not differ in species composition. This result was consistent across stand age classes. Overall, MRPP results were corroborated by the visual interpretation of the NMDS ordinations (Fig. 2A–C). For each stand age a final 2-dimensional solution was selected (young=stress 11%, instability 0·00001; intermediate age=stress 14·5%, instability 0·00021; old=stress 10·8%, instability 0·00001). For young stands the two axes accounted for 70% of the total variation in species composition, for intermediate age stands 76·8%, and for old stands 80·8%.
Non-metric multidimensional scaling (NMDS) ordination plots for lichen species composition in four microhabitats and three stand age classes. A, 60–90 years old; B, 110–130 years old; C, 150–180 years old. Microhabitats: closed circles=between 100–150 cm on the tree trunks; open circles=base of the tree trunks; closed square=fallen branches; open triangle=stumps.
Summary results from multi-response permutation procedures (MRPP) carried out on the lichen species composition in four microhabitat types and three stand age classes of Fagus orientalis. MRPP was used to test differences both between pairs of microhabitat types and among all four microhabitats. All data are included in the analysis considering all the four microhabitats while for pairwise comparisons between microhabitats only the relevant subsets of data are used. The test statistic A in MRPP describes the separation between microhabitat types and P values indicate its significance level. TL=base of the tree trunks; TH=between 100–150 cm on the tree trunks; BR=fallen branches; ST=stumps available in the plot
In accordance with the NMDS ordinations (Fig. 2A–C), the main pattern expressed along axis 1 is that related to compositional differences among assemblages recorded on fallen branches and stumps. However, assemblages on these two microhabitats clearly separated from those recorded on trees, as indicated by the pattern expressed along axis 2. This compositional difference between trees and the other two microhabitats was most evident in the old stands (Fig. 2C). On the other hand, assemblages recorded at the base of the trunk and at 100–150 cm above the ground strongly overlapped in the species space, indicating similar community composition.
Discussion
Our results demonstrate that the inclusion in CEN standardized sampling procedures (European Standard EN 16413:2014) of stumps and fallen branches in addition to tree trunks increases the effectiveness of lichen monitoring procedures in estimating lichen diversity. On one hand, our findings indicate that the inclusion of the basal parts of the trunks only slightly increases species capture at the plot level. This result could be habitat-dependent and would require further tests in other forest types. However, similar findings were found by Nascimbene & Marini (Reference Nascimbene and Marini2015) exploring lichen diversity in spruce forests of the Alps along elevational gradients. On the other hand, the survey of fallen branches results in the highest increase of species capture, confirming previous findings addressing the flaws of lichen diversity estimates that do not include the canopy microhabitat (Boch et al. Reference Boch, Müller, Prati, Blaser and Fischer2013; Marmor et al. Reference Marmor, Tõrra, Saag, Leppik and Randlane2013). When fallen branches are accounted for, the further inclusion of stumps adds only a moderate contribution indicating that most of the species could be recorded on trunks and fallen branches. The positive effect in terms of species capture of surveying currently neglected microhabitats, such as basal parts of the trunks, fallen branches, and stumps, are consistent across stand age classes. This indicates that the adoption of improved monitoring procedures that include these microhabitats would produce consistent results across forests of different ages, allowing comparisons across successional stages.
Except for the basal part of the trunks, the increase in plot-level species richness values corresponding to the inclusion of an increasing number of microhabitats is related to differences in species composition that are consistent across the gradient of stand age. This suggests that the inclusion of currently neglected microhabitats in standardized monitoring procedures would improve the chance of evaluating lichen patterns by simultaneously considering the response of different sub-communities indicative of different stand-related factors (Ellis Reference Ellis2012). This pattern is particularly evident for older stands, where the compositional differences among trunks, fallen branches and stumps are more evident than in younger stands. This probably reflects a pattern of increasing substratum specialization of lichen communities with stand aging (Lie et al. Reference Lie, Arup, Grytnes and Ohlson2009; Nascimbene et al. Reference Nascimbene, Marini, Motta and Nimis2009; Ellis Reference Ellis2012). However, inclusion of the additional microhabitats would also increase the duration of the plot sampling procedures by 1–2 hours.
Despite the fact that standardized sampling procedures allowed us to record c. 95% of the overall species recorded by non-probabilistic floristic sampling, plot-level richness values differed between the two strategies, indicating that non-probabilistic floristic survey could allow the recording of a higher number of species. However, standardized sampling procedures that include tree trunks, fallen branches and stumps could represent a reasonable trade-off between exhaustiveness and cost-effectiveness (McCune & Lesica Reference McCune and Lesica1992). Moreover, standardized sampling procedures would allow higher reproducibility and comparability of results that are indispensable for long-term monitoring programmes based on data comparisons over time. We are aware that the relatively small sampling size and the inclusion of one forest type in our sampling design could hinder the general applicability of our results. However, we feel that the results of this pilot study could stimulate further tests with larger sample sizes and including different forest types across Europe.
AG is grateful to Dr Karen Manvelyan (WWF-Armenia), Mr Vasil Chilingaryan (Director) and other staff members of the Noyemberyan Forest Enterprises of the “Hayantar” SNCO for assistance in the organization of fieldwork, and for financial support from the DAAD (German Academic Exchange Service) and the project “Developing Tools for Conserving the Plant Diversity of the Transcaucasus” financed by the Volkswagen Foundation. AG and JN are grateful to Professor Pier Luigi Nimis (Italy) for his assistance. AG also thanks Professor Mark Seaward (United Kingdom) for improving the English language of the manuscript.