Introduction
Dental-microwear features are the consequences of occlusal events involving mastication of hard, abrasive, or tough particles that damage enamel surfaces, causing wear (Lucas et al. Reference Lucas, Omar, Al-Fadhalah, Almusallam, Henry, Michael, Thai, Watzke, Strait and Atkins2013; Ungar Reference Ungar2015; Xia et al. Reference Xia, Zheng, Huang, Tian, Chen, Zhou and Ungar2015). As dental wear progresses throughout life, microwear features wear away and are replaced by new microwear features. Consequently, the microwear on the occlusal surface of a tooth is largely a product of the last meal or the last few meals (Mainland Reference Mainland1996; Ungar Reference Ungar2009; Gogarten and Grine Reference Gogarten and Grine2013). This creates a considerable problem for the field of dental microwear. While some studies recognize that dental microwear is an ephemeral signal of feeding ecology (Rivals et al. Reference Rivals, Schulz and Kaiser2009, Reference Rivals, Takatsuki, Albert and Maciá2014; Merceron et al. Reference Merceron, Escarguel, Angibault and Verheyden-Tixier2010a; Gogarten and Grine Reference Gogarten and Grine2013; Rodríguez-Hidalgo et al. Reference Rodríguez-Hidalgo, Rivals, Saladie and Carbonell2016; Sánchez-Hernández et al. Reference Sánchez-Hernández, Rivals, Blasco and Rosell2016), most microwear studies attempt to answer questions about the feeding ecology of species, not individuals, and they do not explicitly consider the possibility that the actual specimens under study may have suffered diet-altering ecological stress shortly before death resulting from drought, parasitism, disease, malnutrition, starvation, or a variety of other ecological phenomena that decrease longevity. In most instances, we have very limited understanding of the cause of death of fossil specimens. However, except in circumstances under which animals died suddenly from predation, drowning, lethal injury, or other sudden causes of death, the possibility that dental microwear has been altered by near-mortal ecological stress should be a concern when interpreting dental-microwear results.
Our understanding of the relationship of dental wear and feeding ecology in nature comes from large extant mammal databases derived from modern specimens in mammalogy collections. These collections consist mostly of specimens collected directly from the wild (e.g., hunting, trapping) (Solounias and Semprebon Reference Solounias and Semprebon2002; Merceron et al. Reference Merceron, Blondel, Brunet, Sen, Solounias, Viriot and Heintz2004, Reference Merceron, Blondel, De Bonis, Koufos and Viriot2005; Fraser and Theodor Reference Fraser and Theodor2011). However, the fossil record does not sample individuals in an equivalent way. Fossil occurrences are likely to be biased toward particular sedimentological facies that represent localized depositional environments and preserve microwear patterns that reflect localized aspects of feeding ecology rather than the generalized ecology of species. Additionally, mortality rates of species living in seasonal environments fluctuate with the seasons, with higher rates of mortality during the more stressful times of year (Young Reference Young1994; Gogarten et al. Reference Gogarten, Brown, Chapman, Cords, Doran-Sheehy, Fedigan, Grine, Perry, Pusey, Sterck, Wich and Wright2012; Taylor et al. Reference Taylor, Beck and Huzurbazar2016). Therefore, biased dental-microwear data may be more prevalent in the fossil record than has been generally surmised.
Mesowear analysis is another dental-wear proxy applicable to ungulate mammals that relates the relief and sharpness of worn cusp apices to the relative amounts of abrasive (food on tooth) and attritive (tooth on tooth) wear (Fortelius and Solounias Reference Fortelius and Solounias2000; Kaiser et al. Reference Kaiser, Müller, Fortelius, Schulz, Codron and Clauss2011; Louys et al. Reference Louys, Meloro, Elton, Ditchfield and Bishop2011; Mihlbachler et al. Reference Mihlbachler, Rivals, Solounias and Semprebon2011). While microwear represents last meals, a more extensive amount of dental wear is required to reshape the gross morphology of a cusp. Therefore, mesowear is the culmination of many successive meals and represents feeding ecology over a period of time that is longer than that represented by microwear. A mesowear-derived dietary interpretation of a sample of individuals that experienced near-death shifts in feeding ecology would very likely be incongruous with conclusions achieved via microwear analysis.
It has become commonplace to publish paleodietary studies that combine microwear and mesowear. Some studies either reported no disagreement between these proxies or did not comment on the extent of congruence (DeMiguel et al. Reference DeMiguel, Fortelius, Azanza and Morales2008, Reference DeMiguel, Azanza and Morales2011; Semprebon and Rivals Reference Semprebon and Rivals2007, Reference Semprebon and Rivals2010; Rivals et al. Reference Rivals, Schulz and Kaiser2009, Reference Rivals, Rindel and Belardi2013; Merceron et al. Reference Merceron, Kaiser, Kostopoulos and Schulz2010b; Rivals and Semprebon Reference Rivals and Semprebon2012; Tütken et al. Reference Tütken, Kaiser, Vennemann and Merceron2013). However, many studies report some amount of disagreement between mesowear and microwear (Franz-Odendaal and Solounias Reference Franz-Odendaal and Solounias2004; Rivals et al. Reference Rivals, Solounias and Mihlbachler2007, Reference Rivals, Schulz and Kaiser2008, Reference Rivals, Mihlbachler, Solounias, Mol, Semprebon and de Vos2010, Reference Rivals, Solounias and Schaller2011; Schulz et al. Reference Schulz, Fahlke, Merceron and Kaiser2007; Wolf et al. Reference Wolf, Nelson, Schwartz, Semprebon, Kaiser and Bernor2010; Semprebon et al. Reference Semprebon, Rivals, Solounias and Hulbert2016). Incongruence between these dental-wear proxies does not indicate that either method is flawed. Mesowear and microwear have both been amply demonstrated to accurately predict dietary ecology in modern ungulates (Fortelius and Solounias Reference Fortelius and Solounias2000; Fraser and Theodor Reference Fraser and Theodor2011; Louys et al. Reference Louys, Ditchfield, Meloro, Elton and Bishop2012; Mihlbachler et al. Reference Mihlbachler, Campbell, Ayoub, Chen and Ghani2016). More likely, ecological pressure, proximate to the time of death, may frequently disassociate these two wear proxies. Contrast between these two dental-wear proxies could be informative of both short-term dietary fluctuations due to seasonal mixed feeding and episodes of ecological stress in the fossil record.
If the feeding ecology of a species fluctuated seasonally and/or spatially over the home range, sampling biases in the fossil record would dictate the degree of congruence between microwear and mesowear results. If a fossil sample consisted of individuals sampled from a population over an extended period of time over an extended area, the microwear data would reflect the total range of that population’s feeding activities, which could include feeding in a variety of seasons and feeding environments (Rivals et al. Reference Rivals, Prignano, Semprebon and Lozano2015; Rodríguez-Hidalgo et al. Reference Rodríguez-Hidalgo, Rivals, Saladie and Carbonell2016; Sánchez-Hernández et al. Reference Sánchez-Hernández, Rivals, Blasco and Rosell2016). Conclusions reached about general aspects of feeding ecology from microwear data would be congruent with mesowear. A sample of the same population taken at one locality during a temporally constrained period of ecological stress would result in greater incongruence between mesowear and microwear. Microwear would relate more strongly to the spatially and temporally localized conditions, while mesowear would more strongly relate to generalized aspects of diet.
Bone beds often contain evidence of mass deaths due to ecological stress (Lyman Reference Lyman1994; Rogers et al. Reference Rogers, Eberth and Fiorillo2007). Such assemblages provide opportunities to test for dental-wear bias in the fossil record. Rhinocerotids and other large megaherbivorous species are commonly found in mass-death assemblages and other bone-bed deposits. Rhinocerotid mass-death assemblages range from time-averaged mortality, to drought-induced seasonal die-offs, to other haphazard events, including volcanic ashfall. In mass-death assemblages, we might expect a higher frequency of microwear–mesowear incongruence due to near-death dietary shifts related to ingestion of more abrasive, tougher, or less nutritious food items and/or increased ingestion of food contaminants (dust, sand, soil, ash).
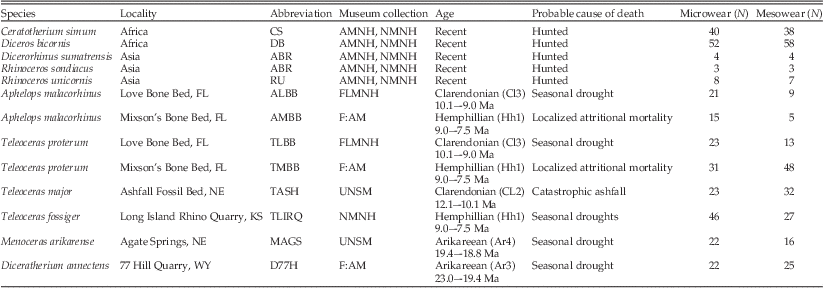
We sampled microwear and mesowear from 13 modern and fossil rhino assemblages. Rhinocerotids, among all megaherbivorous ungulate clades, are suited to address these concerns with dental-wear methods. Fossil rhinocerotids commonly occur in concentrated bone-bed deposits in North America, and there are many fossilized mass-death assemblages whose dental-wear patterns can be compared with hunted collections of extant species. Extant rhinocerotids are the only living family of megaherbivores whose diets span the browser–grazer spectrum with both specialized browsing and grazing species (Owen-Smith Reference Owen-Smith1988). This study includes all five extant rhinocerotid species, all wild-collected over different times of year from African and Asian localities. The modern rhino assemblages were mostly collected during expeditions in the early twentieth century (Heller Reference Heller1913). The rhinos represented in the modern rhino assemblages were hunted over a period of years and during several seasons. Documentation of some of these hunting exploits (Heller Reference Heller1913; Roosevelt and Heller Reference Roosevelt and Heller1914) suggest the hunted animals were not exposed to extreme ecological events prior to death. If that is the case, both mesowear and microwear in these modern assemblages should correspond closely to the feeding ecology of these species as reported in the literature.
Because the mortalities of the modern specimens are not associated with exposure to extreme ecological events, we hypothesize a high degree of congruence between microwear and mesowear. The dental microwear on the labial edge of perissodactyl molars is strongly predictive of feeding ecology among browsing and grazing rhinos, while the dental microwear from the lingual edge is not (Mihlbachler et al. Reference Mihlbachler, Campbell, Ayoub, Chen and Ghani2016). Therefore, we hypothesize a stronger relationship between mesowear and labially distributed microwear among extant rhinos. Because the fossil assemblages, whose causes of death are described below and summarized in Table 1, are associated with taphonomic evidence for mass-death events, we hypothesize the fossil assemblages will be characterized by less microwear–mesowear congruence than the largely hunted modern samples.
Summary of rhinocerotid modern and mass-death fossil-assemblage data and cause-of-death hypotheses. Dicerorhinus sumatrensis and Rhinoceros sondiacus are combined in this study as Asian browsing rhinos (ABR). Museum collections: AMNH, American Museum of Natural History, New York; F:AM, Frick Collection at the American Museum of Natural History, New York; FLMNH, Florida Museum of Natural History, Gainesville, FL; NMNH, National Museum of Natural History, Washington, D.C.; UNSM, University of Nebraska State Museum, Lincoln, NE. N refers to the number of observations.

Feeding Ecology of Extant Rhinos
There are significant phylogenetic biases in how dental-microwear features are distributed on the molars of different ungulate groups (Mihlbachler et al. Reference Mihlbachler, Campbell, Ayoub, Chen and Ghani2016). Therefore, we depart here from the general approach of comparing dental wear of fossil species with taxonomically diverse extant mammal dental-wear data sets (Solounias and Semprebon Reference Solounias and Semprebon2002; Merceron et al. Reference Merceron, Blondel, Brunet, Sen, Solounias, Viriot and Heintz2004, Reference Merceron, Blondel, De Bonis, Koufos and Viriot2005; Semprebon et al. Reference Semprebon, Godfrey, Solounias, Sutherland and Jungers2004) and confine our analysis to comparisons of extant and extinct rhinocerotids. It is important to review the feeding ecology of the extant species of rhinos before discussing the results of the mesowear and microwear data.
All dietary studies of Ceratotherium simum (CS) indicate a nearly pure grass diet. Stable isotopes of fecal material suggest 90% of its diet consists of C4 grasses (Codron et al. Reference Codron, Codron, Lee-Thorp, Sponheimer, De Ruiter, Sealy, Grant and Fourie2007). It preferentially grazes on short grass, which it crops with a square upper lip (Player and Feely Reference Player and Feely1960; Groves Reference Groves1972; Owen-Smith Reference Owen-Smith1975, Reference Owen-Smith1988; Pienaar Reference Pienaar1994; Shrader and Perrin Reference Shrader and Perrin2006; Shrader et al. Reference Shrader, Owen-Smith and Ogutu2006; Waldram et al. Reference Waldram, Bond and Stock2008; Pedersen Reference Pedersen2009). CS acts as a keystone species, maintaining short grassy lawns (Waldram et al. Reference Waldram, Bond and Stock2008; Arsenault and Owen-Smith Reference Arsenault and Owen-Smith2011; Kleynhans et al. Reference Kleynhans, Jolles, Bos and Olff2011; Rookmaaker Reference Rookmaaker2013). Heller (Reference Heller1913) examined the stomach contents of hunted specimens that are used in this study and found them to contain only grass.
Diceros bicornis (DB) is a browser that feeds extensively on shrubs, herbs, legumes, woody plants, and other succulent plants using a prehensile upper lip (Ritchie Reference Ritchie1963; Goddard Reference Goddard1968, Reference Goddard1970; Schenkel and Schenkel-Hulliger Reference Schenkel and Schenkel-Hulliger1969a; Joubert and Eloff Reference Joubert and Eloff1971; Mukinya Reference Mukinya1977; Hall-Martin et al. Reference Hall-Martin, Erasmus and Botha1982; Loutit et al. Reference Loutit, Louw and Seely1987; Owen-Smith Reference Owen-Smith1988; Oloo et al. Reference Oloo, Brett and Young1994; Dudley Reference Dudley1997; Muya and Oguge Reference Muya and Oguge2000; Brown et al. Reference Brown, Lent, Trollope and Palmer2003; Lieverloo et al. Reference Lieverloo, Schuiling, Boer, Brown and Prins2009; Luske et al. Reference Luske, Mertens, Lent, de Boer and Prins2009; Buk and Knight Reference Buk and Knight2010). DB can break branches up to 17 cm in diameter (Goddard Reference Goddard1968; Owen-Smith Reference Owen-Smith1988), although most browsed twigs are less than 3.5 mm in diameter (Owen-Smith Reference Owen-Smith1988; Lieverloo et al. Reference Lieverloo, Schuiling, Boer, Brown and Prins2009). Stable isotopic analyses of feces suggest about 9% of its diet is C4 grass, suggesting that DB may eat more grass than other studies indicate (Codron et al. Reference Codron, Codron, Lee-Thorp, Sponheimer, De Ruiter, Sealy, Grant and Fourie2007), but confirm that it is overwhelmingly a browser.
Two of the three species of Asian rhino, Rhinoceros sondiacus (RS) and Dicerorhinus sumatrensis (DS) (combined in this study as ABR: Asian browsing rhinos) are browsers. RS eats leaves, shoots, and twigs of woody species, which it grabs with a prehensile upper lip. It consumes little to no grass and few herbaceous species (Schenkel and Schenkel-Hulliger Reference Schenkel and Schenkel-Hulliger1969b; Hoogerwerf Reference Hoogerwerf1970; Amman Reference Amman1985; Owen-Smith Reference Owen-Smith1988; Groves and Leslie Reference Groves and Leslie2011). DS ingests stems and leaves of broadleaf herbs, shrubs, and trees and fruits (Strickland Reference Strickland1967; Groves and Kurt Reference Groves and Kurt1972; Groves Reference Groves1982; van Strien Reference van Strien1986; Owen-Smith Reference Owen-Smith1988).
Rhinoceros unicornis (RU) is the only extant mixed-feeding rhinoceros (Owen-Smith Reference Owen-Smith1988; Dinerstein Reference Dinerstein2003). Its diet consists of tall and short grasses, shrubs, herbs, leaves, twigs, bark, aquatic plants, and fruits (Laurie Reference Laurie1982; Laurie et al. Reference Laurie, Lang and Groves1983; Dinerstein and Wemmer Reference Dinerstein and Wemmer1988; Dinerstein and Price Reference Dinerstein and Price1991; Fjellstad and Steinheim Reference Fjellstad and Steinheim1996; Mary et al. Reference Mary, Solanki, Limboo and Upadhaya1998; Deka et al. Reference Deka, Sarma and Baruah2003; Bhatta Reference Bhatta2011; Sarma et al. Reference Sarma, Mipun, Talukdar, Singha, Basumatary, Das, Sarkar and Hazarika2012). Its spends the majority of its time in wet alluvial grasslands dominated by a tall floodplain grass, Saccharum spontaneum, which is the most abundant plant in its diet at all times of year and in all populations (Laurie Reference Laurie1982; Laurie et al. Reference Laurie, Lang and Groves1983; Dinerstein and Price Reference Dinerstein and Price1991; Jnawali and Wegge Reference Jnawali and Wegge1991; Dinerstein Reference Dinerstein1992, Reference Dinerstein2003; Fjellstad and Steinheim Reference Fjellstad and Steinheim1996; Mary et al. Reference Mary, Solanki, Limboo and Upadhaya1998; Deka et al. Reference Deka, Sarma and Baruah2003; Steinheim et al. Reference Steinheim, Wegge, Fjellstad, Jnawali and Weladji2005; Wegge et al. Reference Wegge, Shrestha and Moe2006; Kandel and Jhala Reference Kandel and Jhala2008; Pradham et al. Reference Pradham, Wegge, Moe and Shrestha2008; Sarma et al. Reference Sarma, Mipun, Talukdar, Singha, Basumatary, Das, Sarkar and Hazarika2012; Tripathi Reference Tripathi2012). The amount of grass reported in its diet ranges from 60% to 90%. In the warm/wet season, grass is the most dominant component (86–92%) of its diet and in the cool/dry season, grass consumption is reportedly as low as 57–42% (Jnawali Reference Jnawali1995; Wegge et al. Reference Wegge, Shrestha and Moe2006; Tripathi Reference Tripathi2012).
Rhino Assemblages and Cause-of-Death Scenarios
The fossil assemblages studied here represent four rhinocerotid genera, Diceratherium, Menoceras, Aphelops, and Teleoceras Reference Mead, all prominent members of North American Miocene land mammal faunas (Prothero Reference Prothero2005). Diceratherium and Menoceras are early Miocene rhinocerotids that lived before grasslands were widespread in North America (Strömberg Reference Strömberg2005, Reference Strömberg2011; Edwards et al. Reference Edwards, Osborne, Strömberg and Smith2010; McInerney et al. Reference McInerney, Strömberg and White2011; Feranec and Pagnac Reference Feranec and Pagnac2013). Based on their brachydont molars, it would be uncontroversial to hypothesize that they were browsers. Aphelops and Reference Mead Teleoceras were abundant in the middle and late Miocene of North America, a time period during which open grasslands were spreading in North America. Aphelops is classically considered a browser and Reference Mead Teleoceras a grazer (Cerdeno Reference Cerdeno1998; Prothero Reference Prothero1998; Janis Reference Janis2008). Aphelops had comparatively low-crowned molars, a larger body size, and a posteriorly retracted nasal bone, possibly suggesting a short proboscis or some other type of highly mobile upper lip. These traits suggest a browsing diet. Teleoceras Reference Mead, on the other hand, evolved high-crowned molars and shortened limbs, suggesting grazing habits. Results of a prior dental-microwear study of Reference Mead Teleoceras fossiger and Aphelops mutilis suggest either browsing or mixed feeding (Fraser and Theodor Reference Fraser and Theodor2013). Stable isotope studies suggest Reference Mead Teleoceras diets ranged from pure C3 to mixed C3 and C4 diets (Clementz et al. Reference Clementz, Holroyd and Koch2008; DeSantis and Wallace Reference DeSantis and Wallace2008). Following the expansion of C4 grass in Florida after 7 Ma (MacFadden and Cerling Reference MacFadden and Cerling1996; MacFadden Reference MacFadden1998), where grazing and browsing diets are isotopically widely differentiated, Reference Mead Teleoceras was a mixed feeder with a range of carbon isotopic values suggesting about 60% C4 grass, while Aphelops was a C3 browser (MacFadden Reference MacFadden1998).
Bone beds containing these extinct rhino species have varied taphonomic histories that provide important clues about the causes and durations of the death events. The North American fossil rhino assemblages used in this study were sampled from six densely concentrated bone beds from the continental interior (Nebraska, Kansas, Wyoming) and Florida. Evidence supporting the probable causes of death for each fossil assemblage (Table 1) is summarized below.
Agate Springs
Volcaniclastic sediments of the early Miocene Arikaree group include tuffaceous waterhole muds that accumulated in abandoned stream channels that are the locus for major mammalian bone beds, including the famous Agate Springs bone bed in Nebraska and the lesser known 77 Hill Quarry of Wyoming (Hunt Reference Hunt1990). Agate Springs contains a death assemblage consisting of disarticulated skeletons of the small horned rhinocerotid Menoceras arikarense. Deaths occurred in an abandoned stream channel, and the skeletons were buried by renewed aggradation of fine volcaniclastics due to subsequent heavy rains. Hunt (Reference Hunt1990) suggested the assemblage was caused by a drought-induced death event in a seasonally dry climate. Mortality profiles of Menoceras collected from more attritional interchannel sites of the Arikaree group are reportedly different from that of Agate Springs, suggesting a strong catastrophic mortality component to the Agate Springs assemblage (Hunt Reference Hunt1990). Although the assemblage has a balanced sex ratio, the age structure of the assemblage contains different male and female mortality profiles (Mihlbachler Reference Mihlbachler2007). The males, identified via prominent tusk and horn sexual dimorphism, more commonly died as young adults, and the females were frequently older adults. This aspect of the demographic structure resembles the natural age structure of living rhino populations (Mihlbachler Reference Mihlbachler2007). The total evidence suggests a semicatastrophic mass death event (catastrophic mortalities mixed with some background attritional mortality) that disrupted a demographically normally structured rhinocerotid population (Mihlbachler Reference Mihlbachler2007).
The 77 Hill Quarry
The 77 Hill Quarry bone bed of Wyoming contains a dense accumulation of another small early rhinocerotid, Diceratherium annectens. The taphonomy of this assemblage is not as thoroughly studied but represents a shallow-waterhole setting nearly identical to that of Agate Springs. Mortality profiles of the two assemblages are similar (Hunt Reference Hunt1990), suggesting that the 77 Hill assemblage is also a similar kind of mass-death event.
Ashfall Bone Bed
The Ashfall Bone Bed of Nebraska contains a large catastrophic death assemblage of articulated Reference Mead Teleoceras major skeletons buried in pure volcanic ash within an abandoned fluvial channel (Voorhies Reference Voorhies1985). The carcasses were deposited above the level of the primary air-fall layer within the ash bed. Rhinos exhibit bone pathologies associated with ash inhalation and asphyxiation, suggesting that the animals died after surviving the initial ashfall and were quickly buried by reworked ash after death (Tucker et al. Reference Tucker, Otto, Joeckel and Voorhies2014). The age and sex structure of the Ashfall rhino assemblage, consisting mostly of juveniles and adult females with fewer numbers of adult males (Mead Reference Mead2000), is a demographic pattern that resembles a snapshot of a standing population of living rhinos rather than an attritional death assemblage (Mihlbachler Reference Mihlbachler2003) and is therefore congruent with taphonomic evidence suggesting a localized mass-death event occurring over a short interval of time following prolonged exposure to what would have been an extremely unusual and stressful ecological event.
Long Island Rhino Quarry
From 1884 to 1886 Charles Sternberg and John Bell Hatcher made extensive collections of Reference Mead Teleoceras fossiger from the Long Island Rhino Quarry in Phillips County, Kansas (Osborn Reference Osborn1898a,Reference Osbornb). Hatcher’s (Reference Hatcher1885) field notes describe a dense rhinoceros bone bed contained in a horizontal stratum of loose sand overlying a more compact layer of clay and calcareous sandstone some 2 or 3 feet in thickness. There are two fossil-bearing strata containing dense concentrations of rhinoceros bone, separated by 1 to 3 feet of unfossiliferous strata that may possibly represent two discrete death events. If there were two separate death events, the fossils from each event have been hopelessly mixed. The state of preservation of the material and Hatcher’s drawings of excavation units suggest disarticulation, although the absence of strong weathering and fine degree of preservation indicate rapid burial without transportation or winnowing (Osborn Reference Osborn1898a,Reference Osbornb). The state of preservation and the demographic structure of the sample, which is composed primarily of young individuals and females with few males (Mead Reference Mead2000), resembles the catastrophic Ashfall sample and suggests a mass-death event or two mass-death events followed by reworking and, finally, rapid burial by subsequent depositional events in a fluvial channel.
Love Bone Bed
The Love Bone Bed from Florida is a large multispecific bone bed originating from yet another fluvial depositional (cut and fill) event (Webb et al. Reference Webb, MacFadden and Baskin1981). The deposit contains large assemblages of both Reference Mead Teleoceras proterum and Aphelops malacorhinus, although Reference Mead Teleoceras is more abundant (Mihlbachler Reference Mihlbachler2003, Reference Mihlbachler2005). Age clusters in the Reference Mead Teleoceras assemblage suggest births and localized deaths were seasonal (Mihlbachler Reference Mihlbachler2003). The clustering could be due to a single seasonally constrained die-off event or a series of seasonally coordinated die-off events due to annual droughts or because the animals migrated seasonally and were only present at the locality during a small portion of the year. Either scenario suggests a highly seasonal environment and that rhinos preserved in the bone bed died in a particular season. The Reference Mead Teleoceras assemblage has a supernumerary abundance of young adult and subadult males, suggesting that some mortalities may have been socially mediated (due to fighting, territoriality) rather than purely drought induced (Mihlbachler Reference Mihlbachler2003). Therefore, the Love Bone Bed assemblages may contain mixtures of seasonally constrained attritional and catastrophic deaths.
Mixson’s Bone Bed
The final bone bed, Mixson’s Bone Bed in Florida, most closely resembles an ideal attritional death assemblage. Rhinos are the most abundant animals in the bone bed, although other large mammals are represented (Leidy and Lucas Reference Leidy and Lucas1896). The most abundant rhino is Reference Mead Teleoceras proterum, but Aphelops malacorhinus is common (Harrison and Manning Reference Harrison and Manning1983; Mihlbachler Reference Mihlbachler2003, Reference Mihlbachler2005). The fossils were contained in clay deposited in a shallow sinkhole resulting from karstification of the underlying Eocene Ocala Limestone, which experienced active deposition for a brief interval (Harrison and Manning Reference Harrison and Manning1983). The large Reference Mead Teleoceras assemblage contains excessive numbers of subadult and young adult males; this demographic bias is strongest at Mixson’s (Mihlbachler Reference Mihlbachler2003) suggesting that the vast majority of the deaths were socially mediated and less likely related to drought or other types of ecological distress. Discrete age clusters were not found in the Reference Mead Teleoceras assemblage, indicating that deaths were aseasonal, births were aseasonal, or possibly both. This locality appears to contain an attritional record of localized mortality, with deaths occurring over a prolonged interval of time (Mihlbachler Reference Mihlbachler2003), and among all the fossil assemblages may have a degree of microwear–mesowear congruence resembling the modern assemblages.
Materials and Methods
Specimen Selection
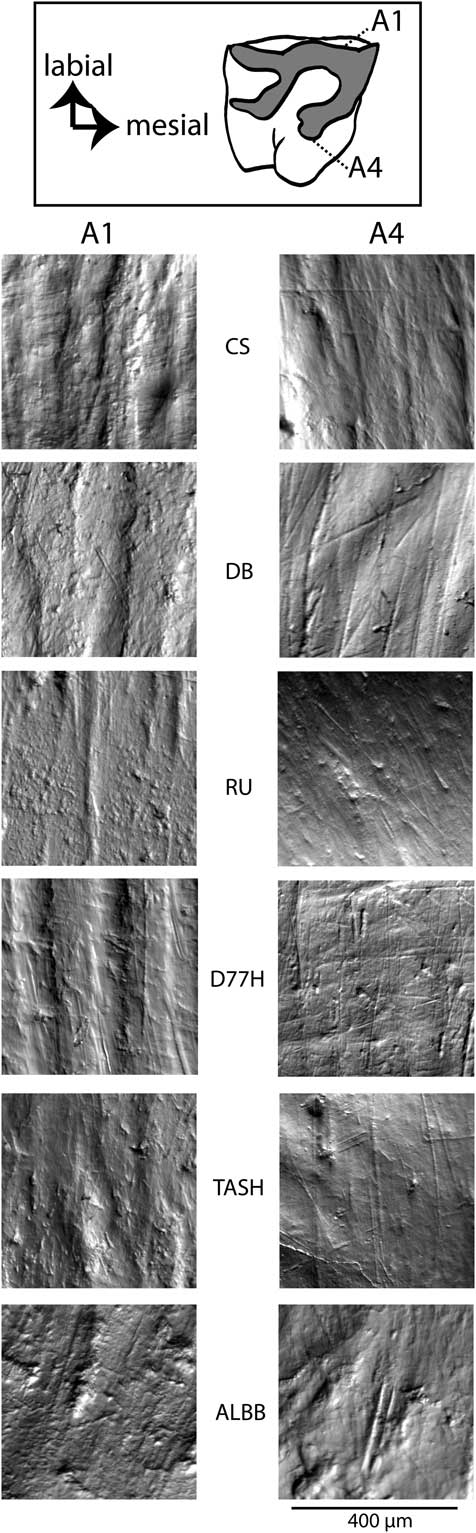
Specimens used in this study are housed in public museum collections and available for additional study. Individual specimen numbers, localities, and raw data are provided in Supplementary Material 1. For both microwear and mesowear, upper second molars (M2) were prioritized for sampling. Adjacent molars (M1 or M3) were selected in instances where the M2 could not be sampled due to extensive wear, nonpreservation, or postmortem damage. The included specimens conform to wear stages 6–7 (Taylor et al. Reference Taylor, Kaiser, Schwitzer, Müller, Codron, Clauss and Schulz2013). Following common practice, young individuals with poorly developed wear facets and dentally senescent individuals were excluded from all dental-wear analyses. For microwear analysis, specimens showing signs of chemical weathering, postmortem abrasion, contamination with chemical residues, or other macroscopic postmortem damage were rejected (King et al. Reference King, Andrews and Boz1999; El-Zaatari Reference El-Zaatari2010). Specimens were also excluded when irregularities in the shape of the transparent cast undermined the desired lighting effects needed to bring a satisfactory amount of contrast on the cast wear surfaces. Incomplete and partially weathered teeth were included when at least one of the two sampling areas (A1 or A4) (Fig. 1) met the inclusion criteria. The entire microwear study comprises 536 photographs of wear surfaces on 310 specimens.
Labial (A1) and lingual (A4) areas of occlusal enamel surfaces sampled for microwear analysis of rhinocerotids (Mihlbachler et al. Reference Mihlbachler, Campbell, Ayoub, Chen and Ghani2016), and examples of microwear photomicrographs used in the study. Abbreviations for species identification are given in Table 1.

Because of their extreme rarity, few specimens of the two Asian browsing rhinos (Dicerorhinus sumatrensis and Rhinoceros sondiacus) are available. These were combined into a single Asian browsing rhino sample (ABR), as they have similar feeding ecologies.
Because mesowear examines macroscopic aspects of cusp shape, it is less sensitive than microwear to small amounts of weathering, postmortem abrasion, or chemical contamination. Mesowear is more sensitive to macroscopic forms of damage (e.g., cracking, broken cusp apices). Therefore, inclusion criteria for mesowear were nonidentical to the microwear inclusion criteria. Inclusion for mesowear analysis required complete preservation of the paracone cusp and the surrounding part of the ectoloph. Postmortem damage to rhinoceros cusp apices is common due to their size and weight; therefore, the mesowear study consisted of fewer (N=285) specimens compared with the microwear study.
Microwear Analysis
Methods of observer blind microwear analysis follow Mihlbachler et al. (Reference Mihlbachler, Beatty, Caldera-Siu, Chan and Lee2012b) with modifications to digital resolution following Mihlbachler and Beatty (Reference Mihlbachler and Beatty2012). We provide a brief summary here so the reader can understand basic aspects of the method, but molding, casting, photographic methods, and digital manipulations made to the images are described more completely in those references. Data produced using this method are capable of correctly predicting diets from individual molars of grazing and browsing ruminants with 91% accuracy (Mihlbachler et al. Reference Mihlbachler, Campbell, Ayoub, Chen and Ghani2016). This success rate is a good indication of the efficacy of the method for identifying dental-wear patterns that are known to be associated with diets.
Grayscale photomicrographs were taken on clear epoxy casts under a stereomicroscope with a Spot 4 megapixel camera, using white light reflected from a white surface positioned below the specimen. The original digital resolution of the images, in which each pixel represents 0.742 µm of tooth surface, was reduced to 20% of the original pixel density, with each pixel representing 3.702 µm of tooth surface, a resolution found to yield the lowest levels of observer error (Mihlbachler and Beatty Reference Mihlbachler and Beatty2012). Microwear variables were traced and labeled on the images in a 400 μm×400 μm (1.6×105 μm2) area using Adobe Illustrator. The four largest microwear variables defined by Mihlbachler et al. (Reference Mihlbachler, Beatty, Caldera-Siu, Chan and Lee2012b) were considered: wide scratches (width: ≥5 μm to ≤20 μm), very wide scratches (width: >20 μm), large pits (maximal diameter: ≥20 μm to ≤50 μm), and very large pits (maximal diameter: >50 μm). Smaller microwear features were ignored, because observer repeatability for these features was found to be low at all resolutions possible with this methodology (Mihlbachler and Beatty Reference Mihlbachler and Beatty2012). Data for these four variables are provided in the Supplementary Material. To reduce the number and complexity of statistical tests, the data were combined into a single scratch variable and a single pit variable. Earlier investigations with this same methodology (Mihlbachler and Beatty Reference Mihlbachler and Beatty2012; Mihlbachler et al. Reference Mihlbachler, Beatty, Caldera-Siu, Chan and Lee2012b) found that a basic bivariate (scratches vs. pit) approach sufficiently identified major differences in microwear patterns associated with diet (Fig. 2).
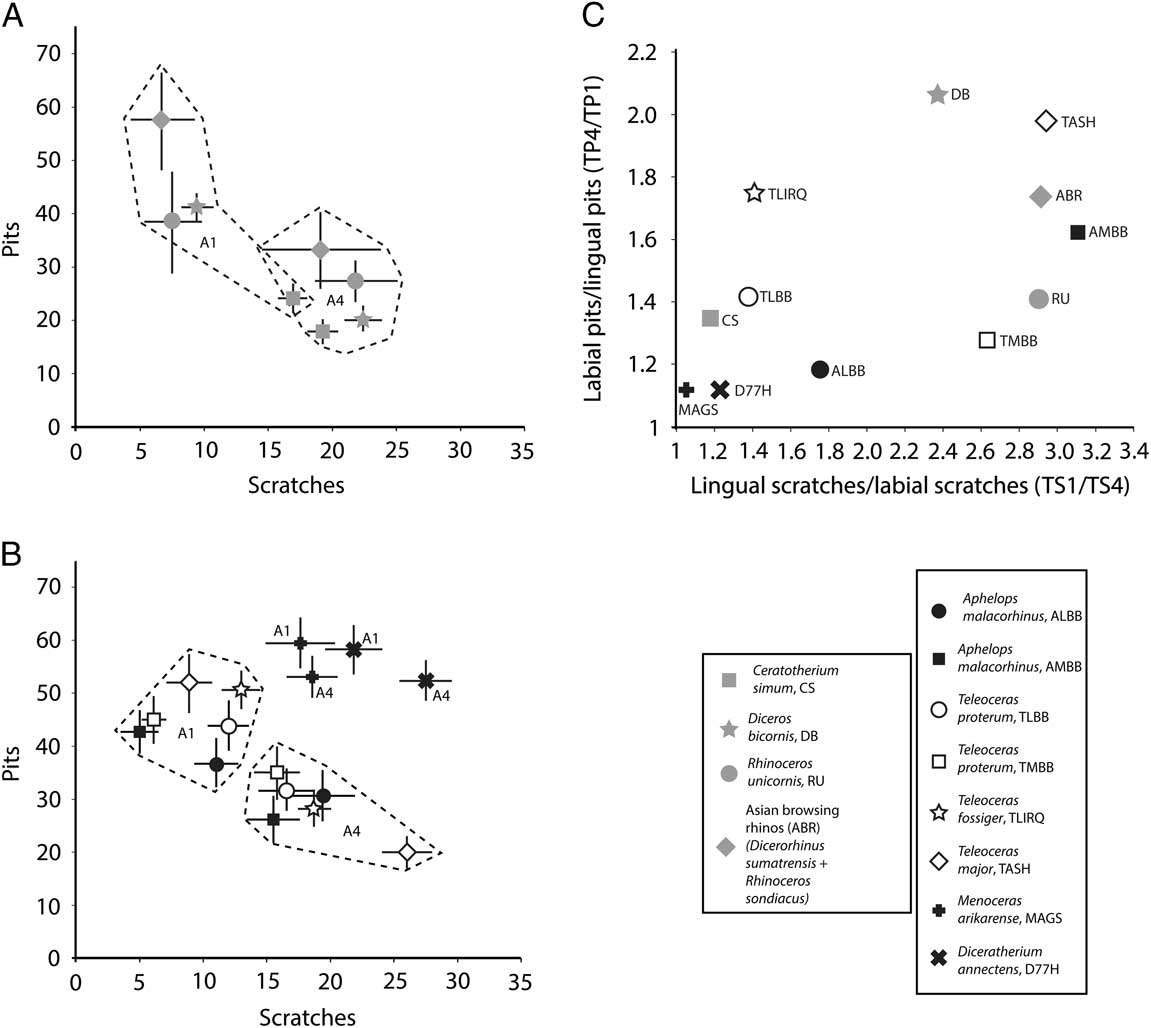
Means and SEs of labial (A1) and lingual (A4) dental microwear data for (A) extant species and (B) North American Miocene species. The dashed outlines in A and B surround labial and lingual microwear data. Figure C plots ratios of labially and lingually distributed pits and scratches and demonstrates the varying degrees of asymmetry in the distribution of pits and scratches on the labial and lingual sides of teeth. See Table 1 for abbreviations.

The images used in this study were randomized, so the single observer (M.C.M.) was blind to the taxon and the area of the tooth being sampled. Microwear was sampled in two areas of the occlusal enamel surface (Mihlbachler et al. Reference Mihlbachler, Campbell, Ayoub, Chen and Ghani2016), including the labial band of enamel of the paracone (A1) and the enamel surrounding the lingual margin of the protocone (A4) (Fig. 1). The series of images was examined three times, saving the superimposed tracings of pits and scratches each time. These additive examinations eliminate the diminishing effects of observer error by allowing the observer to identify features that were missed in earlier passes. By the third pass, very few additional microwear features were identified, suggesting that further passes would not substantially improve the data.
Mesowear Analysis
Rhinoceros mesowear has been studied with a variety of scoring methods (Kahlke and Kaiser Reference Kahlke and Kaiser2011), some involving multiple cusps (Taylor et al. Reference Taylor, Kaiser, Schwitzer, Müller, Codron, Clauss and Schulz2013) and photographic and morphometric techniques (Hernesniemi et al. Reference Hernesniemi, Blomstedt and Fortelius2011). The comparatively simple univariate mesowear method adopted here, developed for Equidae (Mihlbachler et al. Reference Mihlbachler, Rivals, Solounias and Semprebon2011), was chosen to maximize sample size and to simplify statistical comparison with microwear results. The “ruler” method is a reasonably robust and simple mesowear proxy that relies on use of a single homologous cusp. It is a way to collect simple mesowear data with minimal observer error (Mihlbachler et al. Reference Mihlbachler, Rivals, Solounias and Semprebon2011; Loffredo and DeSantis Reference Loffredo and DeSantis2014). Using the mesowear ruler composed of casts of seven equid cusps (Mihlbachler et al. Reference Mihlbachler, Rivals, Solounias and Semprebon2011), we assigned the paracones to seven mesowear stages ranging from 0 (sharp with high relief) to 6 (zero relief) (Fig. 3). Although the mesowear ruler was designed for use with equid teeth, it was relatively easy to adapt its use to rhinocerotids, as rhinos and horses show similar ranges of overall cusp relief and sharpness. Rhino teeth are larger than equid teeth, and so it is important to point out that cusps were scored according to cusp shape rather than absolute relief, since the latter is influenced by size. Data were scored by a single observer (M.C.M.).
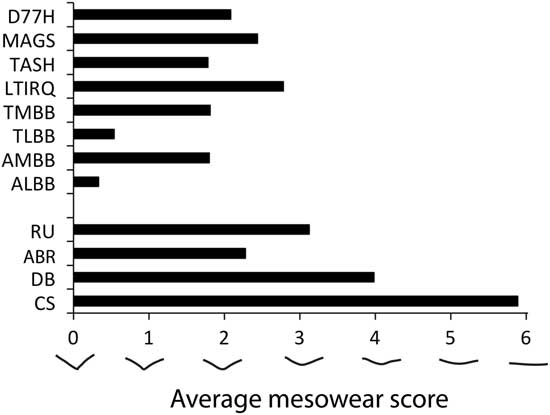
Average mesowear scores for M2 paracones. Species and assemblage abbreviations are given in Table 1.

Statistical Analysis
A parallel series of parametric and nonparametric analyses of the dental-microwear data were run, and no differences were found with regard to the results and conclusions of this paper. For brevity, we report only the parametric results. For examining the distributions of microwear features on rhino molars, the numbers of pits and scratches occurring on the labial (A1) and lingual (A4) sides of each molar were compared with paired t-tests. For testing for differences in the numbers of microwear features between different assemblages, analysis of variance (ANOVA) was run for each microwear variable. Tukey’s post hoc measures were used to determine which rhino assemblages more likely had significantly different microwear patterns.
Because mesowear data are categorical, nonparametric Mann-Whitney U-tests were used to test for differences in mesowear scores among the rhino assemblages. In comparing all 13 rhino assemblages, 66 Mann-Whitney U-tests were run.
Running large numbers of tests increases the chance of type I error (falsely rejecting the null hypothesis). A Bonferonni correction (p=0.001) can be used to minimize type I error, but at the cost of greatly increasing the probability of a type II error (incorrectly retaining the null hypothesis) (Perneger Reference Perneger1998). We report both the uncorrected and corrected results. However, due to the possibility of error in any individual test, we caution than patterns in the distribution of significant results among the data are more important than the results of any individual test.
Finally, we used a nonparametric Spearman’s rho test for correlation of mesowear scores and microwear variables. Because of different types of taphonomic damage, mesowear and microwear could not always be collected from the same specimens. These tests are based on a subset of 206 specimens (83 modern, 123 fossil) for which both mesowear and microwear were available
Results
Distribution of Dental-Microwear Features
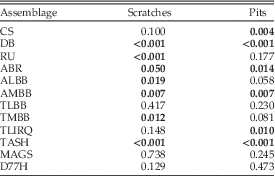
Extant perissodactyl microwear features have a distinct distribution, with more pits on the labial occlusal margin (A1) and more scratches on the lingual occlusal margin (A4) (Mihlbachler et al. Reference Mihlbachler, Campbell, Ayoub, Chen and Ghani2016). We found the same pattern in the majority of the rhino assemblages (Fig. 2A,B). For most assemblages, there were significant differences in the number of labially and lingually distributed scratches or pits, or significant differences among both types of microwear features (Table 2). The strength of these labiolingual trends in numbers of microwear features varies considerably for both scratches and pits (Fig. 2C). These trends are strongest among browsers (DB and ABR) and the mixed feeder (RU), and weaker for grazers (CS).
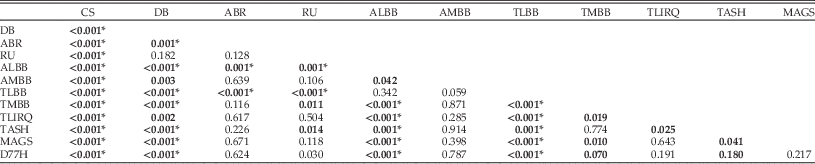
The p-values resulting from paired t-tests comparing the frequencies of scratches and pits from the labial (A1) and lingual (A4) aspects of rhino molars. Bold values indicate significant differences in the numbers of labially and lingually distributed dental-microwear features. Species and assemblage abbreviations given in Table 1.

The two assemblages of early Miocene rhinos (D77H and MAGS) had more homogenously distributed microwear than any other assemblage. The statistical results for Teleoceras and Aphelops are mixed. The TASH assemblage has significant labiolingual microwear trends for both scratches and pits, while the TLIRQ assemblage only shows a significant trend for pits. Results are equally mixed in the Florida assemblages. Both Teleoceras and Aphelops from Mixson’s Bone Bed (TMBB and AMBB) have significant labiolingual trends, while the same species from the Love Bone Bed (TLBB and ALBB) do not.
Microwear Differences between Rhino Assemblages
All ANOVAs testing for differences in scratch and pit frequency between rhino assemblages were significant (p=0.00), indicating strong differences in the frequencies of scratches and pits between the molars of the different rhino assemblages in both the A1 (labial) and A4 (lingual) sampling sites.
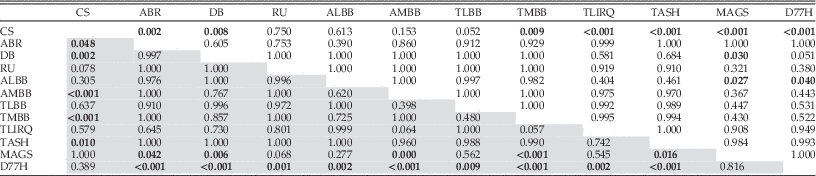
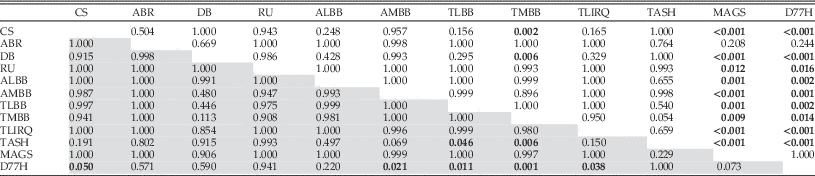
Tukey’s honest significant difference post hoc tests, showing the significance of individual assemblage–assemblage comparisons, are shown in Table 3 for labially distributed microwear (A1) and Table 4 for lingually distributed microwear (A4). Significant microwear differences among extant rhinos are only found on the labial edge (A1). This is consistent with more generalized findings for browsing and grazing perissodactyls, wherein only dental microwear from the labial edge of the tooth is found to be associated with diet (Mihlbachler et al. Reference Mihlbachler, Campbell, Ayoub, Chen and Ghani2016). The grazer (CS) has significantly more scratches and fewer pits than browsers (DB, ABR). Neither browsing nor grazing rhinos were significantly different from the single mixed feeder (RU). RU clusters more closely with browsers.
The p-values for Tukey’s honestly significant difference post hoc tests from ANOVAs comparing the frequencies of scratches (shaded results) and pits (unshaded results) for the labial sampling region (A1). Bold values indicate significant differences in microwear-feature frequency. Species and assemblage abbreviations given in Table 1.

The p-values for Tukey’s honestly significant difference post hoc tests from ANOVAs comparing the frequencies of scratches (shaded results) and pits (unshaded results) for the lingual sampling region (A4). Bold values indicate significant differences in microwear-feature frequency. Species and assemblage abbreviations given in Table 1.

Early Miocene rhinos (D77H, MAGS) have microwear patterns that differ from all other rhinos. TASH has a higher number of lingual scratches, but otherwise, Aphelops and Reference Mead Teleoceras microwear patterns were found to be undifferentiated. In comparison with extant rhinos with known diets, both Teleoceras and Aphelops have microwear that is indistinguishable from browsers (DB and ABR) and the mixed feeder (RU) but in many cases is statistically different from the grazing rhino (CS). Most of these significant differences occur on the labial sampling region (A1), the portion of the tooth that in extant rhinos is most strongly correlated with feeding ecology.
Mesowear
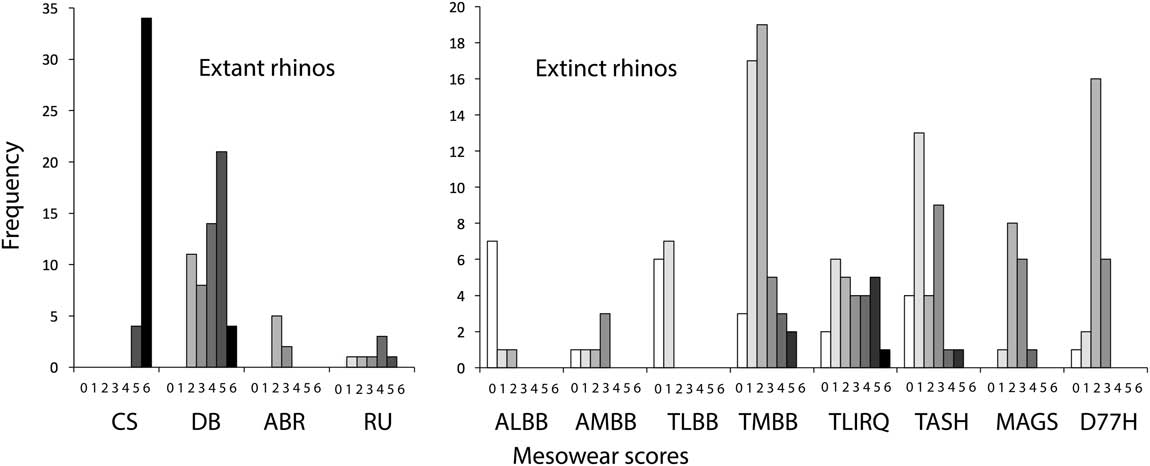
There are many more significant differences between the mesowear scores of the rhino assemblages than there are microwear differences (Table 5). Out of 66 possible two-way nonparametric comparisons, 42 are significant. Thirty-two of these comparisons are still significant after Bonferonni corrections. CS has significantly blunter cusps than all other extant or extinct rhinos examined here (Figs. 3, 4). Mesowear scores varied significantly among extant browsing rhinos; DB cusps were blunter than ABR cusps. The mixed feeder (RU) has mesowear values that are significantly different from CS but fall within the range of browsing rhinos.
Distributions of mesowear scores for M2 paracones along the mesowear “ruler” (Mihlbachler et al. 2011), where the sharpest cusps with high relief are scored (0) and the bluntest cusps are scored (6).

The p-values for Mann-Whitney U-tests comparing mesowear scores of extant and extinct rhino samples. Bold values indicate significant mesowear scores. Asterisk (*) indicates significant result after Bonferroni correction. Species and assemblage abbreviations given in Table 1.

All of the fossil rhinos examined have significantly lower mesowear scores than the grazer CS and the browser DB, with average mesowear values that are similar to Asian rhinos (ABR and RU) or lower. Early Miocene rhinos (MAGS and D77H) have average mesowear scores and mesowear distributions similar to ABR. The mesowear scores of the four assemblages of Reference Mead Teleoceras all differ significantly from one another, suggesting different populations of Reference Mead Teleoceras may have had significant variation in overall dietary abrasion. In the two localities where Teleoceras and Aphelops co-occur (Love Bone Bed and Mixson’s Bone Bed), the average mesowear scores between these rhinos are virtually the same; however, the mesowear scores between these localities differ considerably. At Mixson’s, Teleoceras and Aphelops have average mesowear scores that are only slightly lower than ABR, but these same species at the Love Bone Bed have average mesowear scores that are well below any other rhino assemblage.
Mesowear and Microwear Compared
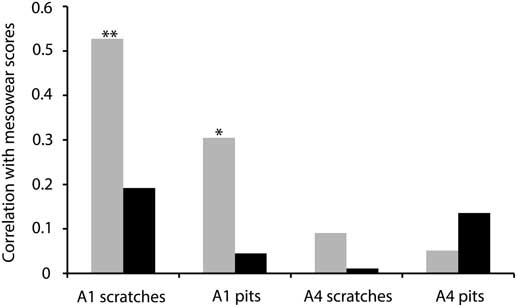
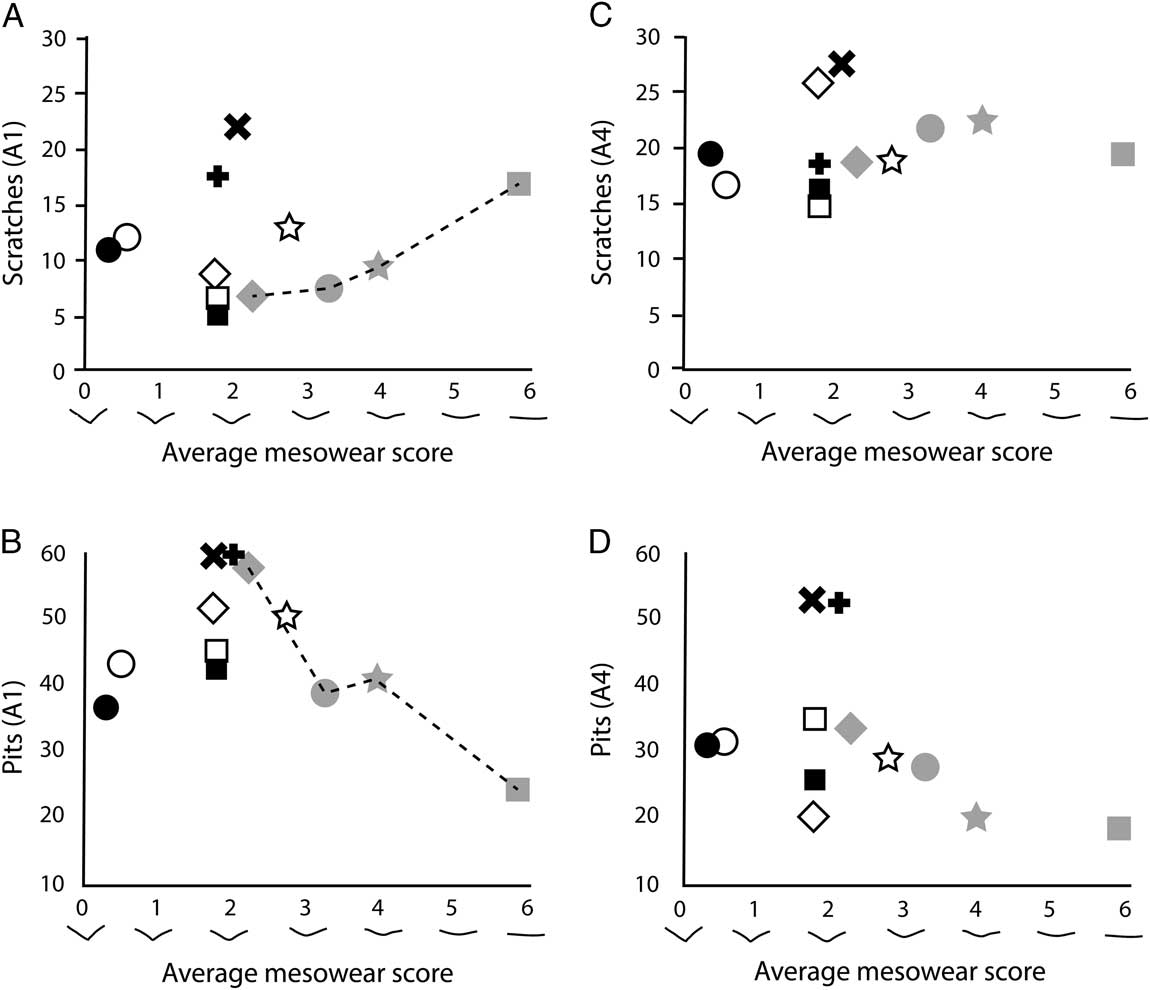
Figure 5 shows Spearmen’s rho correlation coefficients for the mesowear scores and associated microwear data collected from those teeth for which both types of data were available. In the extant rhino data, significant microwear–mesowear correlations were found between mesowear scores and labially distributed microwear data (A1 scratches, A1 pits) (Fig. 5). In plots of average values for each rhino assemblage, A1 scratches and A1 pits strongly trend with average mesowear scores (Fig. 6A,B), with more scratches and fewer pits associated with higher average mesowear scores. No significant correlation was found between mesowear and lingually distributed microwear data (A4 scratches, A4 pits).
Nonparametric Spearman’s rho correlation coefficients for mesowear and microwear variables for extant (gray bars) and extinct (black bars) rhinocerotid assemblages. Significant correlations are marked as follows: **p < 0.001; *p=0.007.

Plots of average mesowear scores against mean values for microwear variables. Key to symbols is given in Fig. 2. The gray symbols represent extant species, with dotted lines connecting them when mesowear and microwear are significantly correlated.

In contrast to the extant rhinos, no significant microwear–mesowear correlation was found among the extinct rhino assemblages (Fig. 5). Some of the fossil rhino assemblages (ALBB, TLBB, MAGS, D77H) appear to have excessive numbers of labially distributed scratches (A1 scratches) in comparison to their comparatively low mesowear scores (Fig. 6A). Some of these assemblages (MAGS, D77H) also seem to have fewer numbers of labially distributed pits (A1 pits) (Fig. 6B). Other assemblages (TASH, TLIRQ, AMBB, TMBB) plot more closely to the microwear–mesowear trend lines suggested by extant rhinos (Fig. 6A,B).
Discussion
Premortem and Postmortem Microwear
Rhinocerotids show labiolingual trends in the distribution of dental-microwear features, with more pits distributed labially and more scratches distributed lingually (Mihlbachler et al. Reference Mihlbachler, Campbell, Ayoub, Chen and Ghani2016). The cause of this pattern is unclear but may be phylogenetically linked (Mihlbachler et al. Reference Mihlbachler, Campbell, Ayoub, Chen and Ghani2016), as ruminant molars show a more homogenous pattern of dental microwear distribution. This same heterogeneous pattern of microwear distribution was found in the fossil rhino data (Fig. 2) and is strong evidence that dental microwear on the fossil rhino specimens is of premortem origin. Postmortem taphonomic alteration would tend to homogenize the appearance of surface wear. Only two fossil assemblages (MAGS and D77H) have statistically undifferentiated labial and lingual microwear. However, as noted in the “Materials and Methods,” specimens showing signs of chemical weathering, postmortem abrasion, contamination with chemical residues, or other macroscopic postmortem damage were rejected in agreement with criteria applied in other microwear studies (King et al. Reference King, Andrews and Boz1999; El-Zaatari Reference El-Zaatari2010). In addition, other evidence suggests the microwear of these specimens is premortem. For example scratches on occlusal surfaces have strong labiolingual orientations in the direction of mastication (Fig. 1). Furthermore, the microwear features are largely confined to occlusal surfaces. The nonocclusal enamel surfaces of these specimens have fewer microwear features and have markedly different surface textures. Therefore, we consider it unlikely that postmortem processes have severely altered microwear of any of the specimens included in the study.
Dental Wear and Diet in Extant Rhinos
Blunted cusps (i.e., high mesowear scores), a high frequency of scratches, and a lower frequency of pits are associated with grazing diets (Fraser and Theodor Reference Fraser and Theodor2011; Mihlbachler et al. Reference Mihlbachler, Campbell, Ayoub, Chen and Ghani2016). There are significant differences between the dental-wear patterns of the grazing (CS) and browsing species (DB, ABR) that are consistent with typical grazer and browser dental-wear patterns. Given the association of these dental-wear patterns with browsing and grazing, the dental wear of RU, a grass-dominated mixed feeder, should either resemble CS or be intermediate between that of CS and browsing species. However, the mesowear and microwear of RU are like those of browsing rhinos (Figs. 2, 3). Similar results were found in another analysis of extant rhinocerotid mesowear (Taylor et al. Reference Taylor, Kaiser, Schwitzer, Müller, Codron, Clauss and Schulz2013), in which differences associated with abrasive and attritive dental wear were observed between browsing and grazing species, but RU mesowear patterns were more attritive in nature and similar to those of browsers. These results lend credence to the suggestion that phytoliths may not be the only factor in driving rhinocerotid dental wear.
High rates of abrasive dental wear in herbivorous mammals have been attributed to both ingestion of phytolith-rich grasses and nondietary abrasives (sand, dust, soil), and this had led to debate on weather dental wear in mammals is more of an indicator of diet or of feeding environment (Lucas et al. Reference Lucas, Omar, Al-Fadhalah, Almusallam, Henry, Michael, Thai, Watzke, Strait and Atkins2013, Reference Lucas, van Casteren and Al-Fadhalah2014; Erickson Reference Erickson2014; Kubo and Yamada Reference Kubo and Yamada2014; Rabenold and Pearson Reference Rabenold and Pearson2014; Xia et al. Reference Xia, Zheng, Huang, Tian, Chen, Zhou and Ungar2015). Recent studies suggest phytoliths are generally softer than mammalian enamel (Sanson et al. Reference Sanson, Kerr and Gross2007; Erickson Reference Erickson2014). Although it has been recently demonstrated that phytoliths are capable of wearing teeth despite being softer (Xia et al. Reference Xia, Zheng, Huang, Tian, Chen, Zhou and Ungar2015), rhinocerotid enamel is harder than that of other ungulates (Hager et al. Reference Hager, Mihlbachler and Beatty2014) and has a highly derived vertical Hunter-Schreger band orientation that enhances resistance to mechanical abrasion (Rensberger and Koenigswald Reference Rensberger and Koenigswald1980; Rensberger et al. Reference Rensberger, Forsten and Fortelius1984; Boyde and Fortelius Reference Boyde and Fortelius1986; Koenigswald et al. Reference Koenigswald, Holbrook and Rose2011). While rhino enamel could be more resistant to abrasion by phytoliths, it would still be more susceptible to abrasion from abiotic abrasives such as quartz, which is many times harder than enamel.
Further examination of the feeding habits of modern rhinos suggests environmental variables that influence the cleanliness of the feeding environment and the proximity of food to abiotic abrasives (sand, soil, dust) may play a dominant role in dental wear. There is a strong relationship between feeding height and dental wear patterns. Among the five extant species, CS feeds lowest to the ground and has the highest abrasion signal in its dental wear. In a study of tooth-blade sharpness in a variety of browsing and grazing mammals, CS was an outlier, with extremely rounded blade tips for which the authors also concluded the degree of abrasion must be very high (Popowics and Fortelius Reference Popowics and Fortelius1997). CS rarely feeds on grasses more than 0.5 m tall (Foster Reference Foster1967; Groves Reference Groves1972; Kleynhans et al. Reference Kleynhans, Jolles, Bos and Olff2011; Rookmaaker Reference Rookmaaker2013), and more than 50% of grasses eaten are reportedly under 5 cm tall. Using a square upper lip, CS crops grasses nearly down to ground level (Owen-Smith Reference Owen-Smith1988; Arsenault and Owen-Smith Reference Arsenault and Owen-Smith2008, Reference Arsenault and Owen-Smith2011).
As noted above, if a grassy diet were the primary agent of abrasive tooth wear, RU would have dental-wear patterns most similar to CS, although its mesowear and microwear fall in the range of browsers. Its grazing strategy is quite different from CS. While CS feeds in short grassy lawns with a square lip, RU pushes grasses that are 4–8 m tall between its front legs and grazes the tips using a prehensile upper lip (Laurie Reference Laurie1982; Laurie et al. Reference Laurie, Lang and Groves1983; Mary et al. Reference Mary, Solanki, Limboo and Upadhaya1998; Hazarika and Saikia Reference Hazarika and Saikia2010).
A lower feeding height increases opportunities to ingest soil, sand, or other abrasive food contaminants. Large mammal molars commonly accumulate ingesta particles that become impacted in the infundibula of molars. CS molar infundibula contain very high concentrations of impacted quartz sand, whereas those of other rhino species contain mostly plant material (Mihlbachler et al. Reference Mihlbachler, Beatty and Ayoub2012a). The differences in feeding height and the greater quantity of quartz sand and dust impacted in CS molars suggest that CS ingests more nondietary abrasives than RU. A cleaner diet, mostly taken from several meters above the ground, may explain why RU has more browser-like dental wear despite its predominantly grassy diet. These findings suggest feeding height and probably other factors that impact the cleanliness of the immediate feeding environment may influence dental wear in rhinocerotids.
Variation in dental-wear patterns among browsing rhinos may also be related to feeding height. DB has higher frequencies of scratches and blunter cusps with lower relief (higher mesowear scores) than other browsing or mixed-feeding rhinos, suggesting a level of dietary abrasion that is intermediate between CS and other rhinos. It also feeds relatively low to the ground. DB has been observed extensively feeding on small herbs and shrubs (Goddard Reference Goddard1970; Mukinya Reference Mukinya1977; Birkett Reference Birkett2002) and taller woody material (Goddard Reference Goddard1968, Reference Goddard1970; Oloo et al. Reference Oloo, Brett and Young1994; Birkett Reference Birkett2002). About 30–60% of biomass consumed by DB is reportedly under 0.5 m tall (Owen-Smith Reference Owen-Smith1988; Lieverloo et al. Reference Lieverloo, Schuiling, Boer, Brown and Prins2009). Most studies indicate that DB preferentially browses at a height of 0.5–1.5 m (Joubert and Eloff Reference Joubert and Eloff1971; Owen-Smith Reference Owen-Smith1988; Emslie and Adcock Reference Emslie and Adcock1994; Baggallay et al. Reference Baggallay, Owen-Smith and Swaisgood1995; Hennig and Gindrig Reference Hennig and Gindrig2002; Ganqa et al. Reference Ganqa, Scogings and Raats2005; Makaure and Caston Reference Makaure and Caston2013). ABR feed from higher levels and in more forested environments than DB and have dental-wear patterns suggesting less-abrasive diets. Both Asian species use chest, shoulders, neck, and chin to bring foliage from saplings into reach (Hoogerwerf Reference Hoogerwerf1970; Owen-Smith Reference Owen-Smith1988). They push over young trees up to 6–7 cm in diameter. Young trees make up the largest portion of their diet (Strickland Reference Strickland1967; van Strien Reference van Strien1986; Owen-Smith Reference Owen-Smith1988; Pratiknyo Reference Pratiknyo1991).
Microwear–Mesowear Congruence
Our hypothesis that congruence between mesowear and labially distributed microwear will occur in the modern rhino assemblages is borne out by the results. The dental microwear on the labial edge of perissodactyl molars (A1) is strongly predictive of diet in browsers and grazers (Mihlbachler et al. Reference Mihlbachler, Campbell, Ayoub, Chen and Ghani2016) and is also statistically correlated to mesowear scores in extant rhinos. Our second hypothesis, that mesowear and microwear are not as strongly correlated in mass-death assemblages is also supported, as we did not find a statistical correlation between these two dental-wear proxies among the fossil rhino assemblages. The possibility that some of the fossil assemblages sustained changes in feeding environment or diet before the mass-death events occurred, leading to disassociations between mesowear and microwear, is supported. Short-term shifts in microwear could be caused by changes in diet or changes in the rate of ingestion of abiotic abrasives due to excessive aridity, cropping vegetation lower to the ground, or contaminated food.
Although there is a difference in the degree of microwear–mesowear congruence between the modern and fossil assemblages, it is difficult to find deeper associations with the hypothesized cause-of-death scenarios for the individual fossil bone-bed assemblages. We hypothesized the time-averaged attritional assemblages from the Mixson’s Bone Bed locality (AMBB, TMBB) would show microwear–mesowear congruence. Indeed, the average mesowear and microwear values of the AMBB and TMBB assemblages plot in close proximity to the microwear–mesowear trend lines for extant rhinos for labial microwear variables, suggesting strong microwear–mesowear congruence (Fig. 6A,B). However, although one might hypothesize less congruence among the catastrophic and semicatastrophic assemblages, these assemblages show a mixture of congruent and incongruent patterns. Two Reference Mead Teleoceras assemblages (TASH and TLIRQ) have relatively congruent mesowear and labially distributed microwear (Fig. 6A,B). Others show more incongruence. The Love Bone Bed rhinos (ALBB, TLBB) have more labially distributed scratches than mesowear would predict, and the early Miocene assemblages (MAGS, D77H) have more labial scratches and fewer labial pits than mesowear would predict (Fig. 6A,B). These four assemblages (D77H, MAGS, ALBB, TLBB) appear to be responsible for the lack of statistically significant correlation of mesowear and microwear among the fossil rhinos.
Unfortunately, in most instances it is difficult to predict from taphonomic evidence the duration of ecologically stressful periods that precede mass deaths. In instances in which catastrophic mortality occurs, variation in the duration of exposure to the events leading to the mortality may influence the degree to which microwear shifts out of alignment with mesowear. At the onset of ecological pressure, such as a drought, microwear should become altered at a faster rate than mesowear. If the ecologically stressful event were sufficiently prolonged, many of the animals would have been exposed for an extended period of time before finally succumbing. Longer exposure would tend to bring microwear and mesowear into alignment in the dentitions of the eventual victims. For instance, at the Ashfall locality, rhinos exhibit bone pathologies associated with ash inhalation and asphyxiation, suggesting that the animals succumbed over weeks or months (Tucker et al. Reference Tucker, Otto, Joeckel and Voorhies2014). The evidence for prolonged exposure could explain the more congruent nature of mesowear and microwear in this assemblage. Those assemblages that show greater microwear–mesowear incongruence may have been events of shorter duration. We conclude that while the data provide evidence for greater frequency of microwear–mesowear incongruence in fossil bone beds in comparison with modern hunted assemblages, probably due to ecological disturbance proximate to the time of death, it remains difficult to understand details of the individual death events that would allow for more specific predictions about mesowear and microwear agreement.
If further studies show that the degree of microwear–mesowear incongruence in mass death assemblages relates to the duration and severity of ecological pressure associated with the mortality event, this adds an additional dimension of ecological evidence that these proxies can offer. We endeavor to demonstrate this possibility in the following section, but caution that studies of the dental-wear rates and turnover rates of mesowear and microwear signals in nature (Solounias et al. Reference Solounias, Fortelius and Freeman1994; Damuth and Janis Reference Damuth and Janis2014) and in experimental settings (Schulz et al. Reference Schulz, Piotrowski, Clauss, Mau, Merceron and Kaiser2013; Hoffman et al. Reference Hoffman, Fraser and Clementz2015) are needed to better establish the time duration represented by these different dental-wear proxies.
Miocene Rhino Dental Wear and Feeding Ecology
Bearing in mind the results presented earlier, we attempt to derive conclusions about the feeding ecologies of Miocene North American rhinocerotids. In cases in which mesowear and microwear show incongruence, we suggest mesowear is more appropriate for drawing conclusions about generalized aspects of diet. The majority of the fossil rhino assemblages have low mesowear scores that resemble Asian rhinos and are significantly different from African rhinos, suggesting these rhinocerotids typically adopted low-abrasion browsing or mixed-feeding diets, possibly from tall vegetation or other relatively clean feeding environments.
While mesowear is consistent with a hypothesis of browsing diets for Diceratherium and Menoceras, the microwear of these early Miocene rhinos is unique, with excessive quantities of both scratches and pits. The specific diets associated with these microwear patterns are unclear and may be consequences of some localized aspect of diet and or feeding environment during these mass-death events, possibly associated with ecological stress.
The only fossil assemblage examined here for which there is direct evidence of diet is the Ashfall locality. Fossil grass anthoecia of the genus Berriochloa are found in the oral and abdominal cavities of Ashfall Reference Mead Teleoceras skeletons (Voorhies and Thomasson Reference Voorhies and Thomasson1979), indicating Reference Mead Teleoceras consumed siliceous grasses shortly before the mortality event caused by prolonged exposure to an ash-contaminated environment. However, neither the mesowear nor the microwear offer compelling evidence of an excessively abrasive diet caused by short-grass grazing or ingestion of volcanic ash. Such extreme ecological disturbance may not always have predictable effects on feeding behavior. For example, if Reference Mead Teleoceras had a feeding ecology similar to RU and fed from taller vegetation, including browse and taller riparian grasses, its feeding environment might not have been heavily contaminated by ash.
Both Aphelops and Reference Mead Teleoceras are abundant in the Love Bone Bed and Mixson’s localities from Florida, and these localities provide insights into the ecology of these two sympatric rhinos. At each locality, the mesowear and microwear of Aphelops and Reference Mead Teleoceras are undifferentiated. This finding is peculiar considering their differing ecomorphologies and considering evidence indicating their diets were isotopically differentiated at times with Reference Mead Teleoceras consuming higher amounts of C4 grass (MacFadden Reference MacFadden1998). However, the mesowear and microwear patterns of both rhinos differ significantly between Mixson’s and Love Bone Bed, suggesting the feeding ecology of these rhinos differed between localities. A stronger relationship of dental wear with feeding environment rather than diet better explains how Aphelops and Teleoceras Reference Mead, two rhinos with ecomorphologically dissimilar morphologies and isotopically differentiated diets (MacFadden Reference MacFadden1998), have similar dental patterns that covary with fossil localities. Both mesowear and microwear proxies suggest feeding ecologies similar to ABR at Mixson’s. The Love Bone Bed results for both rhinos (TLBB and ALBB) are more anomalous; both Teleoceras and Aphelops have exceptionally low and outlying mesowear scores that are significantly different from all other rhinos, with many sharpened, tall cusp apices. The Love Bone Bed was a pure C3 ecosystem that existed prior to the spread of C4 grasses in Florida (MacFadden and Cerling Reference MacFadden and Cerling1996; MacFadden Reference MacFadden1998). Teleoceras and Aphelops have statistically undifferentiated isotopic signals from this locality and are among the species with the most negative Δ13C values of the entire fauna along with a tapir Tapirus simpsonii, suggesting habitation of closed environments (Feranec and MacFadden Reference Feranec and MacFadden2006). The clean and minimally abrasive diets suggested by mesowear could be a reflection of these isotopic results. The Love Bone Bed assemblages of Aphelops and Reference Mead Teleoceras have microwear patterns that imply more abrasive diets than their mesowear scores would indicate, again suggesting seasonal fluctuation in feeding environments and possibly associated seasonal dietary shifts (e.g., seasonal mixed feeding) or some form of short-term ecological disturbance (e.g., drought) near the time of death that increased the abrasiveness of the diets of both rhinos.
Conclusions
This study offers conclusions on patterns of incongruence between mesowear and microwear in death assemblages and conclusions on the relationship of dental wear and ecology in living and extinct rhinocerotids. Most studies of ungulates and other strictly herbivorous mammals attempt to relate dental wear to diet in terms of browse/graze. As a consequence of their larger size, megaherbivores feed less selectively than smaller herbivores (Owen-Smith Reference Owen-Smith1988) and are more likely to ingest abiotic abrasives (dust, sand, silt) if food (e.g., short grass) is in close proximity to such material. Because minerals such as quartz are much harder than enamel, frequent ingestion of such particles may strongly influence dental wear. Mesowear and microwear of extant rhinos is strongly associated with diet and feeding height. Dental-wear patterns in rhinos may be more closely related to the rate of ingestion of abiotic minerals than intake of phytoliths. Therefore, dental-wear patterns of rhinos (and possibly other megaherbivores) may tell us less about diet and more about the conditions of the feeding environment.
A high degree of congruence between mesowear and microwear was encountered in collections of modern rhino material, which mostly consists of specimens that were hunted. In contrast, microwear–mesowear incongruence was more often found among the fossil mass-death assemblages. Mesowear suggests North American Miocene rhinocerotids had diets either less abrasive than all extant rhinos or similar to that of Asian browsing and mixed-feeding rhinos that feed on tall vegetation. However, about half of the fossil assemblages show microwear patterns that suggest altered diets near the time of death. These results are consistent with our hypothesis that near-death changes in feeding ecology related to ecological stress may commonly bias microwear data in fossil assemblages. However, this conclusion is not a negative reflection of the value of dental microwear. The three main paleodiet proxies for ungulates in the paleoecologist’s tool kit include stable isotopes, mesowear, and microwear. All three of these proxies relate to diet at different life-history intervals, including growth and development (stable isotopes), an extended period of time before death (mesowear), and a brief interval of time before death (microwear). We recommend that paleoecological studies recognize the limitation of each proxy and that integration of these methods provides a more richly textured view about not only paleodiet, but how diets drift throughout the lives of the organisms with ontogeny, seasonal change, and stochastic ecological disturbances.
Acknowledgments
We thank the following institutions and their curators and staff for access to modern and fossil specimens: American Museum of Natural History, New York; Florida Museum of Natural History, Gainesville, Florida; National Museum of Natural History, Washington, D.C.; and University of Nebraska State Museum, Lincoln, Nebraska. Brian Beatty and Nikos Solounias were invaluable in developing the research questions and methods used here. Three anonymous reviewers offered valuable advice on improving the manuscript. Finally, we thank Kurt Amsler and the advanced research core undergraduate research initiative at the New York Institute of Technology for providing opportunities for undergraduate research.
Supplementary Material
Data available from the Dryad Digital Repository: http://dx.doi.org/10.5061/dryad.d3qt0