Following Christopher Columbus' journey to the Americas and Vasco da Gama's rounding of the Cape in the late fifteenth century, Europe's trade with the rest of the world grew at approximately 1 percent annually for a period of three centuries (O'Rourke, Prados de la Escosura, and Daudin Reference O'Rourke, de la Escosura and Daudin2008, p. 7). This growth is remarkable when compared with the development of world trade in centuries prior: indeed, trade grew about twice as fast as national income (Findlay and O'Rourke Reference Findlay and O'Rourke2007, p. 305). Following Adam Smith, who proclaimed these voyages to be the most important events in recorded history (2003, p. 793), several scholars have attributed great significance to this trade expansion and suggested that it created a single integrated world economy with a global division of labor by the early modern period (e.g., Wallerstein Reference Wallerstein1974–Reference Wallerstein1989; Frank Reference Frank1998).
The question of when an integrated world economy came into being (or when did globalization begin?) has since become the subject of a lively debate among economic and world historians. The extent to which commodity prices converge across the globe has been used as a central indicator of such economic integration. In a seminal contribution, Kevin O'Rourke and Jeffrey Williamson (Reference Kevin and Williamson2002) found no evidence of price convergence in trade between Europe and Asia prior to the 1820s and concluded that globalization began only after that. However, several recent studies have shown evidence of the integration of trans-Atlantic commodity markets in the eighteenth century (Rönnback Reference Rönnbäck2009; Dobado-Gonzales, Garcia-Hiernaux, and Guerrero Reference Dobado-Gonzalez, Garcia-Hiernaux and David E.2012; Sharp and Weisdorf Reference Sharp and Weisdorf2013). In his review of the globalization debate, Jan De Vries (Reference De Vries2010, p. 715–6) reasonably notes that because the institutions in the New World were specifically molded to serve the interests of export and long-distance trade “the real test of early modern globalization, by any definition, requires a study of Eurasia.”
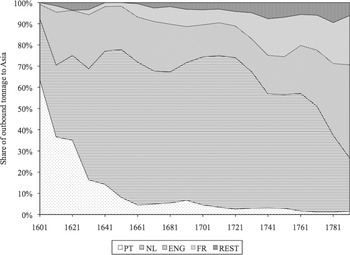
Here, I contribute to this debate with an investigation of price convergence in the Dutch-Asiatic trade in the seventeenth and eighteenth centuries. The Dutch East India Company (Verenigde Oost-Indische Compagnie, or VOC) was by far the largest trading company active in the Euro-Asian trade between 1600 and 1800; 49 percent of all ships sailing to Asia in the seventeenth and eighteenth centuries were Dutch (Gaastra and Bruijn Reference Gaastra, Jaap R. and Bruijn1993). In the second part of the eighteenth century the English and French began to catch up, but it was not until the 1780s that they exceeded the Dutch in the share of outbound tonnage (see Figure 1). Nonetheless, the data on Dutch-Asiatic trade that have been used in the debate on globalization's origins have been sparse, comprising decadal average prices for only three products: cloves, coffee, and pepper (O'Rourke and Williamson Reference Kevin and Williamson2002; Rönnbäck Reference Rönnbäck2009). While pepper and cloves were certainly of great importance to the VOC in the early seventeenth century, by the 1660s they had already been surpassed by textiles in terms of total invoice value of return cargos (Prakash Reference Prakash1998, p. 115). The importance of coffee did increase over the eighteenth century, yet the rise of a global market for coffee in the eighteenth century is still a subject of debate (e.g., McCants Reference McCants2008; Topik Reference Topik, Clarence-Smith and Topik2003).
EUROPEAN TRADE WITH ASIA, 1601–1800

This article adds to the ongoing discussion on the origins of globalization. Specifically, I examine the evidence for price convergence between c. 1600 and c. 1800 and investigate the factors that drove or hindered that process. I begin with a brief discussion on the definition of globalization, followed by methodological considerations and an introduction to the sources. Then I show trends in the price differentials between Europe and Asia in the seventeenth and eighteenth centuries. Differences in the extent of VOC control over purchasing markets in Asia is emphasized as an explanation for the variety in price trends found among the different commodities traded. When commodities were traded between competitive markets, price convergence took place. In many purchasing markets, however, the VOC used its power to negotiate long-term price contracts with local potentates or to acquire complete control over prices and quantities produced. In these instances, price convergence was less substantial or I find evidence for divergence.
DEFINITION, METHODOLOGY, AND SOURCES
Definition matters. De Vries (Reference De Vries2010) distinguished between “soft” and ”hard” globalization “Soft” globalization is concerned with the deep and lasting impacts of sustained global interaction and includes ecological, demographic, cultural, as well as economic elements (Flynn and Giraldez Reference Flynn and Giraldez2004). Such a broader process is, however, difficult to measure. The focus in this article is therefore on ”hard” globalization, the definition employed by O'Rourke and Williamson, which has the advantage that it can be tested quantitatively.
“Hard” globalization is defined as the integration of international commodity markets. In a theoretical, perfectly integrated world market, prices would be the same across the globe. In reality, prices are never completely the same across markets as transaction costs incurred in trade drive a gap between prices in the export and import markets. These include transport costs and tariffs, the costs of administrating the trading firm and the acquisition of goods, and monopoly or monopsony power. Defined in this way, the process of globalization is driven by a decline in these costs and the diminishing of monopoly profits. This also allows for a growth of trade, but as trade volumes may also increase as a result of population growth, capital accumulation, and/or other factors unrelated to market integration, the best evidence of globalization is the declining gap in prices between export and import markets (O'Rourke and Williamson Reference Kevin and Williamson2002, pp. 25–26).
To examine price convergence between Amsterdam on the one hand, and different markets in Asia on the other, I employ a database on prices primarily based on new research in the VOC archives. Sales prices were collected from the “ummarizing Tables” which recorded the sale of goods at the public auctions held in Amsterdam between 1642 and 1790.Footnote 1 For purchase prices in Asia, the “General Ledgers” of the VOC Bookkeeper-General in Batavia (present-day Jakarta, Indonesia) constitute the main source.Footnote 2 Trade for the entire VOC charter area was recorded in these ledgers. They record, for each financial year, the quantities and values of all products shipped between the Dutch Republic and Asia, as well as among the VOC's various establishments in Asia. Fifty-five of these volumes for the eighteenth century have been preserved. In addition, I gathered data from facturas (export invoices), which provide, per ship, the quantities of goods purchased in Asia and the prices for which they were procured.Footnote 3 Additional observations came from rendementen (financial returns), which give the purchase and sales prices of various goods at the VOC's establishments in Asia.Footnote 4 The facturas and rendementen were the main sources for the seventeenth century (for which no “General Ledgers” exist), but were also used to fill gaps resulting from missing “General Ledgers” for the eighteenth century. In addition, I used a variety of published primary materials to add as much observations as possible (Coolhaas et al. Reference Coolhaas1960–Reference Coolhaas2007; Heeres, Colenbrander, and Van der Chijs Reference Heeres, Colenbrander and van der Chijs1887–Reference Heeres, Colenbrander and van der Chijs1931; Van der Chijs Reference Van der Chijs1885).
The VOC always recorded the price paid for the product where it was actually acquired, even though the ledgers were maintained in Batavia. For example, in the case of cloves the price in the sources always reflects the purchase price on Ambon (as that was the only place where it acquired cloves). The purchase prices for the products could be reported in various units of measurement, such as the Dutch pond, the picol, and the bahar, or prices could be expressed in different currencies: e.g., rials, rixdollars, and guilders. I have converted all these to guilders per pond in order to compare these prices with the auction prices in Amsterdam.Footnote 5
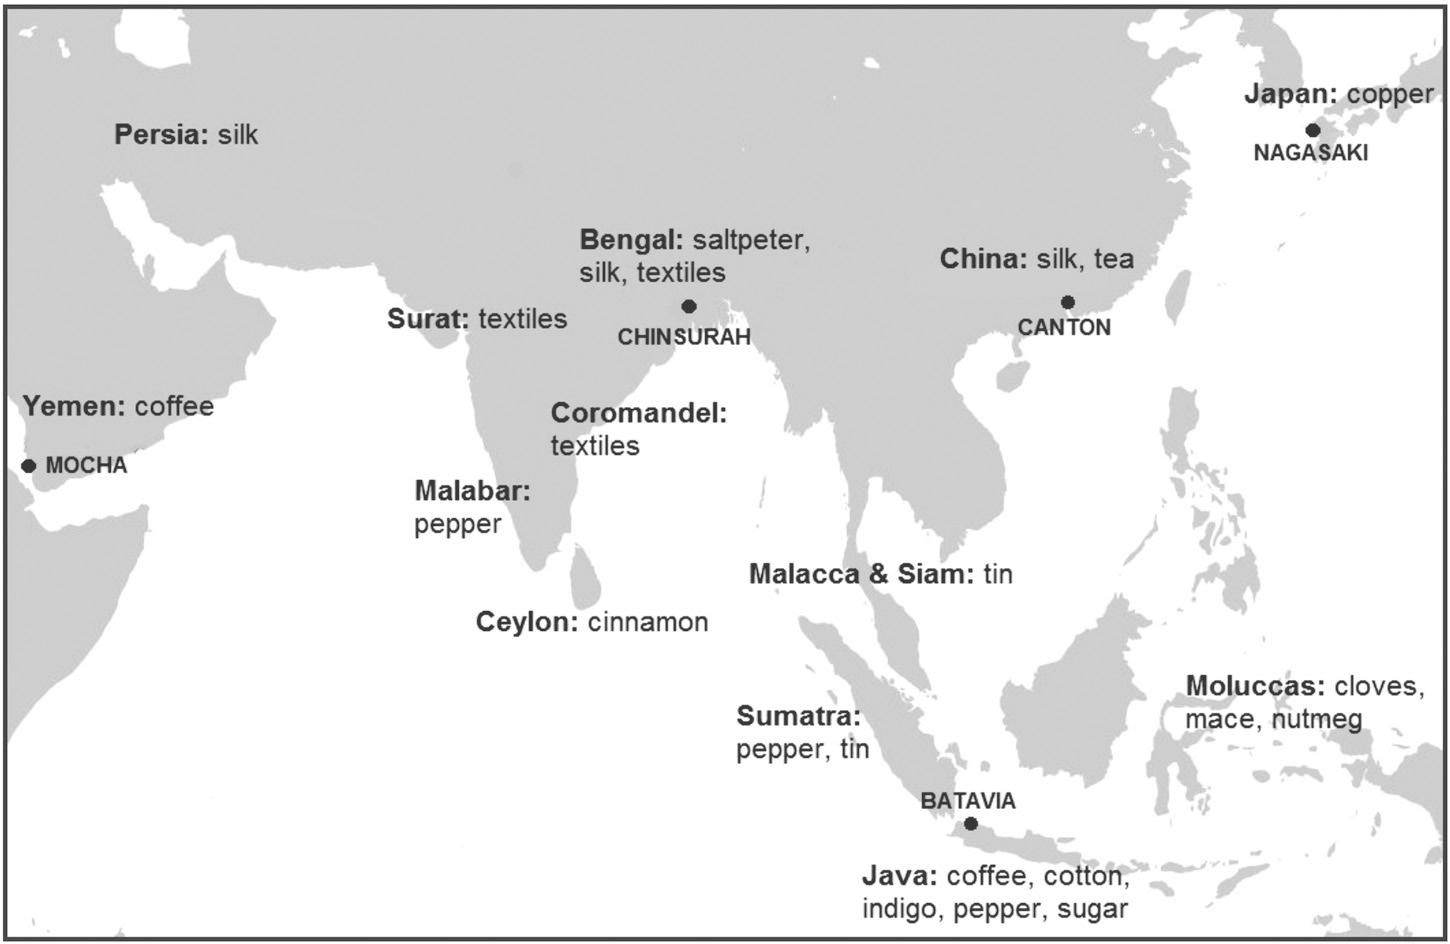
The database contains prices for 16 products that together accounted for more than 90 percent of the total sales in Amsterdam during almost the entire period under discussion. Thus virtually the entire Dutch-Asiatic trade is captured by this analysis. These commodities came from many different places in Asia, from as far West as Mocha in Yemen to Nagasaki in Japan. Figure 2 shows the areas where the VOC purchased which goods. Although some gaps in the price series remain, especially for the seventeenth century, these are not detrimental to the analysis of price convergence since they can be assumed to be random (i.e., caused by the loss of source materials rather than missing because of patterns in trading). The number of markets and length of the time-period covered by these data clearly exceeds that of previous studies and these series are thus a big improvement compared with the evidence available to date.
REGIONS IN ASIA AND COMMODITIES PROCURED BY THE VOC

WAS THERE ANY EARLY MODERN PRICE CONVERGENCE?
The price gap between the markets can be measured in different ways. O'Rourke and Williamson study what they call “mark-ups”: the ratio of selling price in Europe to the purchasing price in Asia. While the mark-up is a straightforward measure that allows easy interpretation, simply inferring globalization from it is not. Klas Rönnbäck (Reference Rönnbäck2009, p. 100) has criticized the mark-up as an unbalanced measure, because it gives relatively large weight to changes in purchasing prices (as the denominator in the equation). Although I too use this measure, as a robustness check, I also compute series with the price gap between the purchase and sales market divided by the mean price in those two markets (GAP1). Yet, as these series may show convergence as a result of a positive demand shock (unrelated to globalization) that drives up the mean price, I calculate a third measure showing the absolute price gap corrected for inflation (GAP2). To get a sense of the absolute size of the gap and the profit margins obtained per product, I also computed for each commodity the gross margin per ton (subtracting the cost price from the sales proceeds).Footnote 6
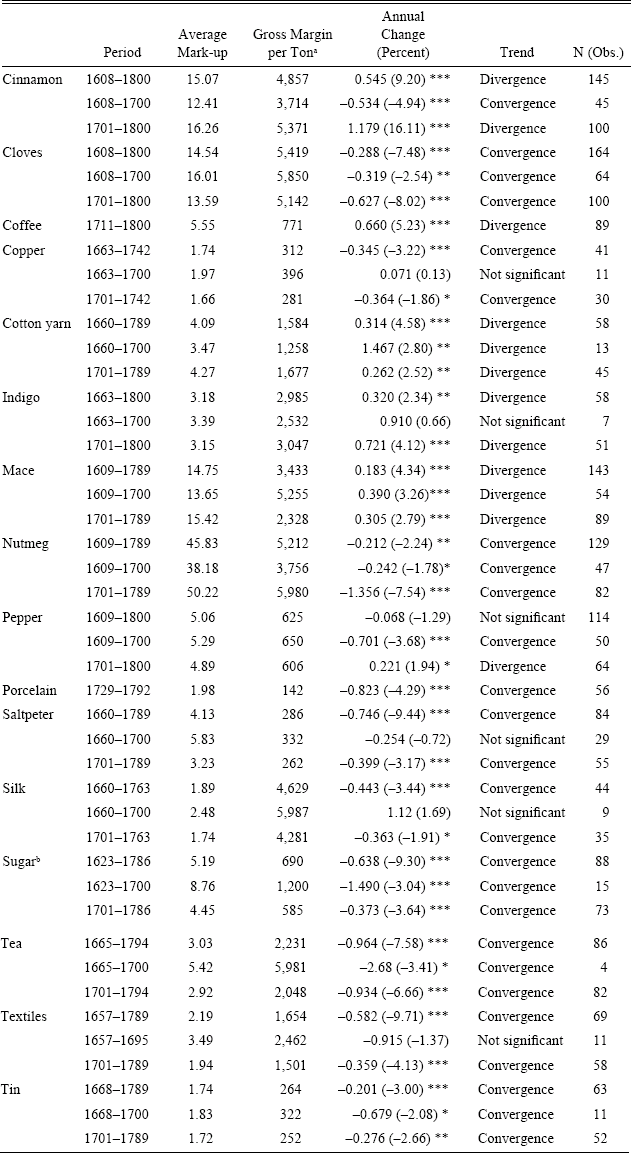
In Table 1 I present both the levels and the trends over time for the price differentials of the 16 commodities in the database. For each commodity, I give the average mark-up, gross margin, annual change, and whether we see divergence and convergence between the Asian market and Amsterdam for the whole period and separately for the seventeenth and eighteenth centuries.Footnote 7 Following other studies on price convergence the trends were tested for statistical significance, as follows:

where LnMUj is the log of the mark-up for commodity j between two markets, TIME is a linear trend, αj + the constant, and βj = the annual percentage change in the mark-up each year for commodity j; ↕ is the error term. Looking at the entire period, ten price series show convergence (cloves, copper, nutmeg, porcelain, saltpeter, silk, sugar, tea, textiles, and tin), while five series diverge (cinnamon, coffee, cotton yarn, indigo, and mace) and the series for one commodity (pepper) shows no significant convergence or divergence.
PRICE CONVERGENCE AND DIVERGENCE IN THE DUTCH-ASIATIC TRADE, 1608–1800

* + significance at the 10 percent level.
** + significance at the 5 percent level.
*** + significance at the 1 percent level. T-statistics are in parentheses.
aThis is the sales price – purchasing price, corrected for inflation using Van Zanden (Reference Van Zanden2009). Textile margins estimated on the basis of 8 pond
bFor Asia there are two types of sugar (candy and caster) reported in the sources, while the Amsterdam series only shows one type of sugar (this seems to be the candy variety, although this is not specified in the source). Only candy sugar is included in this table (caster sugar shows the same trends).
Source:
See text.
In general, trends in price convergence seem to have been more solid in the eighteenth century (perhaps also because the data are more abundant). In all but two products, cinnamon and pepper, price convergence took place in the seventeenth century. A relatively large decline in mark-ups during the seventeenth century can be observed for sugar, tea, and tin, although the number of observations this is based upon is small. Nonetheless, it seems possible that price convergence was already underway before the eighteenth century.
Especially the trends for porcelain, silk, sugar, tea, and textiles show substantial convergence over the entire period. The cumulative effect of a 0.5 to 1 percent decline annually for a period of one and a half centuries reduced the price gap considerably. Such convergence implies that Asian producers were able to benefit from considerably higher prices and/or that consumers in Europe enjoyed lower prices and could thus increase their consumption of these goods. Indeed, there is evidence of increased consumption of tea, coffee, and sugar in Europe over these two centuries (McCants Reference McCants2008) and it has been argued that this had important effects on, for example, household decision-making (De Vries Reference De Vries2008) and living standards (Hersh and Voth Reference Hersh and Voth2009). Although Indian textile producers may have benefitted from increased European demand for their goods, more research on the early modern economies of Asia is needed to confirm whether these trade flows were big enough to matter, and, if so, whether they had positive or negative effects on growth.
The average mark-ups, or the size of the gap, between purchase and sales prices also differed per commodity (see column three in Table 1). For nutmeg, the sales price in Amsterdam was on average 45 times the purchase price in the Moluccas. This meant that, after subtracting the cost price from the sales proceeds, the VOC grossed more than 5,000 guilders on the sale of a ton of nutmeg.Footnote 8 The VOC's gross margin on the sale of a ton of cinnamon, cloves, or mace was similarly large, between 3,500 and 6,000 guilders. Of course, the defense and governing of the colonies where the VOC bought these goods imposed many additional costs, which had to be covered by these margins. In contrast, for copper and tin sales prices in Amsterdam were relatively low and less than double the purchase price in Asia. The VOC earned only about 300 guilders per ton, barely covering freight rates. These commodities were thus employed as ballast and would be used to fill up any spare capacity in the returning fleet.
These examples lead to the question of how to assess this array of data. Is price convergence for one product more important than that for another? O'Rourke and Williamson (Reference Kevin and Williamson2002) have rejected globalization before the 1820s on the basis of data related to pepper, coffee, and cloves;Footnote 9 on the basis of data on sugar, tobacco, and tea Rönnbäck (Reference Rönnbäck2009) suggests that early modern globalization cannot be so easily dismissed. De Vries (Reference De Vries2010, p. 724) argues that even if mark-ups for most commodities declined only marginally, or not at all, “overall gross margins faced by the trading companies tended to decline nonetheless because of an additional effect of a continually changing mix of goods in a direction that involved them in progressively more competition, both in Asia and at home.”
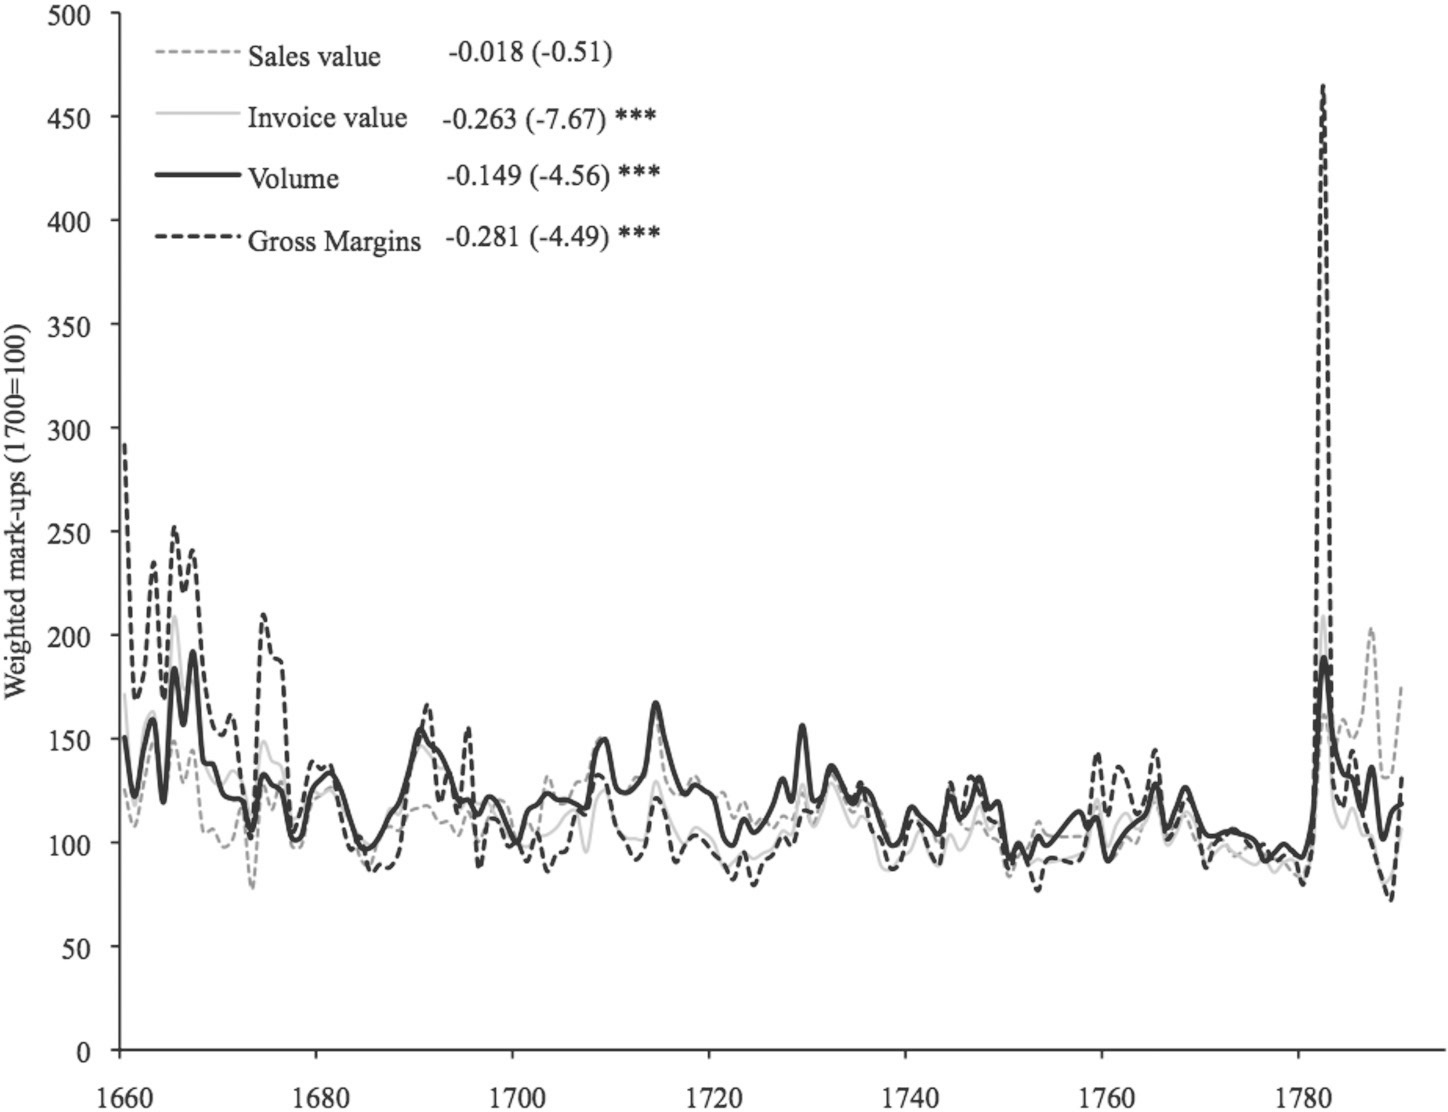
To account for the relative importance of the various goods in the analysis of price differentials, price gaps can be weighted by the comparative importance of each good in total trade flows. These weights are derived from VOC auction data in Amsterdam, which include the total volumes and values of all goods sold. While these weights are thus based only on sales in Amsterdam, half of all goods brought to Europe by the VOC were sold in Amsterdam (the other half was sold in the other VOC chambers)Footnote 10 and the composition of the Amsterdam sales is representative for the entire Dutch-Asiatic trade (Glamann Reference Glamann1982, p. 14). In Figure 3, I plot four series: (1) the mark-up weighted by sales values in Amsterdam; (2) the mark-up weighted by purchase values in Asia; (3) the mark-up weighted by the volumes of the goods;Footnote 11 and (4) the gross margins of the VOC trade (total sales value/total invoice value).Footnote 12
WEIGHTED MARK-UPS IN THE DUTCH-ASIATIC TRADE, 1660–1790 (1700=100)

In three of the four series, the change is negative and significant. Only the series on Amsterdam sales values is not significant. This is largely driven by increases in the sale prices for cinnamon, coffee, mace, and nutmeg at the end of the eighteenth century, a consequence of shortages caused largely by various local problems in production, which I discuss in greater detail later in the article. If one considers volumes, Asian invoice values, or gross margins to be more important metrics, then price convergence was taking place over this period.
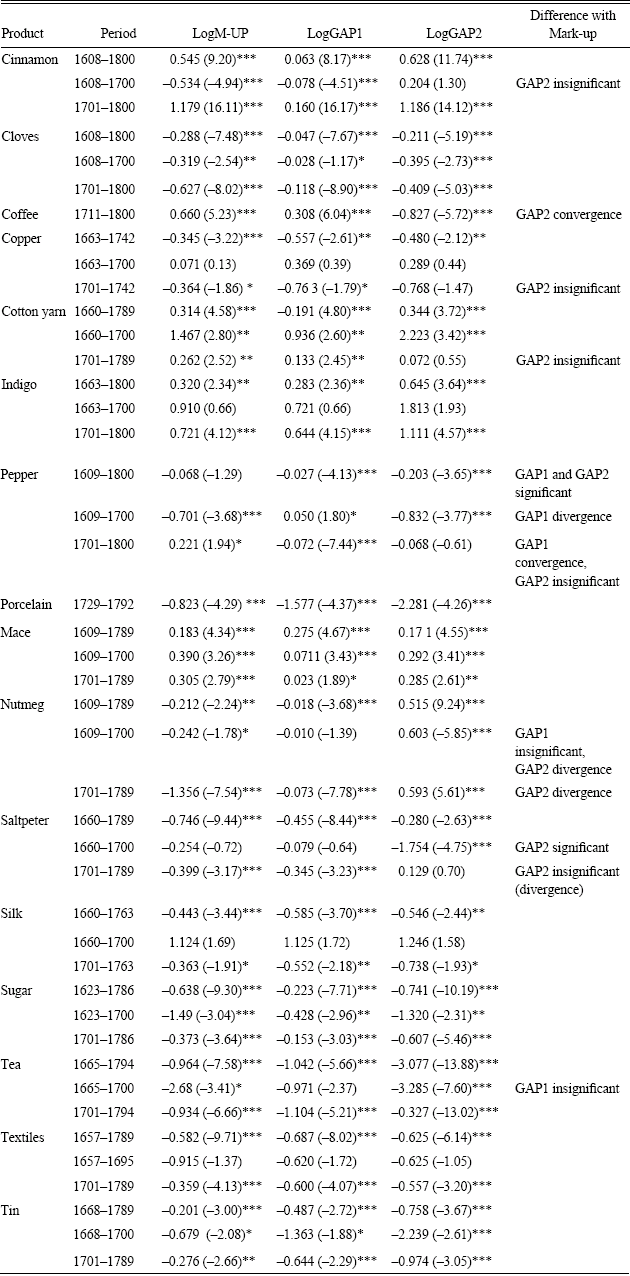
These results are generally robust to different measurements. The trends in the other measures (GAP1 and GAP2, introduced at the beginning of this section) are shown in Appendix Table 2.
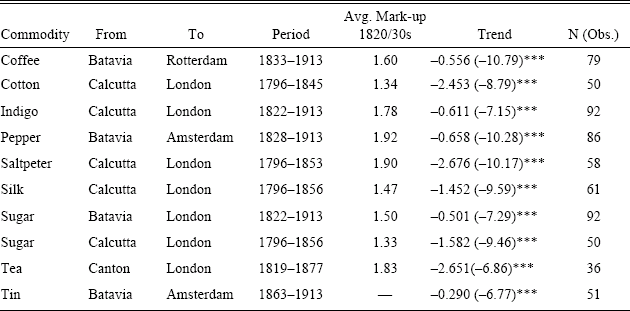
To put these trends in perspective, they can be compared with those for the nineteenth century using David Chilosi and Giovanni Federico's data (2015) on prices for similar commodities traded between Asia and Europe. Comparing these data with those for the VOC, I find generally faster convergence in the nineteenth century relative to the early modern period (see Table 2).Footnote 13 Their data suggest substantial decreases in price gaps already in the first half of the nineteenth century, especially for cotton, saltpeter, silk, and sugar, which may be attributed to a decline in shipping costs in the period 1780–1820 (Solar Reference Solar2013).Footnote 14
PRICE CONVERGENCE IN THE NINETEENTH CENTURY

* + significance at the 10 percent level.
** + significance at the 5 percent level.
*** + significance at the 1 percent level. T-statistics are in parentheses.
Source:
Chilosi and Federico (Reference Chilosi and Federico2013, Reference Chilosi and Federico2015).
There was a significant expansion of global trade in the early modern period, yet trade growth of more than 1 percent per annum in the period 1500–1800 is substantially less than the 3.85 percent annual growth of the nineteenth century (O'Rourke and Williamson Reference Kevin and Williamson2004, p. 112). This latter growth rate means a significant cumulative increase in total annual trade volumes during the nineteenth century. If one takes as a benchmark a total intercontinental trade flow to Europe of 700,000 tons per annum around 1800 (De Vries Reference De Vries2010, pp. 718–20),Footnote 15 this figure would have increased more than 10-fold to almost 7.3 million tons per annum by around 1900 (assuming an annual growth of tonnage of 3.85 percent).Footnote 16 The ratio of world trade to world gross domestic product (GDP) increased from somewhere between 2 and 8 percent around 1800 to roughly 20 percent by the end of the nineteenth century (Estevadeordal, Frantz, and Taylor Reference Estevadeordal, Frantz and Alan M.2003, p. 360).
O'Rourke and Williamson (Reference Kevin and Williamson2002) are, therefore, correct in suggesting that price convergence was faster and more universal, and trade volumes larger, in the nineteenth century. In terms of levels, mark-ups in the nineteenth century were far below those in the eighteenth century. As shown in Table 1, mark-ups for some commodities were remarkably high and some price trends were diverging. Nonetheless, the VOC data suggest price convergence for the majority of products transported between Asia and Amsterdam. Indeed, price gaps generally showed convergence when weighted by total volumes, invoice value, or gross margins. These data do not support the assertion that “there is absolutely no evidence of price convergence for Dutch imports prior to the nineteenth century” (Findlay and O'Rourke Reference Findlay, O'Rourke, Bordo, Taylor and Jeffrey G.2003, p. 26).Footnote 17 Rather, the data presented here argue for an earlier start for globalization and point to continuity between globalization in the eighteenth and nineteenth centuries, rather than its sudden rise in the nineteenth century. These results are in line with the studies by Rönnbäck (Reference Rönnbäck2009) and Rafael Dobado-Gonzales, Alfredo Garcia-Hiernaux, and David E. Guerrero (Reference Dobado-Gonzalez, Garcia-Hiernaux and David E.2012).
FORCES DETERMINING CONVERGENCE OR DIVERGENCE
The data series presented in Table 1 show the overall patterns of convergence and divergence by commodity. I now explore those forces that promoted or hindered the process of price convergence in the early modern era.
Transportation Costs
The difference between the sale and purchase price has to cover transport and administrative costs, tariffs, and taxes. The price convergence observed in my data could have been driven by a decline in any one of these. As transportation costs are the largest component, I will discuss the possibility of a decline in these resulting from increased shipping productivity. Although Douglass North (Reference North1958) and Russell Menard (Reference Menard and Tracy1991) query whether shipping productivity increased before the nineteenth century, more recent work argues that the increased speed of ships and a higher frequency of voyages due to improvements in shipbuilding and navigation improved the productivity of ocean shipping (Rönnbäck Reference Rönnbäck2013; Solar Reference Solar2013; Solar and Hens Reference Solar2013; Kelly and Ó Gráda Reference Kelly and Gráda2014; Solar and Rönnbäck Reference Solar and Rönnbäck2015). However, many of these improvements took place only in the late eighteenth and early nineteenth centuries and were, to a great extent, the consequence of the copper sheathing of hulls, which was not adopted by the VOC until the 1790s. They are, therefore, unlikely to be the source of declining transport costs for my period (Bruijn, Gaastra, and Schöffer Reference Bruijn, Gaastra and Schöffer1987, p. 106).
Between the early seventeenth century and the 1790s, however, the average tonnage of goods transported by a VOC ship roughly doubled from an average of more than 400 to more than 800 tons per ship (with some ships even transporting more than 1,000 tons in the 1770s) (Bruijn, Gaastra, and Schöffer Reference Bruijn, Gaastra and Schöffer1987, pp. 177–78) which should reduce transportation costs. In addition, the ton-man ratio on inbound ships also increased, from some 4–6 tons per man in the first half of the seventeenth century to roughly 8–10 tons per man in the last decades of the eighteenth century (Gaastra and Bruijn Reference Gaastra, Jaap R. and Bruijn1993, p. 198). This should have led to a decline in labor costs involved in Dutch shipping.
However, not all statistics suggest improvement over these two centuries. While in the seventeenth century a total of 2.7 percent of all voyages ended in disaster (due to capture or shipwreck); this increased to 3.2 percent in the eighteenth century.Footnote 18 In addition, although the voyage from the Dutch Republic to Batavia took on average 239 days in both centuries, the return trip took almost three weeks longer in the eighteenth century (235 days versus 216 days) (Bruijn Reference Bruijn1980). Dutch ships were also slower than those from other companies. English ships, in particular, were significantly faster. In the early 1770s they were able to make the trip to Batavia in just 173 days (Solar Reference Solar2013, pp. 636–37). Recent research has shown that, in contrast to English East India Company ships, the average sailing speed of VOC East Indiamen declined slightly in the second half of the eighteenth century (Kelly and Ó Gráda Reference Kelly and Gráda2014). Finally, VOC ships were being used less intensively: the frequency of voyages declined over the seventeenth and eighteenth centuries,Footnote 19 and the total number of return trips that VOC ships made also declined.Footnote 20 This could have increased capital costs and may explain the paradox of rising labor productivity yet stable freight rates in Dutch-Asiatic shipping.
Wars, especially maritime wars, can drive up transport costs. In terms of the individual series for the products analyzed, wars had only short-run effects on price gaps.Footnote 21 The effects were probably limited by the fact that the VOC could store its goods in its own warehouses and was thereby able to absorb initial shocks to supply. Demand may also have fallen if consumers gave priority to the purchase of more basic commodities.Footnote 22 Mark-ups for mace, nutmeg, and coffee did not decline after the Fourth Anglo-Dutch War (1780–1784), but this was most likely a consequence of increased European prices resulting from shortages of supply unrelated to the war.Footnote 23
Thus, the evidence on the development of the VOC's transport costs over time is mixed. While the average tonnage per ship and per man increased over the seventeenth and eighteenth centuries, other factors that also influence shipping costs, such as average sailing speed and the frequency of voyages, did not improve or perhaps even deteriorated. J.R. Bruijn (1990) found that VOC freight rates per ton remained relatively stable (on average 286 guilders per ton) over most of the eighteenth century, only briefly increasing during Fourth Anglo-Dutch War. It is unclear therefore whether costs in the eighteenth century were much lower relative to the seventeenth century. Furthermore, with estimated freight rates in the eighteenth century of less than fl. 300 per ton, while gross margins could exceed fl. 5,000 per ton, a large part of the price gap remains unexplained. Because the trends and absolute gaps differed across commodities we need to search for explanations other than those factors that would affect all trends equally (like transport costs).
Commodity Markets in Europe and Asia
Monopsony and/or monopoly powers held by European chartered companies influenced market conditions and prices. In Europe, chartered trading companies (VOC, British East India Company (EIC), Hudson's Bay Company (HBC) and so on), in principle, had monopoly rights in their domestic markets. In practice, the pricing power of these companies was often limited due to competition from third markets and, to some extent, smuggling. Their influence over prices in overseas purchasing markets also varied: in some cases companies became colonial powers and could thus directly influence both purchase prices and quantities produced; in other cases a company could be a monopsony buyer through negotiated contracts with local potentates; whereas in yet other cases, a company might be merely one among many purchasers and had to pay going market rates. Market conditions in both Europe and Asia changed over time and the convergence or divergence in prices can be related to these changes: increasing competition opened the way for price convergence while increasing control over markets could lead to divergence.
The VOC had a monopoly and was able to control global production for the four fine spices (cinnamon, cloves, mace, and nutmeg). As such, it was the only seller of these goods on world markets and consequentially had complete control over sale prices in Europe. For all other goods, the pricing power of the VOC in Europe was limited by third-market competition. Early modern companies sold their goods (at auctions) in their home markets to other merchants who were in competition with each other in third markets throughout Europe (De Vries 1010, p. 725). For example, Ann Carlos and Frank Lewis (Reference Carlos and Frank D.1999, pp. 707–8) found that developments in fur prices in eighteenth-century London were largely exogenous to the activities of the monopoly seller, the Hudson's Bay Company, which faced competition from French sales in France. As a result, the influence of a company over prices was limited, not only because the same products were brought to Europe by rival companies, but also because goods imported from Asia had to compete on European markets with similar commodities imported from other parts of the world. Indian textiles and Chinese porcelain not only competed with cloth and ceramics produced in Europe, they also encouraged the development of European imitations. If markets across Europe were integrated this would mean that prices in Amsterdam were influenced by those in London, Antwerp, and elsewhere.
In general, it seems that the ever-growing supply of similar products from Asia, the Americas, and other parts of Europe increased competition on European sales markets and restricted the influence of chartered companies on prices. At the same time, growing competition among the various European trading companies in Asia may have pushed up purchase prices there.Footnote 24 In terms of total tonnages shipped the VOC was clearly dominant (as seen in Figure 1), but from the 1720s its share in total tonnages began to decline from more than 70 percent then to roughly 25 percent in the 1790s, mainly due to rising English and French tonnages.Footnote 25 Thus, as the total volume of world trade increased more impressively than income and wages,Footnote 26 and competition in both Europe and Asia intensified over the period, prices could converge despite stagnant transport costs.
As is evident from Figure 2, the VOC sourced commodities from various regions of Asia. In addition, Table 1 notes differing rates of convergence and divergence for different commodities in the seventeenth and eighteenth centuries. I now discuss VOC power in these different markets and the implications for convergence. Partly as a reaction against the forces of globalization (competition and, consequently, rising prices in purchasing markets) the Company attempted to control production and purchase prices in its own territories. A colonial system of production was in place on Ambon and the Banda Islands as from the middle of the seventeenth century, and in Java and Ceylon as from the middle of the eighteenth century. As a result of the rent-seeking practices of an early-modern mercantile company, colonialism in Asia began with Dutch rule over parts of Ceylon, Java, and the Moluccas from the seventeenth century onwards.
Monopoly Control of Spice Markets
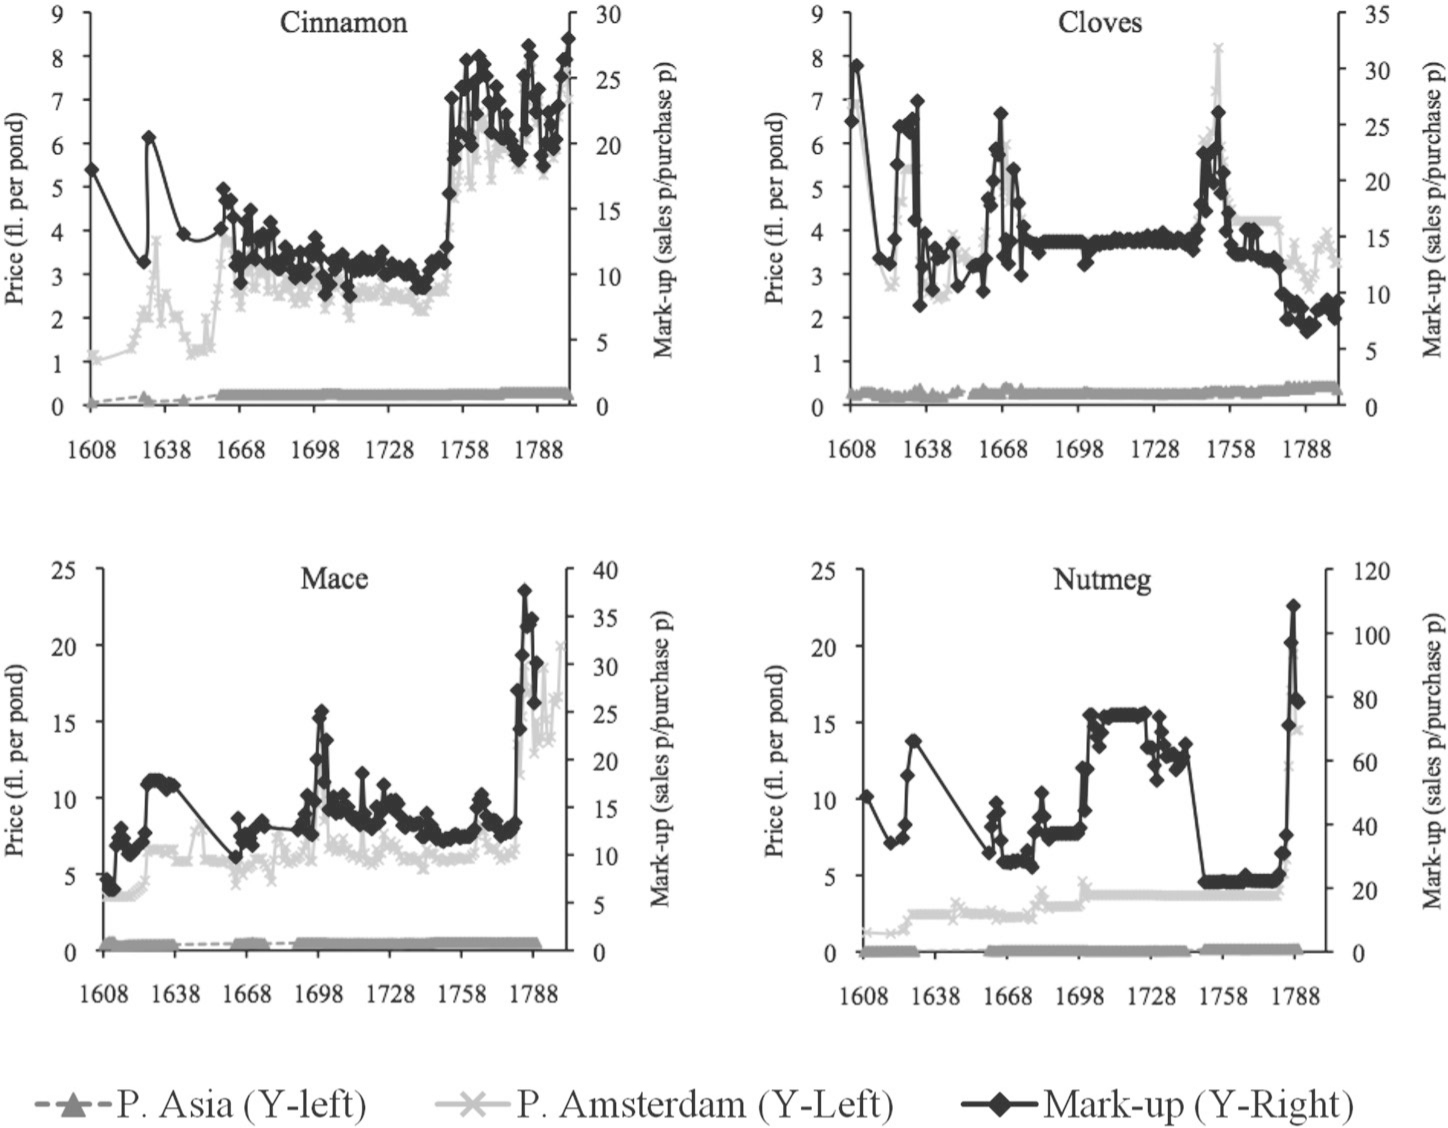
The VOC had monopoly control over the sale of four spices: cinnamon, cloves, mace, and nutmeg, produced in Ceylon (now Sri Lanka) and the Moluccas (in Southeast Asia). As noted in Table 1, the price gaps were clearly largest for these monopoly spices. Yet this is not the complete story as can be seen in Figure 4.
PRICES AND MARK-UPS FOR MONOPOLY SPICES, 1608–1800

The Company secured its position on Ceylon, and thereby the monopoly on cinnamon, in 1658. Purchase prices increased from fl. 0.08 per pond in 1608 to fl. 0.30 per pond in 1660,Footnote 27 a level at which it would remain until 1800.Footnote 28 The trend in sales prices of cinnamon was not merely the result of price-setting by the VOC. In contrast to the other spices, the VOC did not actively try to limit supplies. Rather supply was naturally restricted by the limited availability of fertile lands and the fact that cinnamon peeling was the task of just one of the Sinhalese castes in Ceylon. In the 1740s, population growth, social unrest, and increasing tensions with the Kandyan King (the only remaining indigenous King on the island) leading to a drop in cinnamon supply. With victory over Kandy in 1766, the Company became the sovereign ruler of the entire Ceylonese coast and was better able to secure the monopoly and stabilize supply, resulting in a significant rise in sales prices in Amsterdam from the late-1740s onwards (Jacobs Reference Jacobs2006).
Nutmeg and mace (both harvested from the nutmeg tree) came from the Banda Islands in the Moluccas.Footnote 29 After unsuccessful negotiations with the local heads (the orangkaya) to secure contracts, the VOC used force to obtain control. By 1621 the Company had killed or expelled the entire indigenous population on the islands and implemented a plantation system. The VOC destroyed all nutmeg trees outside Banda,Footnote 30 thereby securing the monopoly and allowing long periods of price stability (Jacobs Reference Jacobs2006, pp. 20–21). A number of volcanic eruptions on one of the islands disrupted nutmeg tree cultivation in the 1690s and temporarily pushed up sales prices of mace (Glamann Reference Glamann1982, p. 102). Trends in nutmeg mark-ups were heavily influenced by changes in the prices paid to the Dutch plantation holders in Banda. Purchase prices were raised in the 1660s and 1750s, possibly in response to complaints from plantation holders about their dire economic situation (Jacobs Reference Jacobs2006, pp. 23–24). A hurricane struck the Banda Islands and destroyed all nutmeg trees in 1778. As recovery was slow and stocks depleted, European sales prices soared in the 1780s.
In a similar manner, the Company used force to secure a monopoly over cloves in the 1650s. The data for cloves provide an interesting example of what happens to mark-ups with and without a monopoly. David Bulbeck et al. (Reference Bulbeck, Reid and Tan1998, p. 21) found that in the sixteenth and early seventeenth centuries local prices and quantities increased. However, in the 1640s the VOC monopoly started affecting prices. Shortages of supply in the 1660s and 1740s temporarily pushed prices up. In the 1770s, French and English traders smuggled clove seedlings out of Ambon in the Moluccas and started growing clove trees elsewhere in Southeast Asia and East Africa. Although these efforts were largely unsuccessful until the second half of the nineteenth century, in combination with increasing production from the 1770s onwards, mark-ups for cloves had, by the end of the eighteenth century, declined to below 10.
Colonial Rule in Java
As in Ceylon and the Moluccas, the Company became the colonial ruler over much of Java over the seventeenth and eighteenth centuries. Although the VOC only hesitantly assumed the role of a colonial power, by the second half of the eighteenth century it had become sovereign ruler of over two-thirds of the island as a result of its involvement in various local power struggles (Jacobs Reference Jacobs2006, p. 230).
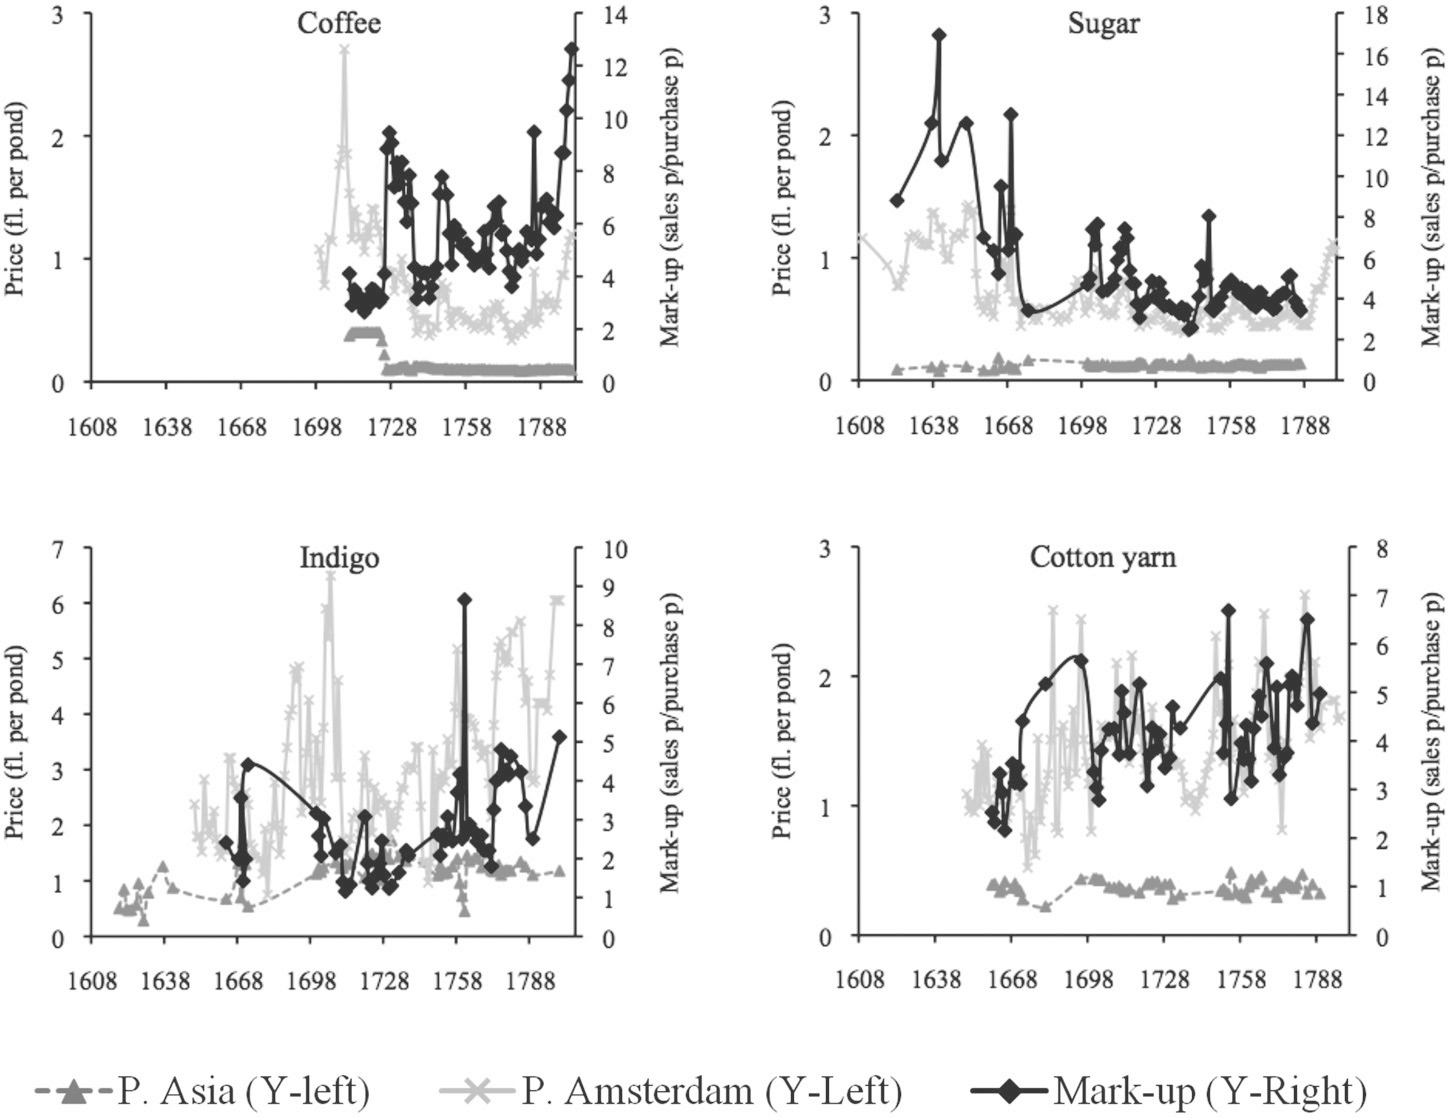
Sugar was already being cultivated on Java before the Dutch arrived. While initially of little interest to the VOC, around the mid-seventeenth century it was realized that there was a big market for sugar in Asia. The Company demanded a certain quantity of sugar at a set price from the millers of sugar each year. However, loss of markets in other parts of the Malay Archipelago and soil exhaustion threatened the sugar industry in the 1730s and again in the 1770s (Jacobs Reference Jacobs2006, pp. 254–57). To save an industry that provided a livelihood for many people on the island, as well as the investments of high-ranking VOC officials (Nagtegaal Reference Nagtegaal1988, p. 138), purchase prices were raised. During the eighteenth century, sugar from the West Indies came onto the European market, resulting in lower sales prices in Amsterdam. Consequently, and as the study by Rönnbäck (Reference Rönnbäck2009) also shows, global sugar prices converged.
During most of the seventeenth century, indigo and cotton yarn were purchased on competitive Indian markets. To circumvent this, the Company encouraged the cultivation of indigo and cotton on Java and imposed forced deliveries at set prices on the Javanese Regents (Van Niel Reference Van Niel2005, pp. 155, 176). At the same time, demand for cotton yarn and indigo was rising in Europe, resulting in higher prices in Amsterdam prices and, thus, higher mark-ups.
Likewise, coffee cultivation was introduced in Java in the early eighteenth century in a reaction to the high prices in Mocha. In the 1710s the Company provided the Javanese Regents with coffee seedlings from Mocha and offered a high purchase price of fl. 0.50 per pond to stimulate cultivation. Coffee cultivation was so successful that total deliveries exceeded 4 million pond by the 1720s. In 1723 the VOC monopolized the market and obliged planters to deliver their entire crop to the Company. Fearing flooding the European market, the purchase price was reduced in the late 1720s and 1730s. In the 1740s the VOC set quotas for what each region was allowed to produce. The European market, however, turned out to be insatiable: coffee consumption increased from less than 1 million to more than 100 million pond per year, without significant decreases in prices until the 1740s. Realizing this (rather late), the Company transformed coffee production into a coercive system in the late 1780s, and Javanese peasants were forced to cultivate and deliver a minimum amount of coffee beans each year (Jacobs Reference Jacobs2006, pp. 260–75). The gap between prices paid in Amsterdam and those in Batavia grew as a result of the VOC's increased control over production and trade on Java (see Figure 5).
PRICES AND MARK-UPS FOR GOODS OBTAINED IN COLONIAL JAVA, 1608–1800

Negotiated Contracts
In other parts of Asia, the VOC relied on negotiated contracts with local potentates to obtain products at relatively low cost. It realized that a monopoly on pepper and effective price control through limitation of production was infeasible due to the widespread cultivation of pepper in the Southeast-Asian archipelago and south-western India. Indeed, in the late sixteenth and early seventeenth centuries, competition among European and Asian traders drove pepper prices up in Southeast Asia. The VOC was allowed to purchase pepper for low prices from the Sultans of Aceh, Padang, Palembang, and Jambi on Sumatra, and from the Sultan of Banten on Java in exchange for military support provided by the Company. Malabar (south-western India) was another important area of pepper cultivation. In the early 1660s, the Company launched an extensive military campaign there and managed to expel the Portuguese from this region. In the process, it forced many local sovereigns into making involuntary pepper deliveries. While certainly a dominant actor, the VOC was never able to completely control the Malabar Coast and deliveries remained variable. Declining supply drove up pepper prices in Europe, in particular in the second half of the eighteenth century, yet the trend for the mark-up for pepper is insignificant for the period 1608–1800 (see Figure 6). The VOC similarly procured tin and copper through contracts at low and relatively stable prices. Tin and copper were also produced in Europe and so mark-ups were low and these goods were mostly used as ballast in ships on their return voyage to Europe.
PRICES AND MARK-UPS FOR GOODS OBTAINED THROUGH CONTRACTS, 1608–1800

Goods Acquired in Competitive Markets
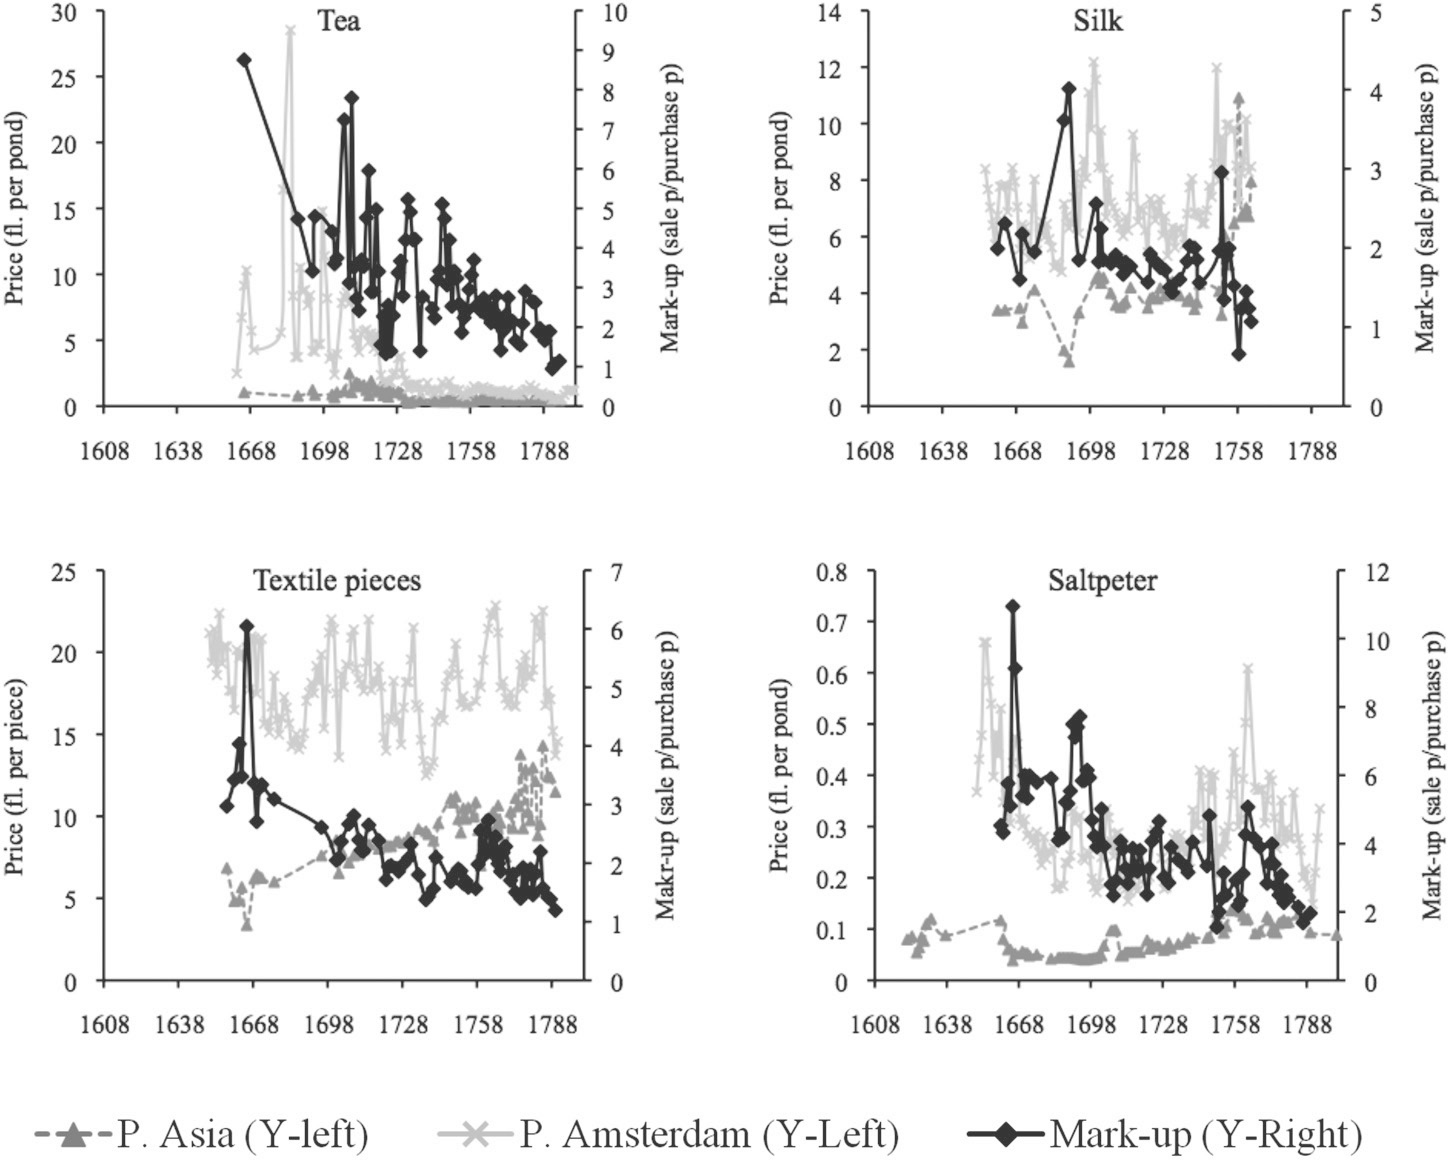
Price convergence can be observed for porcelain, saltpeter, silk, tea, and textiles, which were acquired in the increasingly competitive markets of Bengal, Surat, and the Coromandel Coast (India) and Canton (China). In Figure 7, I show prices and mark-ups for each of these commodities. The trends shown here differ from those put forward by O'Rourke and Williamson (Reference Kevin and Williamson2002), who found little convergence.Footnote 31 Price gaps for these goods together (weighted by their relative importance)Footnote 32 declined by roughly 0.5 percent annually.
PRICES AND MARK-UPS FOR GOODS OBTAINED IN COMPETTIVE MARKETS, 1608–1800

In Bengal, the VOC competed with the Danish, English, French, and Ostend companies, but more importantly, the company competed with Asian merchants dominant in the pre-Plassey period (Chaudhury Reference Chaudhury1995, p. 228). In 1690 the VOC was the principal European buyer, purchasing approximately one-third of the entire saltpeter production of Bengal. Competition with the EIC and the French increased noticeably from the 1730s onwards. Saltpeter purchase prices in Asia increased accordingly: from fl. 0.04 to 0.07–0.08 per pond, respectively. The highest prices (fl. 0.14 per pond) were recorded during the 1750s, at which time indigenous merchants controlled large parts of the saltpeter market. That situation ended with the establishment of English power in 1757, after which the VOC was dependent on the English for its saltpeter purchases (Jacobs Reference Jacobs2006, pp. 126–27) and the prices paid were clearly higher (fl. 0.09–0.11 per pond) than during the period of VOC dominance.
To procure textiles in Bengal, the VOC had to deal with various indigenous merchants, who, having received an order along with a cash advance, delivered the goods to the Company factory in Chinsurah, where they were inspected and the merchants and VOC would (re-)negotiate the price. Om Prakash (Reference Prakash1985, p. 105) notes that the VOC tried to avoid breakdowns in these negotiations “ince the growing competition among the Europeans was increasingly creating a sellers' market.” Similarly, the silk market was very competitive, and European companies were unable to control the prices paid for silk (Chaudhury Reference Chaudhury1995, p. 228). Purchase prices were relatively high, while competition with French and Italian silk in Europe meant that mark-ups were relatively low, and these declined over the eighteenth century as the VOC lost its leading market position to the English (see Figure 7). On the Coromandel Coast and in Surat the market was also characterized by fierce competition with important positions held by middlemen. Various studies on the textile trade and manufacturing have all documented rising textile prices in Bombay, Bengal, and Coromandel (see Gupta Reference Gupta, Riello and Roy2009, pp. 290–91), while in Europe prices were roughly constant or even declining as a result of increased supply by the European companies (ibid., p. 286). As a result, mark-ups on Indian textiles, arguably the most important of all commodities, also declined.
The VOC initially purchased tea in Batavia from Chinese junks that had transported it from China. The result was inconsistent supplies and, as a consequence, a high purchase price which could be more than 3 guilders per pond at the beginning of the eighteenth century (Souza Reference Souza1986, pp. 142, 145–51). In 1729, the VOC started to buy tea directly in Canton, and purchase prices declined from roughly fl. 1.30 to fl. 0.50 per pond for bohea tea, a level at which it remained for the rest of the eighteenth century (Glamann Reference Glamann1982, p. 225; Yong Reference Yong2006, pp. 212–22). Despite the fact the Company had to pursue its business through Chinese intermediaries in Canton and again found itself in competition with the other European trading companies, as well as private European and Asian merchants, purchase prices were more or less stable in China. Most of the narrowing of the price gap was the result of a decline in European prices which was driven by a spectacular increase in supply (Yong Reference Yong2006, pp. 126–28).
CONCLUSION
This article examined price convergence in the Dutch-Asiatic trade. These findings are probably not the final word in the debate on the starting point of globalization. Evidence from other chartered trading companies and routes may suggest different patterns. The data series presented here, despite efforts to the contrary, still contained gaps and sometimes reflect only limited data, raising questions about their reliability and representativeness. Keeping these limitations in mind, I show that for a majority of commodities in the Dutch-Asiatic trade, prices in Europe and Asia converged. There were limits to this process; some prices diverged and mark-ups remained high. Total trade volumes were much larger and price convergence was faster and more universal in the nineteenth century, nonetheless, if one considers a steady growth of trade and price convergence in a significant share of that trade to be a sufficient condition for globalization, then these results suggest early modern origins for globalization.
Price convergence was probably not driven by a decline in VOC transport costs. Rather, it was growth of trade and competition among companies and traders that brought about price convergence in the early modern era. There were large variations in trends between the products traded, which can be explained by differences between commodity markets. Convergence can be observed in all products that were procured in India and China, where the VOC competed with other European companies and Asian merchants. Increasing demand in Asia pushed up purchase prices, while the growth of supply (resulting from growth of trade and increasing competition among the European companies) put downward pressure on sales prices in Europe. Similar competition characterized the pepper trade up until the mid-seventeenth century. By the end of that century, however, the VOC had established contracts with the rulers of many of the major pepper producing regions in Malabar and Sumatra, providing the Company with pepper at low purchase prices. Where diplomacy failed, the VOC employed its guns. In the Moluccas, Ceylon, and Java, the Company established itself as a military and political power and gained complete control over purchasing markets. The VOC may have been a reluctant imperialist, as an extensive military and administrative apparatus increased overhead costs. Where it did exert such power, it tried to make up for these expenses by controlling production and trade in order to keep purchase prices as low as possible.
Power struggles and colonialism go a long way towards explaining the lack of market integration in some markets in the seventeenth and eighteenth centuries. Rather than transport costs, tariffs, or wars, it was the extent of VOC control over commodity markets in Asia, next to its monopoly on fine spices in Europe, which determined trends in price convergence. Various scholars have argued that in the nineteenth century colonialism became one the main drivers of economic globalization as “empires increased trade by lowering transaction costs and by establishing trade policies that promoted trade within empires” (Mitchener and Weidenmier Reference Mitchener and Weidenmier2008). De Vries (Reference De Vries2010 p. 719) also finds that the most of the price convergence in the nineteenth century was limited to areas “brought within colonial and imperial trading structures.” In contrast, in the age of mercantilism, colonialism was in the hands of private companies that had profit maximization as their most important goal. Territorial control was a means to capturing rents and it thereby hindered the process of commodity market integration. The link between globalization and colonization also influenced how globalization affected societies across the globe: in those markets in Asia where colonialism hindered the development of “hard” globalization, its impacts were perhaps the most profound. Clearly, the extent and consequences of an early process of globalization were fundamentally shaped by institutions and institutional changes.
Appendix 1: Constructing the Price Series
All prices were converted to guilder per pond. Following W.G. Wolters (Reference Wolters2008) I assumed for the entire period the following guilder value per coin: rial: 3, rixdollar: 2.4; dubbeltje: 0.10, stuiver: 0.05; duit + 0.0125. The value of the guilder used by the VOC in Asia was lower than the guilder in the Dutch Republic and the Asian currency was therefore referred to as “light money.” The value of the Asian relative to the Dutch guilder fluctuated throughout the seventeenth and eighteenth centuries. According to Els Jacobs (Reference Jacobs2006) one Asian guilder was worth 20 percent less than the Dutch guilder prior to 1743, 16.35 percent less between 1743 and 1768, while after 1768 the value differences disappeared.
There is some confusion regarding the value of the rix-dollar in Asia. Some suggest it is valued at 3 guilders in Asia, while others suggest 2.4/2.5 guilders. In fact, these values could differ according to time and place, depending on whether it concerns “light” or “heavy” money. When not specifically mentioned otherwise, I assume 2.4 guilders, as did others who worked extensively with the VOC accounts (such as Yong Reference Yong2006).
The Bookkeeper-General (BGB) often stated several prices of a good per year (as several ships departed for the Republic every year and for every ship the value and quantity of products was recorded). I took the arithmetic mean price of the observations within the same year. These prices were not weighted with the amount of goods transported, as this would entail a lot of extra work, while not leading to any substantial differences in the prices (as these were generally the same throughout the year). Furthermore, in the Bookkeeper-General database the data are ordered per accounting year, which runs from 1 September to 31 August. While the database does contain information on the exact dates of the departure or arrival, these cannot be extracted from the database in Excel and thus would have to be linked to the data manually. Considering the many thousands of observations, this would be a daunting task, which would not lead to any significant changes in the results. I have organized these prices in the first year; thus if the accounting year was 1701/2, the data were entered in year 1701.
Regarding the data series on sales prices in Amsterdam, I have employed the price series gathered by N. W. Posthumus (Reference Posthumus1943) from Amsterdam price currents (prijscouranten) to impute gaps in the VOC auction data (VOC 4584-4597). Posthumus entered monthly data (when available) as well as annual averages. I took the annual averages. In general, the VOC and Posthumus series were very similar. Below the equations for imputation are given per product.
Cinnamon
Asia: For 1608: In VOC 603 it is noted that the VOC purchases 1 picol (125 pond) cinnamon for 4 real (2.5 guilders). In 1631 (VOC 1099) 15.3 guilder is paid for a picol. All other observations are noted in guilders per pond. Considering the stability of the prices, the years 1664–1665, 1667–1668, 1670–1674, 1676–1688, 1690–1699, 1709, 1727, 1729–1730, 1741–1751, 1790–1799, were linearly interpolated.
Amsterdam: for the period 1609–1800 prices from the VOC auctions were interpolated with Posthumus (1943) using the equation:

Cloves
Asia: Early observations were found in reals/cruzados per bahar (Meilink-Roelofsz Reference Meilink-Roelofsz1962; Souza Reference Souza1986; Prakash Reference Prakash, Ptak and Rothermund1991). These were converted on the basis on a bahar of 436 pond, a real of 2.5 guilder and 1 cruzado + 1.25 real. This leads to similar prices as Bulbeck et al. (Reference Bulbeck, Reid and Tan1998). For the remainder of the period all prices from the VOC accounts were in guilders per pond. These were combined with the prices from Bulbeck et al. (Reference Bulbeck, Reid and Tan1998) to fill some gaps. These price series were largely similar. However, whereas they find prices increased after the 1770s, the VOC data suggests on the other hand prices declined from fl. 0.40 per pond to fl. 0.30–3 in the period 1770–1800. No interpolation.
For the seventeenth and eighteenth centuries, I averaged prices from the VOC sales accounts, Kristof Glamann (Reference Glamann1982) and Posthumus (1948). These series were very similar, but all showed some gaps, which could thus be filled.
Coffee
Asia: All prices were given in guilders or rijksdaalders (2.4 rijksdaalder per guilder) per picol or pond. Prices for coffee were also available from Mason C. Hoadley (Reference Hoadley1994, pp. 220–21) but these diverged from those found in the VOC accounts (those were very similar before 1750, but were much higher after 1750). I have used only the VOC figures. Considering the stability in price (which was fixed by the VOC) the following years were linearly interpolated: 1713, 1715–1718, 1719–1720, 1729, 1732–1733, 1743–1745, 1757, 1764, 1769–1770, 1785, 1787–1788, 1790, 1793–1799.
Amsterdam: the prices from the VOC auctions were interpolated with data from Posthumus with the equation:

Copper
Asia: copper prices given in guilder per picol, pond, or kati. 1 kati + 1/100 picol (VOC Glossarium 2000) + 1.25 pond. One outlier (1747) from the Rendementen was removed as the price was (supposedly) given per rix-dollars, but was over twice as expensive as the surrounding observations. The series was supplemented by data from the rendementen from Surat assembled by Ghulam Nadri (Reference Nadri2008). No interpolation.
For Amsterdam, copper prices were taken only from the VOC auctions as Posthumus does not offer a price series for Japanese copper. Probably as a result of the small mark-ups, Japanese copper was sold in Amsterdam only for a short period.
Cotton Yarn
Asia: all prices were in guilder per pond. There were a number of different varieties of raw cotton: from Bengal, Broach/Cambay/Surat, Coromandel, and Java, as well as observations only stating that it concerned white cotton, or a variety of cotton. There is not enough data to say anything about price differentials between these varieties, but they seem to be in a similar price range. In fact, since the Amsterdam sales only note down “cotton yarn,” with no specifications regarding the variety, suggesting that, as with pepper, they threw the different varieties together. Therefore, I have built one series of average prices. Purchasing prices from the Rendementen later in the eighteenth century were consistently below those from the BGB. These observations were dropped from the analysis. Doing so does not affect the conclusions and including them would only strengthen the observation that there was no price convergence (lowering prices in Java would lead to an increased price gap). As with coffee, Hoadley (Reference Hoadley1994) offers a diverging price series for cotton, which are not included in the calculations. No interpolations.
Amsterdam: the series from the VOC auctions and Posthumus could differ somewhat. I have taken only those prices from the VOC auctions. However, in order to fill a significant gap (1761–1770) in those prices, Java cotton prices from Posthumus were interpolated via the equation:

Indigo
Asia: All prices for indigo given in guilders per pond. As in the case with cotton, there were different varieties and the average price was taken. Hoadley again offers a competing price series, which is not used. The outlier of 1761 is based on 13 observations (reflecting a total of 124,884 pond of indigo shipped to the Republic) and is therefore assumed to be genuine.
Amsterdam: the VOC series were extrapolated with Posthumus:

Asia: Some early price evidence was available in reals per bahar for: 1603–1615: M. A. P. Meilink-Roelofsz (Reference Meilink-Roelofsz1962, p. 275–76, p. 401 note 74); 1603: J. K. J. De Jonge and M. L. Deventer (1862–1888, vol. 3, p. 157); 1608: VOC 652. For some of the seventeenth century observations from the VOC accounts prices could be noted including and excluding expenses on “ockels,” the baskets in which the mace was transported. The difference in price was negligible (0.003 guilder per pond). Prices for mace could also be noted down per kati Banda, which was equal to 5.5 pond.
Amsterdam: The VOC auctions were interpolated with the Posthumus series

Nutmeg
Asia: early observations were given in real per bahar: 1612: Meilink-Roelofsz. Conversion based on 2.5 guilder per real and 436 pond per bahar. The remaining observations were in guilders per pond. Prices could be the same for years on end, which allowed interpolation.
Amsterdam: see mace. Interpolation:

Pepper
Asia: 1 real + 0.4 guilder. Unless stated otherwise, following Bulbeck et al. (1998, p. 182) 1 bahar pepper + 180 kg + 364 pond. A quintal + 1/4th bahar + 91 pond. I created a time series using all observations for pepper from different locations (Palembang, Banten, Priaman, Banjarmasin, etc.) and varieties (but excluding white pepper and long pepper'for which there are separate data in the Amsterdam sales). In order to get the average price each year, the data (2618 obs.) were regressed on year dummies.
Amsterdam: gaps in the VOC price series were interpolated with Posthumus:

Saltpeter
Asia: all prices given in guilders per pond. Prices for the seventeenth century could be given in a few varieties; refined, unrefined, Bengal, or Agra. Refined saltpeter from Bengal was the dominating kind, and it can be assumed that in case no further specification was given, it concerned Bengal refined saltpeter. For a few years when prices were completely stable gaps were linearly interpolated (1685–1686, 1688, 1691–1694, 1696–1699, 1707, and 1713–1717).
Amsterdam: gaps in the VOC price series were extrapolated with Posthumus (removing the outlier 1745):

Silk
Asia: prices were given in guilders or real (fl. 0.4) per pond or kati (1.25 pond). There were three different varieties of silk: Persian, Bengal, and Chinese. For Persian silk there were so few observations that only for one year the mark-up ratio could be calculated and was therefore omitted from the analysis. No interpolation.
Amsterdam: for the same three varieties of silk we have prices from the VOC auctions and Posthumus for Amsterdam. However, in the earliest auctions there is a price series of silks with no further specification. These were used to extrapolate the Bengal silk series:

The VOC Chinese silk series were extrapolated with the Posthumus data:

Data from both series were employed to generate an average series for silk with as many observations as possible.
Sugar, Candy
Asia: All prices given were in guilders per pond. Hoadley (Reference Hoadley1994) also gave sugar prices, which were not used. As those prices were slightly higher at the end of the eighteenth century and including them would only strengthen the picture of price convergence.
Amsterdam: price series for sugar are available from the VOC sales and Posthumus. Only Posthumus noted that it concerned kandijsuiker or sugar candy. Considering the fact the prices of the VOC auction prices were much below that price, it can be assumed this concerns poedersuiker (powdered sugar, or caster sugar). Therefore, we interpolated the Posthumus series with the kandijsuiker series (rather than the other way around):

Sugar, Caster (Not Included Separately in the Analysis, Similar Trends as Sugar, Candy)
Asia: poedersuiker all prices given were in guilders per pond. For the seventeenth century, different specifications could be given, such as “white,” “diverse,” “from Japara,” or “from Batavia.” Price differentials were negligible and due to limited observations I have used all to create a single price series (taking the arithmetic average in case of multiple observations in one year). To fill gaps in the eighteenth century, the series from the Bookkeeper General were extrapolated with data on Surat from Ghulam Nadri (Reference Nadri2008):

Amsterdam: see Sugar, Candy. The VOC series are now interpolated employing the Posthumus series.

Tea
Asia: all prices were given in guilders per pond. There were several types of tea: bohea, bing, white. In the early observations some were referred to only as “Chinese” tea. Since all teas were Chinese and the price differences in the VOC data between were not very big I averaged the prices of the different varieties (in case of multiple observations). The price series were merged with data from G. B. Souza (Reference Souza1986, p. 144), which also seems to include different varieties, as well as the average price taken from the data on bohea tea by Liu Yong (Reference Yong2006, pp. 212–22). No interpolations.
Amsterdam: I combined the series from Posthumus and the VOC auctions. In case prices from both series were available in one year the arithmetic average was taken. The correlation was weak, but the differentials small (Average CV + 0.25).
Textiles
Asia: the VOC traded in a variety of textiles, baftas, guinea cloth, salempuris, of different colours, sizes, and qualities. I took average prices on the guinea (average quality, bleached) cloth from the Coromandel Coast as found in the rendementen, invoices, and BGB. Qualities and specific sizes could differ per batch, but is not specified in the sources. Therefore these series are tentative.
Amsterdam: in the VOC auctions the “because of lack of acquaintance with a number of textiles” the VOC accountants put the information for textiles in the “undeterminable category” of catoene lijwaten (see Glamann Reference Glamann1982, p. 143). These were linked to the price level on guinea cloth from Glamann via the equation (thus increasing the prices, no influence on trends).

These figures are clearly not ideal, yet, considering the importance of textiles in the Euro-Asian trade it is believed still worthwhile to give some estimates of general trends and it seems quite certain that over the period 1650–1800 prices for textiles in Amsterdam fluctuated around the same level, while in India prices increased (also see Gupta Reference Gupta, Riello and Roy2009). According to Hameeda Hossain (Reference Hossain1988, p. 68) sales prices in London were stable or declined in the later eighteenth century.
Tin
Asia: All prices given in guilders per pond. There could be observations for three types of tin: Bancas, Malaysian, or Siamese. Price differentials were generally small or not existent, and since for Europe it was not defined which of these varieties was sold, it is assumed that, as in the case of pepper and cotton yarn, they mixed these varieties. Therefore these series were combined, and in case of multiple observations in a year, the arithmetic mean price was used. N.B.: there was only one observation for a purchasing price for tin in 1746 from a rendement for China (VOC 2710, ff. 1208–1263), since this was an outlier this data point was of questionable reliability and representativeness and therefore omitted from the analysis: this has no effects on the observed trends or conclusions based on these series.
Amsterdam: the VOC auction prices were extrapolated with Posthumus:

Porcelain
Margins from C. J. A. Jörg (1982, pp. 221–23). No interpolation.
Appendix 2: Summary Statistics and Robustness Checks
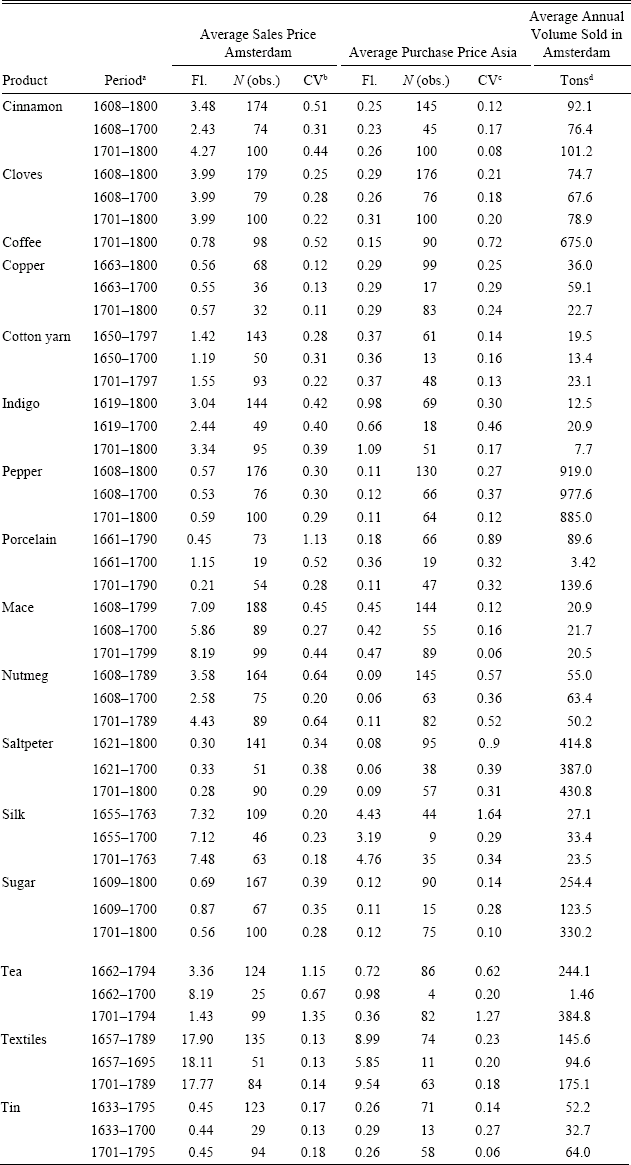
Appendix Table 1 provides information on the summary statistics of the database on prices. It shows the average sales prices in Amsterdam and purchase prices in Asia in the two centuries. It also shows to what extent these prices fluctuated over time (the coefficient of variation). Finally it shows the annual quantities traded in tons per good, in order to get some sense of the relative importance of each of these goods in the total trade.
Summary STATISTICS DUTCH-ASIATIC TRADE, 1608–1800

Appendix Table 2 shows the trend regressions (following the same regression equation as in the main text) using three different measures of the price gap. Next to the mark-up (sales price / purchase price), it shows price gap between the purchasing and sales market divided by the mean price in those two markets (GAP1). Yet, as those series may show convergence as a result of a positive demand shock (unrelated to globalization) that drives up the mean price, I calculate a third measure showing the absolute price gap corrected for inflation (GAP2). As can be seen in the table, these measures largely produce similar results, although there are a few exceptions that are shown in the table.
+ROBUSTNESS CHECK, TRENDS IN 3 DIFFERENT MEASURES OF PRICE DIFFERENCE+