Introduction
Finishing bulls are fed high-concentrate diets to promote high daily gains. Some diets contain a high proportion of cereal grains and a low proportion of rough forages to maximize energy intake while maintaining ruminal activity. These high-concentrate diets provide a high availability of energy-rich compounds for microbial growth in the rumen and hence for the animal. They are also characterized by a low mastication and rumination activity associated with a reduced buffering capacity of ruminal digesta, which can result in digestive disturbances such as subacute ruminal acidosis (Martin et al., Reference Martin, Brossard and Doreau2006). This type of acidosis is characterized by the production of large quantities of volatile fatty acids, inducing periods of depressed ruminal pH (about 5.5 to 5.0) (Martin et al., Reference Martin, Brossard and Doreau2006). To minimize problems of acidosis, cattle feeders increase dietary concentrate incrementally. However, acidosis phenomena can appear even with a gradual transition to grain (Bevans et al., Reference Bevans, Beauchemin, Schwartzkopf-Genswein, McKinnon and McAllister2005).
Cattle ingest their food essentially during the daytime, with two major peaks of eating, at the beginning and at the end of the day (Jarrige et al., Reference Jarrige, Dulphy, Faverdin, Baumont and Demarquilly1995; Baumont et al., Reference Baumont, Doreau, Ingrand and Veissier2006). An experiment with Limousin bulls fed a 45% maize silage diet suggests that bulls regulate their intake activity to achieve a balanced intake in terms of concentrate and long-fibre roughage to meet their behavioural and physiological requirements (Cozzi and Gottardo, Reference Cozzi and Gottardo2005). Mastication activity is a necessity for ruminants and is a component of animal behaviour that has to be taken into account to ensure their welfare (Baumont et al., Reference Baumont, Doreau, Ingrand and Veissier2006). A minimum threshold of 10% long-fibre roughage on a dry matter basis for beef cattle diets has been proposed to avoid pathological conditions and poor welfare (EU-SCAHAW, 2001).
In Western countries, consumers feel concerned by animal welfare (Ouedraogo, Reference Ouedraogo1998). European legislation provides a framework to ensure animal welfare mainly in intensive production systems such as for pigs, laying hens or calves. In intensive management systems such as bull finishing, where animals are expected to exhibit high production levels, feeding programmes planned for maximum efficiency diverge from natural ruminant diets. However, for consumers, naturalness is often considered as a guarantee of welfare (Harper and Henson, 2001).
The objectives of this study were (i) to assess how the forage-to-concentrate ratio of the diet affected the behaviour and feeding patterns of bulls, and (ii) to analyse the relation between changes of feeding behaviour and ruminal pH. The ultimate aim was to gain a fuller understanding of how animals adapt to different diets with metabolic risks.
Material and methods
Animals, housing and diets
Twenty-four bulls of the ‘Blond d’Aquitaine’ breed were purchased at weaning from commercial farms. At the beginning of the experiment in autumn, the animals were 267 days old (±22) and weighed 326 kg (±21). They were assigned to six groups of four animals each. The groups were balanced for BW and size, age and intake measured on a maize silage diet offered ad libitum for 6 weeks in a pre-experimental period. Each group was housed in a separate pen with a space allowance of 9.4 m2 per bull. The pens were contiguous. The feeding area of the pens was equipped with individual electronic gates linked to a computer. Each bull was fitted with an electronic transponder (Dairy Gate, E.F.E.I., France) and could gain access to a given individual feeding place. Every 10 s, gate position (open/closed) was recorded and the proportion of recordings with the gate open was calculated every minute. The software to monitor ingestion time was developed at INRA for this experiment. Each pen contained a water trough, allowing free access to drinking water.
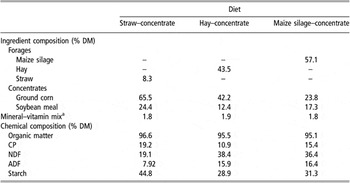
During the pre-experimental period, the bulls were fed a maize silage and soybean meal diet. After a 2-week feeding transition, when the new feeds were introduced gradually, the experimental diets were dispensed from 9 January 2006, considered as Day 0 of the finishing period. Three experimental diets were supplied once daily at 0900 h, each diet being allocated to two groups: (i) a diet composed of wheat straw plus concentrate, (ii) a diet composed of upland natural grassland hay plus concentrate and (iii) a diet composed of maize silage plus concentrate. For the first diet, concentrate was given in the individual feeder and straw was given in a collective rack. For the other two diets, forage and concentrate were given in the same feeder. For these diets, forage was dispensed ad libitum (10% of refusals) and the concentrate was adjusted. The expected forage-to-concentrate ratios were 40/60 in hay–concentrate and 60/40 in maize silage–concentrate diets. Diet compositions were maintained by daily adjustment of offered amounts of concentrate depending on the amounts of forage refusals on the previous day. In the straw–concentrate diet, ground corn was fed ad libitum, and the bulls had free access to a straw rack. These diets were established according to INRA allowances (Garcia et al., Reference Garcia, Agabriel and Micol2007) to allow growing rates of 1800, 1350 and 1600 g/day for the straw–concentrate, hay–concentrate and maize silage–concentrate diets, respectively. In addition, 150 g/day of a commercial mineral–vitamin premix (Galaphos Midi Herbe GR, CCPA, Aurillac, France) was added to all the diets. Ingredients and chemical composition of the experimental diets as consumed are presented in Table 1.
Ingredient and chemical composition of the experimental diets consumed by the young bulls

aComposition (g/kg): Ca, 180; P, 60; Mg, 50; Na, 50; Cu, 1.3; Zn, 6.0; Mn, 3.5; I, 0.06; Co, 0.032; Se, 0.02; vitamin A, 600 000 IU; vitamin D3, 120 000 IU; vitamin E, 1300 IU.
Bulls were weighed every week at the same hour and were finished until their average weight within a group reached 650 kg.
Measurements
Time budget
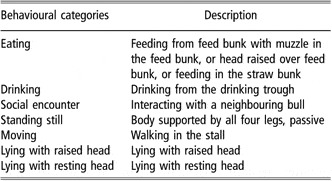
Once during the pre-experimental period (Week −3) and four times during the finishing period (Weeks 0, 5, 9 and 14), the time budget of the bulls was estimated from 24-h video recordings made to describe the pattern of daily activities. Six video cameras (Sony SPT-M128CE, Sony, Japan) were fixed above the finishing pens, with one camera covering two pens. Each camera was connected to a videotape recorder (Sony SVT-1000P). From the video recordings, the behaviour of the bulls was subsequently encoded on a computer using The Observer version 5 software (Noldus, Noldus Information Technology, Wageningen, the Netherlands). The behaviour of each bull was scanned every 10 min (144 recordings per animal per day). Seven behavioural categories were isolated: eating, drinking, social encounters, standing still, moving, lying with raised head and lying with resting head (Table 2). These categories were mutually exclusive. The eating category included both concentrate- and forage-eating activities. Two different postures were considered, lying and standing. Standing included eating, drinking, social encounters, standing still and moving. At each scan, the number of animals eating at the same time in each pen was also recorded.
Description of the behavioural categories used during scan sampling

Feeding behaviour
Individual feed offered and refusals were measured and recorded on 5 consecutive days per week throughout the experiment to evaluate dry matter intake (DMI). In the straw–concentrate diet, only mean refusals of straw for all the animals in a pen were measured since there were no individual straw racks. Dry matter content of feeds was measured twice a week (103°C, 24 h). Other feed samples were taken at the same frequency for chemical analyses. After drying (60°C, 48 h), samples were pooled at the end of the experimental period. These samples were ground (0.8 mm screen) and analysed for organic matter (OM), CP (N × 6.25), NDF, ADF and starch. OM content of feeds was determined by ashing at 550°C for 6 h (AOAC, 1990). Nitrogen was analysed by the Kjeldahl procedure (AOAC, 1990). The NDF and ADF contents were determined by sequential procedures (Van Soest et al., Reference Van Soest, Robertson and Lewis1991) after pretreatment with amylase and were expressed inclusive of residual ash. Starch was analysed by a polarimetric method (AFNOR, 1985).
Feeding behaviour was estimated from the electronic gate recordings. Once during the pre-experimental period (Week 6) and four times during finishing (Weeks 4, 8 and 14 for the three diets and Week 19, 22 or 24, respectively, for straw–concentrate, maize silage–concentrate and hay–concentrate diets), the daily eating time of each bull was estimated over the 7 days of the week as the mean daily time during which its feeding gate was open. According to Metz (Reference Metz1975) and Baumont et al. (Reference Baumont, Doreau, Ingrand and Veissier2006), we considered that inter-meal intervals lasted at least 4 min. This feeding behaviour estimation did not include straw ingestion.
Ruminal pH
To obtain a spot measure of ruminal pH, a fluid sample (40 ml) from the ventral part of the rumen was collected by rumenocentesis from each bull after local disinfection. The ruminal fluid was collected 4 to 5 h after the morning feeding once weekly at Weeks −3, 0, 2, 6 and 11 of the finishing period and 1 day before slaughter (i.e. between Weeks 16 and 27 according to the slaughter date). Ruminal pH was determined immediately with stirring using a digital Knick Portamess pH-meter (Ag/AgCl electrode).
Statistical analyses
The following behavioural variables were evaluated for each animal on each day of recording:
• From the video recordings: proportion of time spent by each bull in each behavioural category estimated by the percentage of scans for every specific activity, and the synchronization of eating behaviour, i.e. the number of bulls within a group eating at the same time.
• From the data provided by the electronic feeding gates: daily eating time, number and mean duration of meals, and intake rate calculated as the ratio of feed intake to eating time (g DMI/min). In addition, for each animal and each day, we estimated variations in time spent feeding by calculating the standard deviation of the time spent eating per hour. The greater the variations between hours, the fewer and larger were the meals the animal ate.
• DMI was averaged weekly from Week 0 to slaughter for each animal.
The percentages were transformed by square root-arcsine to achieve homogeneity of the variances and allow analyses of variance (Mitlohner et al., Reference Mitlohner, Morrow-Tesch, Wilson, Dailey and McGlone2001). The statistical analyses of behavioural variables were performed using the PROC MIXED procedure of SAS (Littell et al., Reference Littell, Henry and Ammerman1998) for repeated measurements. The animal was considered as a random effect. Diet, week of control, group nested within diet and interaction between diet and week were tested as main fixed effects. Weeks of recording corresponded to repeats in time. In DMI, week was considered as a regressor since data were available every week and intake was assumed to increase throughout the finishing period. For each dependent variable, the covariate was the measurement of the same variable during the pre-experimental period. Various variance–covariance error structures were tested. The spatial power structure was retained because it produced the lowest Akaike information criteria (Akaike, Reference Akaike1974). This structure takes into account the irregular distance between two repeated measures. When significant differences were detected, differences among means were tested using the Tukey–Kramer multiple comparison test and were declared significant at P < 0.05.
Results
Time budget
The time budget of the bulls did not differ between treatment groups before the experimental period, i.e. when the bulls received the same diet, namely a maize silage and soybean meal diet. This indicates that when fed an identical non-experimental diet, treatment groups did not differ for this variable. On average, the bulls spent about 15% of the time eating and 70% lying.
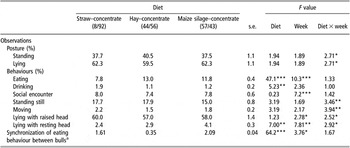
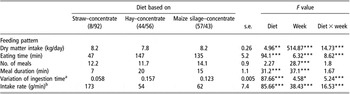
Thereafter, during the finishing period, the bulls spent 78% of the time inactive, either lying (61%) or standing still (17%). They ate for 11% of the time and had social encounters for 7% of the time (Table 3). Major differences between diets were observed only for activities directly linked to feeding. Compared with the bulls receiving the forage diets, the bulls fed the straw–concentrate diet spent less time eating (7.8% of scans v. 11.8% and 13.0% for maize silage–concentrate and hay–concentrate diets, respectively) and more time drinking (1.9% of scans v. 1.2% and 1.1% for maize silage–concentrate and hay–concentrate diets, respectively). The interaction between diet and week was significant for some activities. In Week 9, the bulls receiving the straw–concentrate diet spent more time moving (P < 0.05) than those receiving the diet based on hay (data not shown). Between Weeks 9 and 14, the proportion of time spent lying with resting head increased significantly for the bulls receiving the diet based on maize silage (P < 0.001), whereas it remained stable for the other diets (data not shown).
Effect of diet, week of control and group on daily percentages of posture and behaviours

*P < 0.05; **P < 0.01; ***P < 0.001.
aNumber of bulls eating at the same time within a group.
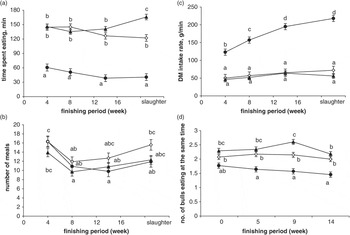
The synchronization of eating activity estimated from video recordings was always lower for the bulls given the straw–concentrate diet (Figure 1d) than for the other diets (P < 0.001) and decreased with time, although the difference was not significant (P > 0.05). Thus the bulls given the straw–concentrate diet ate less and less simultaneously throughout the finishing period.
Effect of diet on feeding behaviour estimated from electronic feeding gates: time spent eating (a), number of meals (b) and intake rate (c) per day and synchronization (i.e. number of bulls within a group of four eating at the same time) estimated from video recordings (d). Diets were straw–concentrate (●); hay–concentrate (▴); and maize silage–concentrate (◊). Diets: straw–concentrate = 8% straw and 92% concentrate; hay–concentrate = 44% hay and 56% concentrate; maize silage–concentrate = 57% maize silage and 43% concentrate. a,b,c,dMeans that do not have a common superscript letter differ, P < 0.05.

Feeding behaviour
During the pre-experimental period, the DMI (5.6 ± 0.6 kg) did not differ between treatment groups, indicating that when fed an identical non-experimental diet, treatment groups did not differ for this variable.
On average, the DMI increased from 6.03 ± 0.84 kg at the beginning of the finishing period to 9.00 ± 1.16 kg at the end, but to an extent that ranged between diets and weeks (Table 4). For the straw–concentrate diet, the quantity of daily ingested straw was 0.46 ± 0.03 kg at the beginning, increased progressively up to a maximum of 0.88 ± 0.05 kg in Week 8 and then fluctuated between 0.6 and 0.8 kg per day until the end of the finishing period.
Effect of diet, week of control and group on feeding behaviour recorded continuously using electronic feeding gates

*P < 0.05; **P < 0.01; ***P < 0.001.
aStandard deviation of the time spent eating per hour.
bCalculated as the ratio of daily feed intake to total daily eating time.
The time spent eating (195 ± 50 min) and the number of meals (14.1 ± 4.7) per day during the pre-experimental period did not differ between treatment groups, indicating that when fed an identical non-experimental diet, treatment groups did not differ for this variable.
Thereafter, whatever the finishing stage, the bulls fed the straw–concentrate diet spent less time eating (47 min) than the bulls fed the two other diets (141 min) (Table 4). An interaction between diet and week of control was observed: the eating time increased slightly at the end of finishing in bulls receiving the hay–concentrate diet, whereas no such change was observed for the other diets (Figure 1a). The number of meals was not different between diets. For the three diets, the number of meals decreased significantly from 15 to 11 between Weeks 4 and 8 (P < 0.001). It tended to increase again at the end of the finishing period for the maize silage–concentrate and the hay–concentrate diets, but the difference was not significant (Figure 1b).
The intake rate ranged widely between diets, from 58 g/min on average for hay–concentrate and maize silage–concentrate diets to 173 g/min for straw–concentrate diet (P < 0.001, Figure 1c). Changes over time in intake rate ranged between diets (P < 0.001 for the interaction between diet and week of control), with a marked increase for the straw–concentrate diet (+77%) and no change for the other diets.
The meals were shorter for bulls fed on straw–concentrate diet than for bulls receiving the other diets (P < 0.001, Table 4). For all three diets, meal duration decreased significantly (P < 0.001) as finishing proceeded (data not shown) but the decrease was prompter for the straw–concentrate and for the hay–concentrate diets and more gradual for the maize silage–concentrate diet.
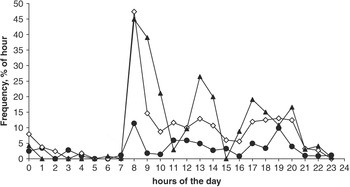
The standard deviation of the time spent eating per hour was significantly lower (P < 0.001) for the bulls fed the straw–concentrate diet (0.058) than for those fed the other diets (0.123 and 0.157, respectively, for the maize silage–concentrate and the hay–concentrate diets). Figure 2 illustrates the diurnal pattern of eating activity on Week 14 at about two-thirds of the finishing period. At the beginning of the finishing period, the bulls fed on maize silage or hay displayed two peaks of eating activity, the main one at the moment of feed delivery in the morning and a smaller one at the end of the diurnal period (data not shown). However, comparing such patterns at different stages of finishing, for hay–concentrate and maize silage–concentrate treatments, the eating activity tended to be distributed slightly more at the end of the finishing period, with a third peak of eating activity appearing in the middle of the day, particularly for the maize silage–concentrate diet (Figure 2). In the straw–concentrate diet, the bulls tended to take fewer meals with time and tended to spread them more evenly over the diurnal part of the day.
Diurnal pattern of eating activity on Week 14 of finishing according to the diet and estimated from data provided by the electronic feeding gates. Diets were straw–concentrate (●); hay–concentrate (▴); and maize silage–concentrate (◊). Diets: straw–concentrate = 8% straw and 92% concentrate; hay–concentrate = 44% hay and 56% concentrate; maize silage–concentrate = 57% maize silage and 43% concentrate.

Ruminal pH
During the pre-experimental period with a common diet, the ruminal pH of bulls did not differ between diet treatments (pH = 6.54 ± 0.17).
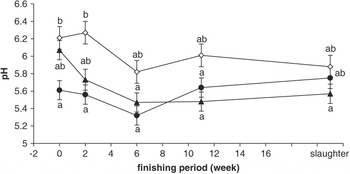
Figure 3 shows the time course of ruminal pH during finishing for bulls receiving the three diets. Over the whole finishing period, the bulls fed the straw–concentrate diet had a ruminal pH that was significantly (P < 0.05) lower (5.57) than the bulls receiving the other diets (5.67 for the hay–concentrate diet and 6.04 for the maize silage–concentrate diet). This difference was more evident at the beginning of finishing. In Weeks 0 and 2, the ruminal pH of animals fed the three diets decreased with weeks of finishing but not to the same extent between diets. The bulls on the straw–concentrate diet exhibited a lower ruminal pH than those on the maize silage–concentrate diet (P < 0.05) with the bulls on the hay–concentrate diet being intermediate. Later, in Weeks 6, 11 and 21, significant differences were no longer observed between the diets (P > 0.05). This was due to an increase, albeit non-significant, in the ruminal pH of bulls fed the straw plus concentrate diet; this tended to decrease for the animals fed the other two diets.
Time course of ruminal pH according to the diet on the finishing period of bulls. Diets were straw–concentrate (●); hay–concentrate (▴); and maize silage–concentrate (◊). Diets: straw–concentrate = 8% straw and 92% concentrate; hay–concentrate = 44% hay and 56% concentrate; maize silage–concentrate = 57% maize silage and 43% concentrate. a,bMeans that do not have a common superscript letter differ, P < 0.05.

Discussion
This study conducted in Blond d’Aquitaine bulls was designed to assess the effects of three different diets on daily activities, feeding behaviour and ruminal pH to assess the impact of the diet characteristics on animal welfare. The achieved forage-to-concentrate ratios were 8/92, 44/56 and 57/43, for the straw–concentrate, hay–concentrate and maize silage–concentrate diets, respectively, and the finishing period lasted for 138, 181 and 155 days for the three diets, respectively. The daily intake and the growth performance of the bulls were consistent with the intake capacity and the expected daily gain (Micol et al., 2007). The average daily gain during the finishing period (for the same final live weight of 650 kg) was 1860, 1490 and 1710 g per day for straw–concentrate, hay–concentrate and maize silage–concentrate diets, respectively. Consequently, the differences observed in feeding behaviour and daily activities can be attributed to the characteristics of the different diets. The results show that these bulls stayed inactive, lying or standing still 78% of their time and spent 11% of their time eating. When fed a straw–concentrate diet, they spent less time eating than bulls fed on maize silage–concentrate or hay–concentrate diets and took shorter meals spread throughout the day with a higher intake rate. These bulls also had a lower ruminal pH during the first 2 months of the finishing period.
In this study, video recording data enabled us to estimate the time spent in different activities during the day. To describe the time budget of the bulls, the scan sampling technique was used with a relatively short interval length of 10 min between successive recordings. Though less accurate than continuous behavioural sampling, this method is accurate for measuring durations of standing, lying and feeding behaviours because these last generally longer than 10 min, but not for behaviours with shorter durations such as drinking, moving or social behaviour (Mitlohner et al., Reference Mitlohner, Morrow-Tesch, Wilson, Dailey and McGlone2001). Hence, data on these short activities will be interpreted with caution in this discussion.
The results of this study are generally within the range of published data on time budgets in cattle (Devries et al., Reference Devries, Von Keyserlingk and Beauchemin2005). In these studies, lying time ranges between 54% and 72% of the day in dairy or beef cattle. In our experiment, as in Rotger et al. (Reference Rotger, Ferret, Manteca, De La Torre and Calsamiglia2006), the time spent lying was always greater than the time spent standing. Drinking time represented between 1% and 2% of the day, consistent with other experiments. The proportion of the day spent eating in our study was consistent with results reported by Rotger et al. (Reference Rotger, Ferret, Manteca, De La Torre and Calsamiglia2006) in beef heifers (10%) and by Cozzi and Gottardo (Reference Cozzi and Gottardo2005) in bulls (6%) based on video recordings. However, this proportion was lower than data reported for dairy cattle (Albright, Reference Albright1993). This difference may be partially explained by the usually higher concentrate level of diets used in beef feedlot studies than in dairy cow studies. In addition, dairy cows generally eat more and for longer than bulls to meet milk production needs.
There was no difference between bulls in their behaviour apart from feeding activities. We did not observe any aggression between animals, but we studied social encounters and found no difference between diets. Unlike Bozkurt et al. (Reference Bozkurt, Ozkaya and Ap Dewi2006), we did not observe more aggressions in bulls fed the high-concentrate diet. However, the scan sampling method used may not be precise enough to highlight differences. Even so, the animal caretakers did not observe aggressions between the bulls. Bozkurt et al. (Reference Bozkurt, Ozkaya and Ap Dewi2006) conducted a study with bulls of different breeds within a group, which may have influenced the amount of social interactions. Some authors have also described some stereotypic behaviours in confined cattle. When 16-month heifers were not supplied roughage in sufficient amounts, in terms of time needed to eat it, they developed non-nutritional activities such as repeated rolling of the tongue (Redbo and Nordblad, Reference Redbo and Nordblad1997). Such activities have been described as indicators of frustrated feeding activity, related to poor welfare, and have been associated with restriction of movement and low roughage intake. In the present trial, the video recordings were not of sufficient quality to detect these behaviours correctly. The occurrence of such abnormal behaviours may also have been forestalled since bulls fed the concentrate diet were offered roughage ad libitum through free access to a straw rack.
In the conditions of this study, a high-concentrate diet composed of 8% straw and 92% concentrate did not disturb the bulls’ time budget.
The feeding behaviour was assessed using the electronic feeding gates measuring the proportion of the time the gate was open, considered as the ingestion time. For the straw–concentrate diet, only the concentrate eating time was assessed by the feeding gates and no information was provided concerning straw eating time. However, from video data, we recorded the time spent feeding whatever the food (hay, silage, concentrate, straw). The same differences between diets as with feeding gates were observed. Thus we can consider that feeding gate recordings give reliable information about feeding behaviour with the three diets. However, we are aware that the intake rate presented for the straw–concentrate diet was overestimated since the time spent eating straw was not recorded through the electronic gates.
In this study, the eating time assessed by means of the electronic feeding gates ranged from 47 min for the straw–concentrate diet to 187 min for the hay–concentrate diet, the maize silage–concentrate diet being intermediate. These results were in line with those reported in the literature in experiments using monitored feeding systems (Dado and Allen, Reference Dado and Allen1993). The bulls fed a high-concentrate diet spent less time eating, probably because concentrate feeds are more rapidly ingested, being more readily prehensible and generally more palatable than forages. Fibre needs and rumen fill were met by straw intake. Similar results have been obtained in dairy cows (Nielsen et al., Reference Nielsen, Veerkamp and Lawrence2000) and in dairy goats (Abijaoude et al., Reference Abijaoude, Morand-Fehr, Tessier, Schmidely and Sauvant2000), with a decrease in time spent eating as the forage level of the diet decreased. In goats, the time spent eating was more than 1 h longer (379 min v. 305 min on average) when the forage-to-concentrate ratio was 55 : 45 than when it was 30 : 70. Similarly, in dairy cattle, daily eating time was nearly 1 h longer for a high-fibre diet (35% NDF) than for a low-fibre diet (25% NDF).
Eating time was distributed over 12 to 14 meals, with no significant difference between the three diets. From the beginning of the finishing period, the bulls fed a diet with a high concentrate-to-forage ratio (92%) took shorter meals than bulls fed the other two experimental diets composed of maize silage–concentrate and hay–concentrate. In addition, with time, these bulls tended to take fewer meals and to spread them more evenly over the diurnal part of the day. This was observed on data collected from the feeding gates, with only time spent eating the concentrate taken into account as well as from video recordings, with both time spent eating concentrate and straw taken into account (data not shown). This was achieved by decreasing the duration of the main meal taken at feed dispensing and increasing the time spent on the other meals during the day. The increase in intake rate during the finishing period for the bulls fed the straw–concentrate diet may have been due to the increase in animal size, whereas the fill effect of the diet remained low. The bulls fed the hay–concentrate diet maintained marked peaks in eating activity, the main one after the feed dispensing in the morning, and one or two less marked ones in the afternoon-evening period, as described with Limousin bulls fed a 45% maize silage diet (Cozzi and Gottardo, Reference Cozzi and Gottardo2005).
The eating conditions recorded in our study showed that the synchronization of the eating period within a group of bulls was not very marked whatever the diet (between 1.61 and 2.35 bulls eating at the same time out of 4 present in a group). It seems that the motivation of the animals to go to the manger together was reduced by the permanent availability of feed allowed by the ad libitum feeding, as shown by Gottardo et al. (Reference Gottardo, Ricci, Preciso, Ravarotto and Cozzi2004). However, the bulls with the straw–concentrate diet tended to eat less simultaneously within a group than those on the other diets. Since these animals spent less time eating, there was less opportunity to observe them eating together. Another possibility is that bulls on straw–concentrate diet may have managed their feeding behaviour mainly from internal stimuli of satiety or risk of digestive disorders, and independently of the group. High-concentrate diets are known to be rapidly fermented in the rumen, leading to high concentrations of volatile fatty acids in ruminal fluid. Such situations are relatively favourable to ruminal acidosis, but probably with a wide range of susceptibilities among individual cattle. With the high-concentrate diet, we observed that bulls spent more time drinking. Cottee et al. (Reference Cottee, Kyriazakis, Widowski, Lindinger, Cant, Duffield, Osborne and McBride2004) reported that lactating dairy cows subjected to subacute ruminal acidosis increased their total water intake at least during the post-prandial period when the pH depression was the most important. But a favourable buffering impact of water intake on ruminal pH does not seem evident for others (Kohn and Dunlap, Reference Kohn and Dunlap1998). The results of the present study emphasize that feeding behaviour suitable for each type of diet seems to be set quite rapidly with little variation thereafter. In this way, bulls fed high-concentrate diets during their finishing period probably adapted their feeding behaviour by distributing their meals throughout the diurnal period of the day.
In the present study, ruminal pH was estimated by a spot measure taken 4 h post-feeding. The purpose was to describe the time course of the ruminal pH in non-fistulated bulls managed in groups, as they would be under practical finishing conditions with no buffer supplementation. The findings showed a difference in ruminal pH among the three diets. This difference was more marked in the first part of the finishing period, with animals fed a straw–concentrate diet expressing a significantly lower pH than those fed a maize silage–concentrate diet at Weeks 0 and 2 of the finishing period. In the second part of the finishing period, the differences between ruminal pH tended to disappear. These results are consistent with those reported by Mackie et al. (Reference Mackie, Gilchrist, Roberts, Hannah and Schwartz1978). These authors showed that at the beginning of an experiment on sheep fed an acidotic diet, ruminal pH decreased, and 3 weeks were needed for stabilization of the minimal values.
Considering both the time course of pH during the finishing period in bulls fed a straw–concentrate diet and the apparent adjustment of the feeding behaviour by dispersal of the meals throughout the diurnal part of the day, it is clear that these animals try to adapt to this diet. The results are different if we compare the beginning and the remainder of the finishing period. In the first part of the period (6 weeks), there was a difference in ruminal pH, with bulls fed the concentrate diet having a more acid ruminal pH than the other bulls. When observing the feeding behaviour, we noted that these bulls took a main meal (in terms of eating time) at the time of feed dispensing and then further secondary meals along the day, as they were used to doing during the pre-experimental period before being switched to the concentrate finishing diet. However, eating large amounts of a concentrate diet may lead to digestive disorders due to the large quantities of volatile fatty acids produced in the rumen, which overload its absorption capacity. With time, these concentrate-fed animals decreased the relative size of this morning meal and took more balanced meals in terms of time and probably in terms of feed intake. Unfortunately, no data are available on the time course of individual amounts of ingested straw. We assume that bulls were more motivated to eat concentrate at the beginning of the finishing period, as they did not know the availability of straw. The mean straw intake increased from 0.46 kg at the beginning to 0.8 kg after 8 weeks of finishing. The dispersion of meals of a high-risk acidosis diet may be a way to limit the decrease in ruminal pH, which is particularly marked after feeding. No kinetics of pH during the day are available and it is known that ruminal pH may fluctuate widely after feeding. For that purpose, the time and the area below pH 6 or pH 5.5 are better indicators of a situation of acidosis than a spot value of pH. Our results need to be confirmed with pH kinetics to determine whether animals feel the decrease in ruminal pH and whether they actually try to adapt their feeding behaviour to reduce these risks. It would also be interesting to identify the different possible ways in which the animal can adapt, and improve management systems accordingly.
Our results show that feeding behaviour is set quite rapidly for each type of diet, favouring ruminal activity assessed through the ruminal pH, especially in concentrate-fed bulls where the risk of acidosis was greater. Practically, to be able to modulate their feeding behaviour, bulls fed such diets need to have enough manger space and be offered good-quality straw or hay, free access to clean water and diet ad libitum. Recent results show that an important competition between animals in the feeders limits the ability of cattle to self-regulate their digestive function and may lead to a decrease of their welfare (Gonzalez et al., Reference Gonzalez, Ferret, Manteca, Ruiz-de-la-Torre, Calsamiglia, Devant and Bach2008).
Conclusion
In the conditions of this experiment, it was possible to feed Blond d’Aquitaine bulls with a high-concentrate diet throughout the finishing period and obtain a high growth rate.
The ruminal pH tended to be more acidic at the beginning of the finishing period in high-concentrate-fed bulls. However, as finishing progressed, the differences in ruminal pH between the three experimental diets disappeared, while differences in feeding behaviour tended to increase. Bulls fed a high-concentrate diet seemed to develop an efficient feeding behaviour strategy consisting of a progressively greater dispersion of the meals over the diurnal part of the day. Nevertheless, apart from feeding activities, the time budget did not differ between the three diets and no health problems arose. Hence this study suggests that high-concentrate diets have no adverse impact on the welfare of bulls. In our experiment, the modulation of the feeding behaviour was made feasible by the absence of feeding competition in a situation where animals were in small groups with individual mangers and fed ad libitum. It would be useful to know whether different forms of adaptation occur. To this end, we could investigate how animals cope with a high-acidosis-risk diet when they can choose between concentrate and forage. Such trials would need to measure feeding behaviour and pH kinetics.
Acknowledgements
The authors thank the staff at the INRA experimental farm ‘Les Intrabois’ for animal care and data collection, T. Vimal for software development, E. Delval for technical assistance during experimentation, L. Genestoux for ruminal pH measurements and J. Agabriel for reviewing the manuscript.