


1. Introduction
The management of asset (investment returns)Footnote 1 and liability (discount rates, salary increases, pension increases, mortality rates and withdrawal rates) risks for pension schemes has been a significant topic in the actuarial literature for many years. For example, a wealth of literature exists on using asset and liability models to choose optimal investment strategiesFootnote 2. More recently, an increasing strand of literature has focused on the effect that decreasing mortality rates (longevity risk) are having on financial systems including pension schemesFootnote 3.
Typically, the previous literature has focused on minimising the effect the above risks have on funding ratios and contribution rates. The purpose of this paper is not to minimise risk, but to compare the relative significance of the risks driving movements in funding ratio and average contribution rates. This is done for a variety of scenarios; for example the significance of longevity risk in the presence of investment and discount rate risk when using a balanced asset allocation is considered and compared to a scenario where the investment strategy is set to minimise investment and discount rate risk. Simulations are run of a sophisticated asset and liability model (described in detail in Butt, Reference Butt2011) of a model pension scheme, with the outputs of the model used to run regressions of movements in funding ratio and average contribution rates against the risks described above. The purpose of the work is similar to that undertaken by Hari et al. (Reference Hari, De Waegenaere, Melenberg and Nijima2008), although in this paper a regression framework is used to isolate separate effects rather than adding investment risk to mortality risk as in that paper. Hari et al. (Reference Hari, De Waegenaere, Melenberg and Nijima2008) look at the funding ratio itself whilst this paper looks at movements in the funding ratio. In addition, this paper considers discount rate and investment effects separately.
Section 2 of this paper outlines the methodology used in the analysis, whilst Section 3 provides the results. Conclusions are presented in Section 4.
2. Methodology
2.1 Simulations
The following is a brief description of the simulation model; further details can be found in Butt (Reference Butt2011). Stochastic economic and demographic models are developed to perform 1,000 simulations of the assets and liabilities of a model scheme over a 30 year period. Consistent random numbers are used in each scenario to ensure differences are due to differences in the scenario and not variability of the random numbers. The simulation model is broadly similar in approach to that taken by Haberman et al. (Reference Haberman, Day, Fogarty, Khorasanee, McWhirter, Nash, Ngwira, Wright and Yakoubov2003) as the findings of the Stochastic Valuation Working Party of the UK Pensions Board. However, in this paper the contribution rate is not a free variable but calculated as the normal contribution rate on a projected unit credit basis.
The starting point for the economic model is the Wilkie (Reference Wilkie1995) structure, adjusted and parameterised using Australian data over a 26 year period from 30 June 1983 to 30 June 2009. Simulations are commenced from neutral starting conditions in the economic model. Table 2.1 provides basic statistics from the economic model across the 1,000 simulations.
Results generated by the economic model

*Note that a promotional salary scale is also used to provide age-based increases.
In the demographic model, scheme members are tested individually for withdrawal and mortality each year using a random number applied to the underlying withdrawal and mortality rates, as per the approach of Chang (Reference Chang1999). Underlying withdrawal rates are based on Australian Bureau of Statistics (ABS) data (see Wooden, Reference Wooden1999 and ABS, various). Underlying mortality rates are based on the Australian Life Tables 2005–07 (ALT05-07, Australian Government Actuary, 2009). Improvements in underlying mortality rates are allowed for via simplified version of the Lee & Carter (Reference Lee and Carter1992) model as follows:

where q(x,t) is the underlying mortality rate t years after the commencement of the simulation for an individual then aged x years, q(x) is equivalent to q(x,0) and is obtained from ALT05-07, rf(x) is a reduction factor based on past improvements in mortality rates, k(t) = k(t−1) + 1 + ε(t), k(0) = 0 and ε(t) is independent and identically distributed normally with mean zero and variance 2.5. In other words k(t) is increased each year by an expected amount of 1, with a standard deviation of 1.6. The standard deviation of 1.6 is based on a comparison of actual Australian mortality rates since 1990–92 with expected mortality rates assuming improvement based on the previous 25 years of mortality improvement. Mortality at ages 65–90 is focused upon in this analysis due to the influence that rates at these ages have on results.
2.2 Base scenario
The model scheme (as described in detail in Butt, Reference Butt2011) pays price inflation-indexed pension benefits (deferred until age 65) upon voluntary leaving of the scheme, except for those who leave with less than 7 years of service who receive a lump sum (which at that point is similar to the value of the liability of the individual under the base scenario). Pension indexation (for both deferred and pensions in payment) is subject to a minimum of 0% and a maximum of 10% each year. The model scheme has 5,000 active members, 1,680 deferred members and 2,020 pensioner members with average ages 38.0, 51.8 and 75.6 years respectively, and is closed to new entrants at the commencement of projections. After the 30 year projection period, the simulations of the model scheme have an average of 132 active members, 423 deferred members and 2,567 pensioner members with average ages 58.1, 58.6 and 78.4 years respectively. The model scheme has an initial funding ratio of 100% at the commencement of projections for all scenariosFootnote 4.
The investment strategy is a static asset allocation replicating a typical balanced portfolio comprising 60% equities and 40% bonds and cash which is rebalanced each year to the following allocations:
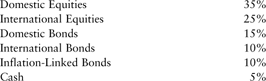
Liabilities are calculated by reference to international accounting standards which require best estimate demographic assumptions and a discount rate applicable to high-quality corporate bond yields (assumed to be equivalent to an AA-rated bond yield). These assumptions are obtained directly from the relevant economic and demographic modelsFootnote 5. Yield curves are assumed to be flat for the purposes of liability calculations, with the cash return representing the only deviation from this assumption. Contributions are calculated annually on the same basis as liabilities, using the projected unit credit method, with contributions applied immediately from the date of the valuation calculation. No allowance is made for any expectation that investment returns may be greater than the liability discount rate. Surpluses and deficits are spread over a period of 3 years using a fixed dollar per annum basisFootnote 6 to remove the effect of diminishing salaries in a closed scheme. The employer-sponsor covenant with the scheme is assumed to be strong enough to ensure the payment of contributions required at all times.
Taxation is based on the Australian superannuation system. In most cases tax on contributions and investment earnings is assumed to be the current rate of 15%, with no tax on investment earnings backing pensions in paymentFootnote 7. A tax of 15% is also applied to the liability discount rate for pre-pensioner liabilities.
Upon the completion of projections, any surplus assets are distributed to the members as additional benefits. Any deficit is remedied by the employer-sponsor immediately contributing the amount required to fund all liabilities (with an allowance for contributions tax).
2.3 Regression
Funding Ratio
Leibowitz et al. (Reference Leibowitz, Kogelman and Bader1994) introduce a measure for identifying movements in the funding ratio called the “Funding Ratio Return” (FRR). It is a simple measure of the percentage movement in the funding ratio from time t−1 to time t:

where N(t) is the value of scheme assets at time t, L(t) is the value of liabilities at time t and FR(t) = N(t)/L(t).
In general, movements in the funding ratio from time t−1 to time t are caused by differences between assumptions at time t−1 and experience from time t−1 to time t. They can also be caused by changes to assumptions between time t−1 and time t. The factors to be considered are:

A linear regression model is fit to the FRR in order to identify the above factors that have the greatest impact on the FRR. An additional factor to those listed above, FRdiff = (FR(t−1)−1)/FR(t−1), is included to represent the start of year funding ratio effect compared to a funding ratio of 100%. It is expected that FRdiff will be negatively correlated with FRR, due to contribution adjustments for surplus and deficit. However, it is noted that contributions cannot decrease beyond zero and thus, if we ignore the possibility of benefit increases and the effect of economic and decrement experience, any surplus can only be reduced by an amount equivalent to the value of the contribution holiday. Therefore a dummy variable, I = 1 if contributions during the year t−1 to t are greater than zero and I = 0 if contributions are equal to zero, is multiplied to FRdiff. If contributions are equal to zero the FRR due to the contribution holiday is proportional to the previous funding ratio – thus a final predictor FRsurp = 1/FR(t−1) multiplied by (1−I) is added to the model. It is expected that FRsurp will also be negatively correlated with FRR due to the contribution holiday. The regression model is thus defined as follows:

where β 0−β 11 are parameters to be estimated in the model.
It would be possible to fit the above model to each projection year's FRR for all 1,000 simulations for a given scenario, generating 30,000 observations. However, this would ignore potential differences in the effect of factors on FRR due to time. It might be possible to incorporate time into the regression equation, however the interactive relationships between time and the factors in the equation are likely to be complex given the closed nature of the scheme. An alternative, used here, is to perform the regression on 1,000 observations from one time and compare this to the results of another 1,000 observations from a different time. This process allows the comparison of the effects between two time periods without having to explicitly estimate the effect of time. In this paper, two time periods are compared, year 1 to year 2 (t = 2) and year 20 to year 21 (t = 21). Year 1 to year 2 is selected in preference to the first year in order to allow differences in the initial funding ratio.
Contribution Rate
Whilst it might be possible to perform a similar analysis on the movement in contribution rate from time t−1 to time t, information gained is likely to be superfluous given that movements in the funding ratio are likely to be strongly linked to movements in contribution rates next year. Therefore, the average contribution rate across the entire simulation,  , is modelled instead, as per Butt (Reference Butt2011). For a single simulation this is calculated by dividing the present value of employer contributions (including any contribution required for deficits at the completion of projections) by the present value of salaries paid to scheme members over the simulation, discounting using the forward cash rates experienced during that simulation (see Butt, Reference Butt2011 for further information). Using the forward cash rates ensures the discounting applied within a simulation takes into account the economic conditions in that simulation.
Considering the average contribution rate is based on all years of the simulation, the predictors in the model should also be based on all years of the simulation. Thus the factors to be considered for a single simulation are defined slightly differently (although consistent notation is used):

A similar approach to that used for the funding ratio return is used in fitting the regression model as follows:

where β 0−β 14 are parameters to be estimated in the model.
3. Results
Summary statistics from the regression model are presented, including the β estimates (Coef), the standard error of the β estimates (S.E.) and the percentage of variance explained by each predictor (SS %). An insignificant β estimate lies in the range −1.96 multiplied by standard error to +1.96 multiplied by standard error. The final value, SS %, is dependent on the order in which the predictors are fit – therefore the predictors are fit in the sequential order that gives the greatest reduction in the residual sum of squaresFootnote 10. In addition, the standard deviation, σ, of the response before regression is presented at the bottom of each table.
Any correlation between predictors can have significant impacts on the regression results; therefore correlation matrices of predictors are presented to allow this impact to be discussed. The correlation is significant at the 5% level if its absolute value exceeds  , where n = 1,000 is the number of observations used in fitting the regression.
3.1 Base scenario
The first point to note from the results in Table 3.1 is the large amount of variation in FRR explained by the predictors for both years (99.0%). Most of this is due to movements in the discount rate (drchng; 46.4% in year 2), investment returns being higher than discount rates (ediff; 33.3% in year 2) and changes in pension increase assumptions (qchng; 14.9% in year 2). The interpretation of the coefficients can be best explained through an example. A 1% increase in investment return, ediff, gives a 0.953 × 1% = 0.953% increase in the funding ratio in the second year, which is not surprising given changes in investment returns flow directly through to assets and thus should affect the funding ratio by the same scaleFootnote 11. As expected, the coefficient of drchng is positive and qchng is negative, reflecting the fact that an increase in discount rate reduces liabilities and thus has a positive effect on FRR and vice versa for an increase in the pension increase assumption. The 14.9% sum squared effect of qchng also includes components of unexpected pension increases during the year, due to the 99.4% correlation between past pension increases (qdiff) and qchng (see Table 3.2). The decreasing absolute coefficient trend for salary inflation experience (wdiff) from −0.352 in year 2 to −0.184 in year 21 indicates the shift of members from active to deferred or pensioner state in a closed scheme (see Section 2.2). The same decreasing absolute coefficient trend is observed for drchng and qchng due to the shortened liability duration meaning liabilities are not as greatly affected by a change in assumption. For this reason, ediff explains a greater proportion of variance in FRR in year 21 (53.8%) than year 2 (33.3%) and the overall standard deviation of FRR is higher in year 2 (14.9%) than year 21 (13.3%).
Funding ratio return regression results for Base

Note – coefficients in red are insignificant at the 5% level. Where this insignificance is caused by multicollinearity (typically only when correlation between predictors is close to 1 or −1) the predictor with the lowest SS % is removed from the model.
Correlation matrix of funding ratio return regression predictors for Base (t = 2)

Note – figures in red are significant at the 5% level.
Interestingly, mortality experience (ddiff) and improvement assumptions (kchng) have little impact on FRR; as expected the positive coefficient for ddiff indicates that an increase in observed mortality rates increases the funding ratio due to reduced liabilities, whilst the negative coefficient for kdiff shows a speeding up of mortality improvement reduces the funding ratio due to increased liabilities. However, these factors explain only 0.1% of variance in FRR in year 2. This is consistent with the results of Hari et al. (Reference Hari, De Waegenaere, Melenberg and Nijima2008)Footnote 12. Similarly withdrawal rates (ldiff) have an insignificant impact on FRR.
The increase in the intercept term (β 0) from 0.005 in year 2 to 0.045 in year 21 is because of a trend in the simulations towards surplus over time. This trend is for two reasons; first, the average investment return is greater than the AA-rated corporate bond yield liability discount rate. Second, surplus is maintained in the scheme until the completion of projections but the employer-sponsor is required to fund any deficits during the simulation period. This trend is discussed in more depth in Butt (Reference Butt2011). For this reason the previous funding ratio predictors (FRdiff and FRsurp) explain far less of the variation in FRR in year 21 (0.9%) than year 2 (4.1%). In any case, the results show that contribution action taken to reduce deficits and surplus has far less impact on the funding ratio than discount rate and investment return factors.
The correlation matrix for the FRR predictors when t = 2 in Table 3.2 is not presented for t = 21 as the results are largely the same. It is first worth noting that the two most significant predictors of FRR, investment returns and changes in discount rate (ediff and drchng), have virtually no correlation (−0.5%). Extremely high correlations (greater than 99%) exist between pension increase experience and pension increase and salary inflation assumptions (qdiff, qchng and wchng) due to their underlying relationship in the economic model; hence the removal of wchng from Table 3.1. This also explains the relatively high standard errors of the coefficient estimates for qdiff (0.240) and qchng (1.347) in Table 3.1. Another more minor correlation of around 30% exists between salary inflation experience (wdiff) and these variables. There are two important correlations with drchng. The first is with qdiff, qchng and wchng of around 49%, due to jumps in price inflation flowing through to interest rates and thus discount rates in the underlying economic model. The second is a negative correlation with the starting funding ratio factors (FRdiff and FRsurp) of around −20% to −25%, indicating a lower initial funding ratio might be due to unusually low discount rates at the start of the year which increase during the year, and vice versa. These correlations may have caused the percentage of variance explained by drchng to be higher than that caused just by discount rates in Table 3.1.
The correlation of −24.2% between mortality components (ddiff and kchng) is due to the mortality experience being based on improvements known at the start of the year and expected future improvement in the next year only. For example, a significant positive shock to mortality improvement will have a positive effect on kchng but a negative effect on ddiff as less people die than would have under expected mortality improvement that year.
The average contribution rate regression results in Table 3.3 indicate that average contribution rates over an entire simulation are far harder to predict using the factors affecting the scheme than year-to-year funding ratio movements (shown in Table 3.1), with only 41.2% of variance explained by the model. This implies that total contributions paid over a simulation are affected by events in a few individual years of the simulation (particularly a significant deficit event) rather than the average results over the entire simulation that are being used as predictors in the regression model. Most of the variation explained is due to investment returns (ediff; 25.0%) and pension increases (qdiff; 7.2%) being different to average and the variability of discount rates (drchng; 4.1%). The interpretation of the coefficients can be best explained through an example. A 1% increase in the annual investment return, ediff, gives a 3.241 × 1% = 3.241% reduction in the average contribution rate. Interestingly the negative coefficients for wchng and qchng imply a reduction in contribution rates with an increase in salary inflation and pension increase volatility; however this may be due to the high correlation of these predictors with discount rate volatility factors (drchng) in Table 3.4 (78.3% and 89.5% respectively). Similarly, very large correlations between salary inflation, pension increase and discount rate averages (wdiff, qdiff and drdiff) of around 89% to 95% in Table 3.4 means the variation explained in Table 3.3 cannot be reliably split between these factors and explains the high standard deviation of these coefficient estimates (1.325, 1.321 and 0.963 respectively) in Table 3.3.
Average contribution rate regression results for Base

Note – coefficients in red are insignificant at the 5% level.
Correlation matrix of average contribution rate regression predictors for Base

Note – figures in red are significant at the 5% level.
In general, average differences in the factors (the diff predictors) explain far more variance in contribution rates than the relative volatility of the factors (the chng predictors). Surprisingly the overall comparison of mortality improvements to expectations (kdiff) has an insignificant impact on the average contribution rate, with mortality improvement volatility (kchng) explaining a greater proportion of variability than overall improvement. However the total variability explained of 0.8% indicates that mortality improvement is not a major concern for schemes with significant mismatches between assets and liabilities. Scheme mortality experience factors (ddiff and dchng) explain only 0.1% of total variability.
Since all predictors are centred at zero, the intercept coefficient of 14.2% can be thought of as the average contribution rate across all simulations. The standard deviation of the average contribution rate is 11.2%. The correlations in Table 3.4 are similar in direction but generally higher than the corresponding correlations in Table 3.2, due to the relationships between variables being stronger over thirty years than one year.
3.2 Different discount rate
The methodology of valuation of a scheme's liabilities has been a source of great debate in actuarial and other professions; in particular the choice of discount rate for expected liability cash flows. The AA-rated bond yield approach used in the Base scenario reflects the valuation requirements under current international accounting standards.
Expected return on assets (ER)
For funding purposes, traditional actuarial practice has been to discount expected liability cash flows at the expected rate of return on scheme assets, in order to ensure that the assets and liabilities of the scheme develop at the same expected rate or returnFootnote 13. As such, scenario ER is introduced to investigate the effect of using a discount rate incorporating a constant real return above expected price inflation equal to the average real return (geometric) experienced by the scheme over all simulations.
A reduced standard deviation in FRR is noted under ER in Table 3.5 (in year 2, 9.6% in ER compared to 14.9% in Base) due to the removal of real discount rate volatility. Hence, under ER, almost all variation in FRR is explained by investment returns (ediff; in year 2, 90.8% in ER compared to 33.3% in Base), although coefficient estimates are broadly similar between ER and Base. The removal of real discount rate volatility can be seen by the almost 100% correlation between the liability economic assumptions (drdiff, qchng and wchng) in Table 3.6. A weaker trend towards surplus is reflected in the intercept for year 21 reducing from 0.045 in Base to 0.010 in RE. This is due to the bias between discount rates and investment returns being removed from the contribution calculations. This also explains why the standard deviation of FRR increases from 9.6% in year 2 to 10.8% in year 21, as the greater variety of funding ratios at the start of year 21 provide a greater variety of FRR results. Mortality components (ddiff and kchng) still predict very little variance.
Funding ratio return regression results for ER

Note – coefficients in red are insignificant at the 5% level. Where this insignificance is caused by multicollinearity (typically only when correlation between predictors is close to 1 or −1) the predictor with the lowest SS % is removed from the model.
Correlation matrix of funding ratio return regression predictors for ER (t = 2)

Note – figures in red are significant at the 5% level.
Apart from the comments above, the correlation of predictors is broadly similar between ER and Base in Tables 3.6 and 3.2 respectively.
Contribution rate regression results for ER in Table 3.7 are similar to that of the Base scenario. The standard deviation of contribution rate has reduced only slightly, from 11.2% in Base to 10.4% in ER. This smaller reduction than FRR is because the discount rate factors over the entire simulation (drdiff and drchng) did not predict a large amount of contribution rate volatility in Base anyway. Reduced FRR volatility means the predictors explain a greater proportion of average contribution rate volatility (56.7% in ER compared to 41.2% in Base) as individual year funding ratio movements do not have as high an effect on contribution rate volatility. In particular, the proportion of variance explained by average investment returns (ediff) has increased from 25.0% in Base to 39.1% in ER, with the coefficient estimate moving from −3.241 in Base to −3.701 in ER, despite the fact that investment returns are identical in Base and ER. The average contribution rate of 18.0% is slightly higher than that of the Base scenario at 14.2% due to the diminished trend to surplus discussed aboveFootnote 14.
Average contribution rate regression results for ER

Note – coefficients in red are insignificant at the 5% level.
The correlation matrix of predictors in Table 3.8 is similar to that shown in Table 3.4 as the factors driving discount rates on an absolute basis are similar to that of Base, with discount rates now being held steady on a real basis.
Correlation matrix of average contribution rate regression predictors for ER

Note – figures in red are significant at the 5% level.
Risk-free (RF)
Many previous studies have argued that pension liabilities should be discounted at a risk-free rate, like other liabilities of the employer-sponsorFootnote 15. Scenario RF provides the results where the long-term interest rate is used instead of the AA-rated bond yield for discounting scheme liabilities. In addition, the pension increase assumption is adjusted to the value implied by the difference between long-term interest rates and inflation-linked bond yields, instead of the pension increase expectation calculated in the economic modelFootnote 16, as this is a better representation of the rate that could be hedged in the market.
The results when discounting liabilities using a risk-free rate are not particularly different than using an AA-rated bond yield, with coefficients broadly consistent between RF and Base in Table 3.9. Variability in FRR is reduced under RF (in year 2, 12.8% in RF compared to 14.9% in Base) due to the closer link between discount rate movements drchng and pension increase assumption qchng (the correlation has increased from 48.9% in Base to 79.3% in RF which reduces liability volatility). For this same reason investment returns (ediff) explain a greater proportion of the variability under RF (in year 2, 49.6% in RF compared to 33.3% in Base) compared to the total explanatory power of drchng and qchng. The standard errors of the pension increase coefficients (qdiff and qchng) are significantly reduced (for example, in year 2, qchng drops from 1.347 in Base to 0.078 in RF) due to the reduced correlation between pension increase assumptions and past experience as can be seen in Table 3.10 (a correlation of 55.6% in RF compared to 99.4% in Base).
Funding ratio return regression results for RF

Note – coefficients in red are insignificant at the 5% level. Where this insignificance is caused by multicollinearity (typically only when correlation between predictors is close to 1 or −1) the predictor with the lowest SS % is removed from the model.
Correlation matrix of funding ratio return regression predictors for RF (t = 2)

Note – figures in red are significant at the 5% level.
Apart from the comments above, the correlation of predictors is broadly similar between RF and Base in Tables 3.10 and 3.2 respectively.
Contribution rate regression results in Table 3.11 are again broadly similar to those found in the Base scenario. The average contribution rate for RF of 14.5% is slightly higher than that of the Base scenario at 14.2% due to the greater initial contribution rate required for the lower discount rate in RF than in the Base scenario.
Average contribution rate regression results for RF

Note – coefficients in red are insignificant at the 5% level.
The correlation matrix of predictors in Table 3.12 is virtually identical to that shown in Table 3.4 (since the long-term interest rate and AA-rated bond yield are strongly correlated).
Correlation matrix of average contribution rate regression predictors for RF

Note – figures in red are significant at the 5% level.
3.3 Different investment strategy
Defensive strategy (RE)
A more defensive investment strategy comprising 30% equities and 70% bonds and cash is analysed as scenario RE:
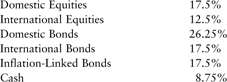
Regression results in Table 3.13 for a more conservative asset mix are consistent with the Base scenario, with a lower proportion of variability explained by investment returns (ediff; in year 2, 16.5% in RE compared to 33.3% in Base) due to the lower volatility of investment returns in RE. The standard deviation of FRR in year 2 has reduced from 14.9% in Base to 11.8% in RE. A weaker trend towards surplus due to the lower investment returns is reflected in the intercept for year 21 reducing from 0.045 in Base to 0.011 in RE.
Funding ratio return regression results for RE

Note – coefficients in red are insignificant at the 5% level. Where this insignificance is caused by multicollinearity (typically only when correlation between predictors is close to 1 or −1) the predictor with the lowest SS % is removed from the model.
As only the investment return predictor is changed in RE, there is no significant difference between the correlation of predictors in Table 3.14 and the Base scenario in Table 3.2.
Correlation matrix of funding ratio return regression predictors for RE (t = 2)

Note – figures in red are significant at the 5% level.
The standard deviation of average contribution rate has reduced from 11.2% in Base to 7.9% in RE, with contribution rate regression results in Table 3.15 similar to that of the Base scenario. However, the average contribution rate has increased from 14.2% in Base to 17.8% in RE due to lower returns experienced. A higher proportion of variability (50.8% in RE compared to 41.2% in Base) is explained due to the lower investment volatility from year to year meaning extreme events are not as likely to distort average contribution rate results. This is reflected by the increase in the absolute investment returns (ediff) coefficient from −3.241 in Base to −4.751 in RE showing that average investment returns have a stronger relationship with average contribution rates when investment returns are more stable.
Average contribution rate regression results for RE

Note – coefficients in red are insignificant at the 5% level.
Again the correlation of RE predictors in Table 3.16 is very similar to the Base scenario in Table 3.4.
Correlation matrix of average contribution rate regression predictors for RE

Note – figures in red are significant at the 5% level.
Cash flow matching (PM and AM)
An alternative investment strategy to those described above is to hedge the liabilities as closely as possible in order to minimise funding ratio volatility. Essentially this means that bonds are held that deliver cash flows exactly equivalent to the expected cash flows of the schemeFootnote 17.
It is assumed that cash flow matching is performed through investments in inflation-linked bonds, with bonds of all appropriate maturities being available. This ensures movements in discount rates and price inflation are hedgedFootnote 18, although salary increasesFootnote 19, withdrawal rate and mortality rateFootnote 20 effects are unhedged. Any surplus of assets due to imperfect cash flow matching is allowed to vary in asset allocation as per the Base scenario, with any deficit being proportionately spread amongst the cash flow matching. Rebalancing of the portfolio again occurs on an annual basis.
Two cash flow matching strategies are investigated. Scenario PM allows for assets backing pension liabilities to be cash flow matched but for all other assets to be invested as per the Base scenarioFootnote 21. Scenario AM has all scheme liabilities cash flow matched. Calculation of investment returns under these strategies is described in the Appendix. Since the cash flow matching is performed on a risk-free basis, the liability is also valued under a risk-free basis, as per scenario RF.
It is first worth noting a drop in the standard deviation of FRR in year 2 from 12.8% in RF to 9.2% in PM in Table 3.17, indicating the matching of pension cash flows reduces funding ratio volatility as expected. Coefficients are very similar between the two scenarios, with investment returns (ediff) explaining a lower proportion of volatility (31.9% in year 2 compared to 49.6% for RF) as the shorter-term pension liabilities are not affected by investment returns but longer-term liabilities (which are more affected by liability assumptions drchng and qchng) are. Mortality improvements (kchng) show a minor increase in explanatory power, from 0.2% in RF to 0.4% in PM in year 2. A weaker trend towards surplus is reflected in the intercept for year 21 reducing from 0.039 in RF to 0.020 in PM.
Funding ratio return regression results for PM

Note – coefficients in red are insignificant at the 5% level.
The correlation matrix in Table 3.18 is almost identical to that shown in Table 3.10 with investment returns (ediff) the only predictor changed between PM and RF.
Correlation matrix of funding ratio return regression predictors for PM (t = 2)

Note - figures in red are significant at the 5% level.
The standard deviation of contribution rate has dropped from 11.8% in RF to 8.9% in PM in Table 3.19, indicating some success in using a cash flow matching strategy, however the average contribution rate has increased slightly from 14.5% in RF to 16.3% in PM due to lower investment returns being obtained and thus less frequent contribution holidays. Other results are broadly similar to RF, again confirming the minimal effect of mortality factors ddiff and kchng. This indicates that partial cash flow matching has minimal impact on the contributions of the scheme.
Average contribution rate regression results for PM

Note – coefficients in red are insignificant at the 5% level.
The correlation of predictors in Table 3.20 is very similar to that of RF in Table 3.12.
Correlation matrix of average contribution rate regression predictors for PM

Note – figures in red are significant at the 5% level.
An almost complete removal of FRR volatility in year 2 from 12.8% in RF to 0.9% in AM is observed in Table 3.21, indicating that using a full cash flow matching strategy updated on an annual basis is very successful in controlling the funding ratio. Coefficients under AM, with the exception of mortality components (ddiff and kchng) and salary inflation experience (wdiff) are much smaller in absolute terms than under RF, due to the effect of the liability matching asset portfolio. In year 2, the proportion of variance explained by mortality improvement movements (kchng) has jumped from 0.2% in RF to 36.4% in AM, although actual mortality experience (ddiff) still explains only 1.2% of variance. These figures increase even further in year 21 (49.4% for kchng and 1.8% for ddiff) as the duration of the liabilities decrease. Withdrawal rates (ldiff) still have an insignificant effect on funding ratio volatility. In year 2, the proportion of variance explained by salary inflation experience (wdiff) has jumped from 0.1% in RF to 20.1% in AM, due to the fact that salary inflation movements are unhedged. This figure reduces to 7.4% in year 21 due to the reduction in active membership in a closed scheme.
Funding ratio return regression results for AM

Note – coefficients in red are insignificant at the 5% level.
Very significant correlations exist in Table 3.22 between the other economic experience and assumptions (ediff, qdiff, drchng, wchng and qchng)Footnote 22, making interpretation of the proportion of the variance explained by these predictors difficult. This can be seen in some of the unusual movements in variance explained by these factors from year 2 to year 21 (for example the variance explained by ediff reduces from 23.6% in year 2 to 1.8% in year 21). However, the reduction in total variance explained by these predictors (from 29.1% in year 2 to 14.7% in year 21) and the increase in variance explained by the current funding level FRdiff (from 5.7% in year 2 to 10.5% in year 21), provides the logical conclusion that cash flow matching is more easily achieved when the liability duration is reduced and when the effect of economic factors that cannot be hedged such as salary inflation is reduced. However, only rebalancing assets on an annual basis still explains a significant proportion of funding ratio movements.
Correlation matrix of funding ratio return regression predictors for AM (t = 2)

Note – figures in red are significant at the 5% level.
Using a cash flow matching strategy ensures more of the variability in contribution rates can be explained (an increase from 36.1% in RF to 69.9% in AM) – however the average contribution rate of 30.9% is much larger than RF of 14.5% in Table 3.23 due to the much lower investment returns being earned. However, this contribution rate is more consistent with only a 3.9% standard deviation in average contribution rate in AM compared to 11.8% in RF. Interestingly the investment return experience (ediff) explains more of the variance in contribution rate (30.1%) than it did under RF (21.3%)Footnote 23, although the very high correlations between ediff, qdiff, wdiff and drdiff in Table 3.24 means the variation explained cannot be reliably split between these factors. The absolute increase in the investment return coefficient (ediff) from −3.206 in RF to −4.855 in AM suggests that simulations with high average investment returns (which are 92.7% correlated with average discount rates drdiff) are particularly important in determining average contribution rates. Much more of the variance is explained by differences in salary inflation (wdiff; 2.6% under AM compared to 0.6% under RF) and mortality improvement (kdiff; 14.6% under AM compared to 0.1% under RF) that are not cash flow matched. However it is interesting to note that the mortality improvement component still explains a lower proportion of variance than the economic components. A total of all mortality components (ddiff, kdiff, dchng and kchng) of 14.9% variation explained is not particularly significant given the standard deviation of average contribution rate of 3.9%. A basic sensitivity test of doubling the variance of the mortality shocks from 2.5 to 5 (not presented in a formal regression table) reveals the total variation of all mortality components is 22.8% of a standard deviation of average contribution rate of 4.2%. The proportion of variance explained by ediff is still higher than mortality components at 27.3%. The average contribution rate is unchanged at 30.9%.
Average contribution rate regression results for AM

Note – coefficients in red are insignificant at the 5% level.
Correlation matrix of average contribution rate regression predictors for AM

Note – figures in red are significant at the 5% level.
4. Conclusions
In this paper a stochastic economic and demographic model is used to simulate a model scheme which is closed to new entrants and has significant assets invested in equities. A regression framework is then used to investigate the impact of the stochastic model factors on the scheme outcomes. The results show that the mismatch between assets and liabilities is by far the biggest predictor of movements in the funding ratio and average contribution rates. In particular, the effect of movements in the economic assumptions such as the liability discount rate and pension increases, and the difference between investment returns and the discount rate explain almost all of the variance in funding ratio movements. Demographic factors such as withdrawal and mortality rates do not significantly impact funding ratios or average contribution rates. This indicates that for this typical scheme longevity risk is not of any real concern when compared to investment and interest rate risk. Differences in average contribution rates cannot be adequately predicted by average experience and appear to be most significantly impacted by negative economic events in some years rather than by average experience.
However, variability in funding ratio movements can be reduced by 93% and variability in average contribution rates can be reduced by 67% when investing in an asset portfolio that hedges interest rate and price inflation risk, even if the portfolio is only rebalanced on an annual basis. However, this comes at the expense of more than doubling average contribution rates due to the lower average investment return earned. In this case underlying mortality improvement becomes the most significant predictor of movements in the funding level, although mortality and withdrawal experience still have little significance for a scheme that starts with 8,700 members. However, overall mortality improvement over 30 years explains less than 15% of the variance in average contribution rate (which has a standard deviation of less than 4%) over that period, indicating that longevity risk is still relatively insignificant for pension schemes, even when investing in a matching portfolio.
Of course the results described in this paper are heavily dependent on the models and parameters chosen. Should the structure of mortality improvement change significantly then longevity may become a far more significant risk for schemes in future, but at this stage the risk does not appear to be significant compared to the economic risks faced by schemes.
Acknowledgements
This paper provides some updated results of a recently completed PhD thesis undertaken by the author. All acknowledgements relevant to the PhD thesis are also relevant to this paper. The author also thanks one anonymous reviewer for their helpful comments in developing the arguments of the paper. Any errors or omissions remain the responsibility of the author.
Appendix: Calculation of investment return under cash flow matching scenarios PM and AM
The investment return under these scenarios is equivalent to the return on a portfolio replicating expected liability cash flowsFootnote 24 and is initially developed through a simplified example. If a stream of real liability cash flows payable mid-year, CF(t), where t = 0.5, 1.5, etc. is estimated, then the liability at time 0, L(0), can be defined asFootnote 25:
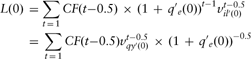
where  is the cash flow indexation assumptionFootnote 26 at time t, il′(t) is the long-term interest rate at time t, qy′(t) is the inflation-linked bond yield at time t and
 is the standard actuarial discount factor. Assuming the real cash flows remain unchanged, the liability at time 1, L(1), can be defined as:

where q′(t) is the actual cash flow increase over the period t−1 to t. If L s(t) is defined as the liability at time t based on a cash flow indexation assumption and discount rate applicable at time s, this can be rearranged as followsFootnote 27:

The return e′(1) on the hedging portfolio of assets over the period time 0 to time 1 can be calculated by solving the following equation (using the quadratic formula):

Using the above approach, if active, deferred and pensioner scheme liabilities at time t, based on a pension increase assumption and discount rate applicable at time s, are defined as  ,
 and
 respectively, then the effective returns on assets backing these liability types,
 ,
 and
 , over the period t−1 to t are defined asFootnote 28:



where CFact (t−0.5), CFdef (t−0.5) and CFpens (t−0.5) are the expected liability cash flows at time t−0.5 for active, deferred and pensioner liabilities respectively. Note that no allowance is made for future benefit accrual and contributions. Only the liability due to past service is matched until rebalancing at the end of each year.
The overall investment return, e m′(t), for scenario PM is calculated as:

where N(t) is the scheme assets at time t and enp′(t) is the investment return for non-pension assets under the Base scenario over the period t−1 to t.
The overall investment return for scenario AM is calculated as:

where  and e′(t) is the investment return under the Base scenario over the period t−1 to t.



