1 Introduction
Detonation diffraction is a fundamental problem both in the characterisation of detonation waves and in their practical applications. When a detonation wave propagates from a channel into an unconfined space, if ultimately the shock and flame are decoupled, this scenario is defined as a subcritical outcome. On the other hand, if re-initiation happens and the detonation wave continues to propagate, this scenario is referred to as a supercritical outcome. For a gaseous mixture with a specific initial condition, the outcome depends on the size of the channel exit, and this critical size is defined as the critical channel width. Since the early discovery of detonation diffraction failure (Laffitte Reference Laffitte1925) and the systematic experimental work that established the existence of the critical channel diameter (Zel’dovich Reference Zel’dovich1956), extensive experimental and numerical investigations have been conducted to enhance our understanding of detonation diffraction phenomena.
Lee (Reference Lee1996) attributed the failure mechanism in stable mixtures to excessive curvature of the attenuated detonation wave and in unstable mixtures to the failure of the formation of re-initiation bubbles. Experimental studies (Liu, Lee & Knystautas Reference Liu, Lee and Knystautas1984) have revealed that the critical channel size depends not only on the thermodynamic conditions of the mixture, but also on the geometry of the channel exit. Several studies (Mitrofanov & Soloukhin Reference Mitrofanov and Soloukhin1965; Edwards, Thomas & Nettleton Reference Edwards, Thomas and Nettleton1979) have reported that the critical diameter for unstable detonations through a circular exit geometry follows a 13-cell width correlation. If a rectangular geometry with a large aspect ratio is applied instead, the correlation reduces to a width of approximately three cells (Benedick, Knystautas & Lee Reference Benedick, Knystautas and Lee1984). Li et al. (Reference Li, Ning, Kiyanda and Ng2016) numerically confirmed that, for a stable mixture, the critical sizes of spherical and cylindrical detonation diffractions differ by a factor of 2, which supports the ‘excessive curvature’ argument. Thanks to technical developments in schlieren techniques, planar laser-induced fluorescence (PLIF) and chemiluminescence imaging, Pintgen & Shepherd (Reference Pintgen and Shepherd2009) focused on visualisation of the detailed structure of the diffracted detonation wave and reaction zone. They found that the reaction front velocity on the centreline decays significantly faster in mixtures with higher activation energy. Kawasaki & Kasahara (Reference Kawasaki and Kasahara2019) revealed experimentally that the reflection point distance is inversely proportional to the initial pressure for diluted and non-diluted mixtures. Yuan et al. (Reference Yuan, Mi, Ng and Zhou2019) developed a semi-analytical model to integrate the trajectory of the transverse detonation; their results match the simulation accurately for large deviation angles.
The numerical study by Jones et al. (Reference Jones, Kemister, Oran and Sichel1996) showed that  $\text{H}_{2}/\text{O}_{2}/\text{Ar}$ detonation without any cellular structure failed when transmitted into a large volume. However, interestingly, their finding is contrary to a more recent study by Arienti & Shepherd (Reference Arienti and Shepherd2005), which provided an in-depth analysis of the influence of activation energy on diffraction with a fixed inlet channel width. In that study, a one-step chemical model was used, and the activation energy was constrained at a relatively low value so that a Zel’dovich–von Neumann–Döring (ZND) profile could be applied as the initial condition. Both the subcritical and supercritical outcomes were obtained. A theoretical model was developed based on the assumption that the Lagrangian derivative of temperature vanishes. Although transverse waves play an important role in unsteady transitional regimes (Zhang Reference Zhang2009), few resolved numerical studies have been carried out to compare differences in the re-initiation mechanisms of planar detonation and cellular detonation diffractions. Meanwhile, it appears that the simulations in the aforementioned investigations had neither sufficient resolution nor sufficiently long inlet channels (only approximately 10 orders of the reaction zone length) due to computational limitations. Therefore, a rigorous study is essential for a clear understanding of the re-initiation process and the role of transverse waves in detonation diffraction problems.
This paper presents a series of two-dimensional numerical simulations aimed at interpreting the re-initiation mechanism during diffraction of detonation waves with and without transverse waves. In § 2, we describe the physical model, the numerical scheme and their implementation. In § 3, we compare two sets of cases initiated by either a quasi-one-dimensional detonation or a cellular detonation wave, and present the critical channel widths and the detailed re-initiation processes. We then discuss the role of reflected rarefaction waves and the importance of transverse waves in re-initiation during diffraction. Our conclusions follow in § 4.
2 Numerical method
2.1 Governing equations
For two-dimensional inviscid detonations, ignoring heat losses, viscosity and diffusion transport, the conservation equations of mass, momentum and energy in dimensionless forms are
 $$\begin{eqnarray}\frac{\unicode[STIX]{x2202}\boldsymbol{U}}{\unicode[STIX]{x2202}t}+\frac{\unicode[STIX]{x2202}\boldsymbol{F}}{\unicode[STIX]{x2202}x}+\frac{\unicode[STIX]{x2202}\boldsymbol{G}}{\unicode[STIX]{x2202}y}=\boldsymbol{S},\end{eqnarray}$$
where the conserved variables  $\boldsymbol{U}$, the fluxes
 $\boldsymbol{F}$ and
 $\boldsymbol{G}$ and the source terms
 $\boldsymbol{S}$ are defined as
 $$\begin{eqnarray}\displaystyle & \displaystyle \boldsymbol{U}=[\unicode[STIX]{x1D70C},\unicode[STIX]{x1D70C}u,\unicode[STIX]{x1D70C}v,E,\unicode[STIX]{x1D70C}\unicode[STIX]{x1D706}]^{\text{T}}, & \displaystyle\end{eqnarray}$$
 $$\begin{eqnarray}\displaystyle & \displaystyle \boldsymbol{F}=[\unicode[STIX]{x1D70C}u,\unicode[STIX]{x1D70C}u^{2}+p,\unicode[STIX]{x1D70C}uv,(E+p)u,\unicode[STIX]{x1D70C}\unicode[STIX]{x1D706}u]^{\text{T}}, & \displaystyle\end{eqnarray}$$
 $$\begin{eqnarray}\displaystyle & \displaystyle \boldsymbol{G}=[\unicode[STIX]{x1D70C}v,\unicode[STIX]{x1D70C}uv,\unicode[STIX]{x1D70C}v^{2}+p,(E+p)v,\unicode[STIX]{x1D70C}\unicode[STIX]{x1D706}v]^{\text{T}}, & \displaystyle\end{eqnarray}$$
 $$\begin{eqnarray}\displaystyle & \displaystyle \boldsymbol{S}=[0,0,0,0,\unicode[STIX]{x1D714}]^{\text{T}}. & \displaystyle\end{eqnarray}$$
Here  $\unicode[STIX]{x1D70C}$,
 $p$,
 $u$,
 $v$,
 $\unicode[STIX]{x1D706}$ and
 $E$ denote density, pressure, the fluid velocities in the
 $x$ and
 $y$ directions, the mass fraction of the reactant and the total energy per unit volume, respectively. The ideal gas law in non-dimensional form is written as
 $p=\unicode[STIX]{x1D70C}T$, and the total energy per unit volume is given by
 $$\begin{eqnarray}E=\frac{p}{\unicode[STIX]{x1D6FE}-1}+\frac{1}{2}\unicode[STIX]{x1D70C}(u^{2}+v^{2})+\unicode[STIX]{x1D70C}\unicode[STIX]{x1D706}Q,\end{eqnarray}$$
where  $\unicode[STIX]{x1D6FE}$ is the specific heat ratio and
 $Q$ represents the heat of the reaction per unit mass. The chemical reaction rate is calculated by the Arrhenius equation:
 $$\begin{eqnarray}\unicode[STIX]{x1D714}=-K\unicode[STIX]{x1D70C}\unicode[STIX]{x1D706}\text{e}^{-E_{a}/T},\end{eqnarray}$$
where  $E_{a}$ is the activation energy and
 $K$ is a scaling factor adjusted to ensure that the half-reaction-length (
 $\ell _{1/2}$) in the ZND profile is of unit length scale. The dimensionless forms of variables with respect to the state of the unburned gas are
 $$\begin{eqnarray}\left.\begin{array}{@{}c@{}}\unicode[STIX]{x1D70C}={\displaystyle \frac{\unicode[STIX]{x1D70C}^{\prime }}{\unicode[STIX]{x1D70C}_{0}^{\prime }}},\quad p={\displaystyle \frac{p^{\prime }}{p_{0}^{\prime }}},\quad T={\displaystyle \frac{T^{\prime }}{T_{0}^{\prime }}},\quad u={\displaystyle \frac{u^{\prime }}{\sqrt{RT_{0}^{\prime }}}},\quad v={\displaystyle \frac{v^{\prime }}{\sqrt{RT_{0}^{\prime }}}},\quad E_{a}={\displaystyle \frac{E_{a}^{\prime }}{RT_{0}^{\prime }}},\\[15.0pt] Q={\displaystyle \frac{Q^{\prime }}{RT_{0}^{\prime }}},\quad x={\displaystyle \frac{x^{\prime }}{L_{1/2}^{\prime }}}\quad \text{and}\quad t={\displaystyle \frac{t^{\prime }}{L_{1/2}^{\prime }/\sqrt{RT_{0}^{\prime }}}},\end{array}\right\}\end{eqnarray}$$
where  $R$ is the gas constant. The variables with a prime indicate the dimensional forms, and those with a subscript 0 indicate the values for the unburned gas.
2.2 Numerical scheme and validation
The above governing equations are numerically solved on uniform meshes by applying the second-order  $a$–
 $\unicode[STIX]{x1D6FC}$ conservation element/solution element (CE/SE) scheme (Chang Reference Chang1995; Shen et al. Reference Shen, Wen, Liu and Zhang2015a; Shen, Wen & Zhang Reference Shen, Wen and Zhang2015b; Shen & Wen Reference Shen and Wen2016; Shen et al. Reference Shen, Wen, Parsani and Shu2017; Wen, Massimi & Shen Reference Wen, Massimi and Shen2018). The chemical reaction is integrated by the implicit trapezoidal method. Following a previous study by Daimon & Matsuo (Reference Daimon and Matsuo2003), our code is validated by simulating one-dimensional detonation waves with a high degree of overdrive (
 $f=D^{2}/D_{CJ}^{2}$;
 $D_{CJ}$ is defined below). The parameters are fixed at
 $\unicode[STIX]{x1D6FE}=1.2$,
 $E_{a}=50$ and
 $Q=50$. The length of the computational domain is
 $2300\ell _{1/2}$, the initial state is given by a steady ZND profile for
 $x<5$, and the inflow boundary condition is fixed at the left boundary. According to a numerical study by Bourlioux, Majda & Roytburd (Reference Bourlioux, Majda and Roytburd1991), reducing the overdrive below the neutral stability boundary will trigger instability in the detonation wave and increase the amplitude of the oscillation. In our simulations, the resolution is set as
 $40~\text{pts}/\ell _{1/2}$, and the overdriven factors are
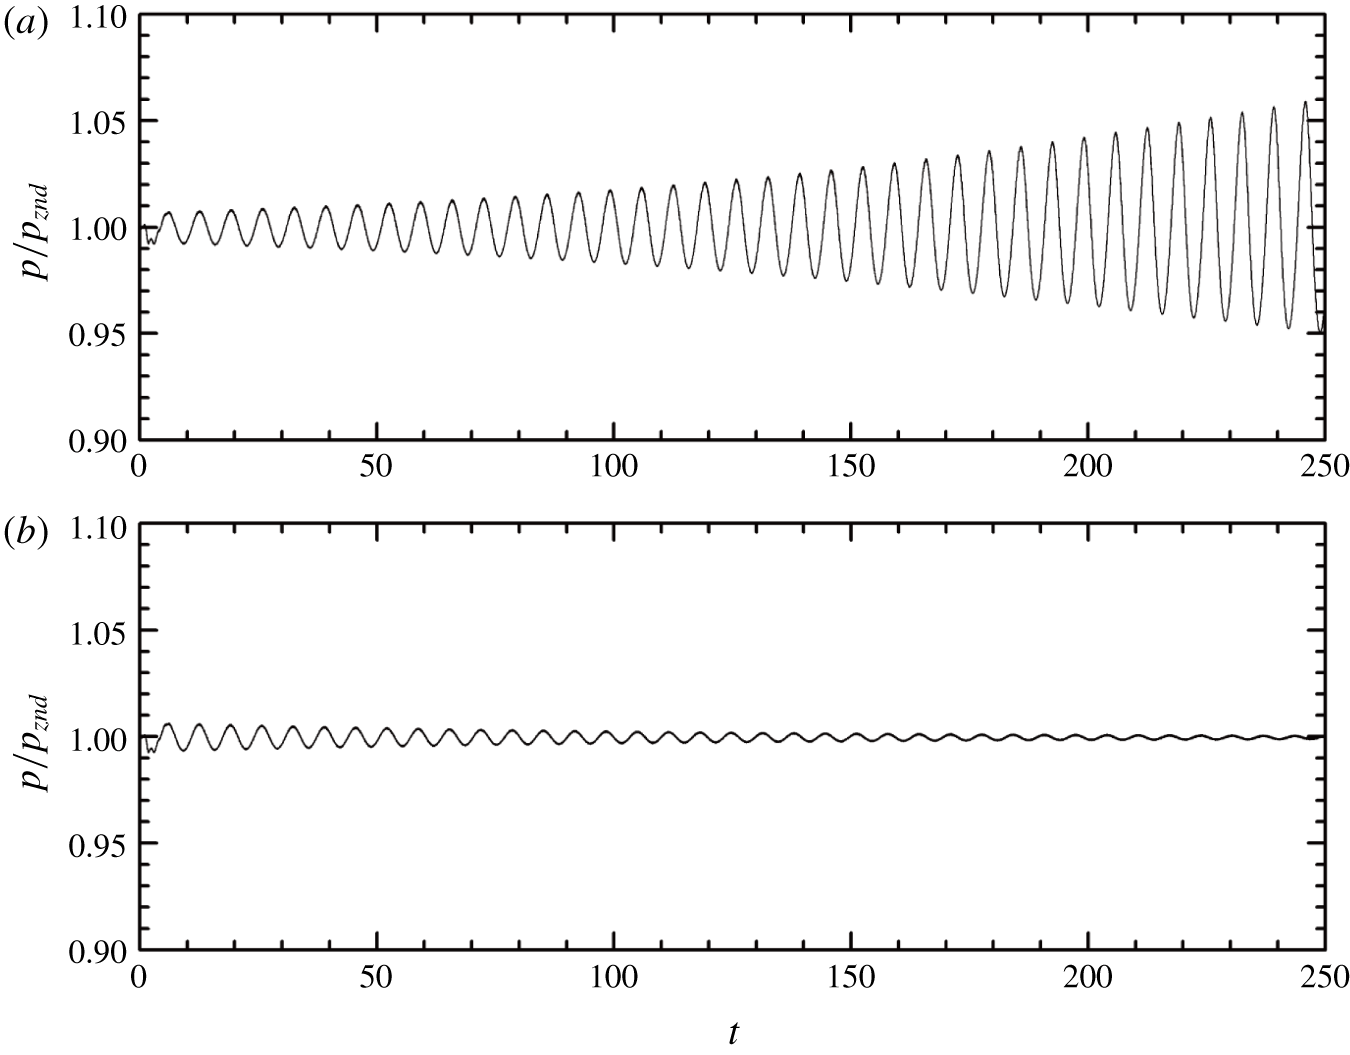
 $f=1.74$ and 1.72, respectively. Note that the one-dimensional simulations are performed using the two-dimensional code, keeping the values along one of the dimensions invariant. Figure 1 shows the history of the peak pressure at the leading shock. When
 $f=1.72$, the initial perturbation gradually increases, and the detonation is unstable, whereas when
 $f=1.74$, the peak pressure converges to the theoretical steady
 $P_{vN}$. The stability boundary for the transition is thus in the vicinity of
 $f=1.73$, which agrees well with the theoretical prediction of He & Lee (Reference He and Lee1995) and the simulation result obtained by Daimon & Matsuo (Reference Daimon and Matsuo2003).
Peak pressure at the leading shock: (a)  $f=1.72$ and (b)
 $f=1.74$.

2.3 Numerical set-up
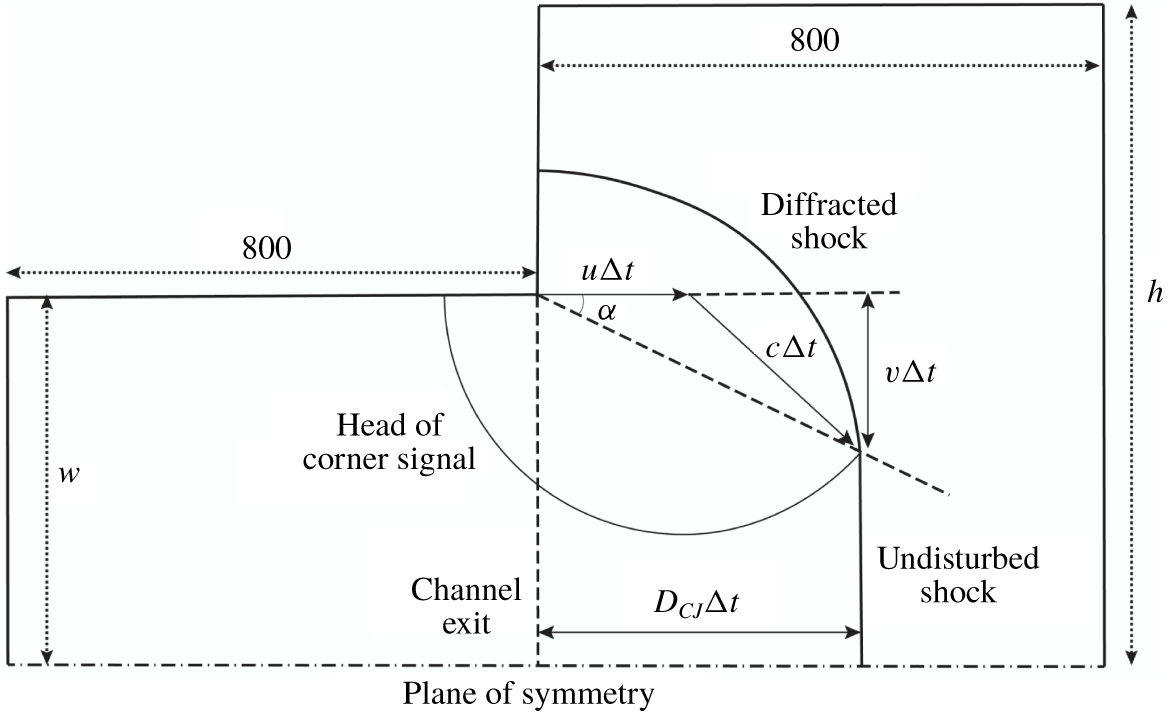
To simulate the diffracted detonation without the influence of the boundary condition at the closed end of the tube, the computational domain consists of a long two-dimensional inlet channel (figure 2), with its right end connected to an unconfined space. The length of the simulation domain corresponding to the inlet channel is  $800\ell _{1/2}$, which is sufficient for a planar detonation wave to reach a steady Chapman–Jouguet (
 $CJ$) detonation and for a cellular detonation wave to fully develop at the exit of the inlet channel. The simulation is terminated when the shock front on the plane of symmetry reaches
 $800\ell _{1/2}$ beyond the exit of the inlet channel. In accordance with the routine experimental set-up (Zhang Reference Zhang2009), a large diffraction chamber with its width at least five times that of the inlet channel is adopted to avoid the shock wave reflection influencing the determination of the critical diffraction condition. The half-width of the computational domain corresponding to the unconfined space (h) ranges from
 $600\ell _{1/2}$ to
 $800\ell _{1/2}$. Reflective boundary conditions are applied to the plane of symmetry and the walls. Zero-gradient boundary conditions are implemented at the top and right sides of the unconfined space.
Schematic of the simulation domain (not to scale).

In this paper, the comparison of detonation diffractions with and without transverse waves is restricted to  $\unicode[STIX]{x1D6FE}=1.2$ and
 $Q=50$. Correspondingly, to maintain a stable planar detonation in the inlet channel, the upper limit of the activation energy is strictly restrained by the neutral stability boundary, i.e.
 $E_{a}=25.26$ (Sharpe Reference Sharpe1997). Meanwhile, for cellular detonation, the degree of cell irregularity and the intensity of triple points are positively correlated with the activation energy. It is known that transverse waves propagate at acoustic velocity at low activation energies and at a higher velocity with increasing
 $E_{a}$ values (Gamezo, Desbordes & Oran Reference Gamezo, Desbordes and Oran1999). Therefore, the choice of
 $E_{a}$ for detonation diffractions with and without transverse waves requires the activation energy to be as close to the neutral stability boundary as possible. However, Sharpe & Falle (Reference Sharpe and Falle2000) noted that the prediction of the neutral stability boundary is highly sensitive to the computational mesh size. If the activation energy is very close to the neutral stability boundary, longitudinal instability will be triggered when performing a rough estimation of the critical channel width using a coarse mesh. Therefore, an activation energy of
 $E_{a}=24$, slightly smaller than the neutral stability boundary, is selected. According to the classification of detonation cellular structure, this can be considered weakly unstable detonation (Austin, Pintgen & Shepherd Reference Austin, Pintgen and Shepherd2005). When
 $E_{a}=24$, it is feasible to study the role of transverse waves in this diffraction problem and to assure stable peak pressure at the leading shock of a one-dimensional detonation wave in the inlet channel.
Notably, the path of the disturbance can be easily estimated from the Skews’ construction (Skews Reference Skews1967; Arienti & Shepherd Reference Arienti and Shepherd2005):
 $$\begin{eqnarray}\tan \unicode[STIX]{x1D6FC}=\frac{\sqrt{c^{2}-(D_{CJ}-u)^{2}}}{D_{CJ}},\end{eqnarray}$$
where  $c$ stands for the local acoustic speed and
 $u$ and
 $D_{CJ}$ are the downstream flow speed and
 $CJ$ detonation wave velocity, respectively. In the current study, the disturbance angle
 $\unicode[STIX]{x1D6FC}$ corresponding to the maximum disturbance velocity is
 $22.45^{\circ }$ (figure 2).
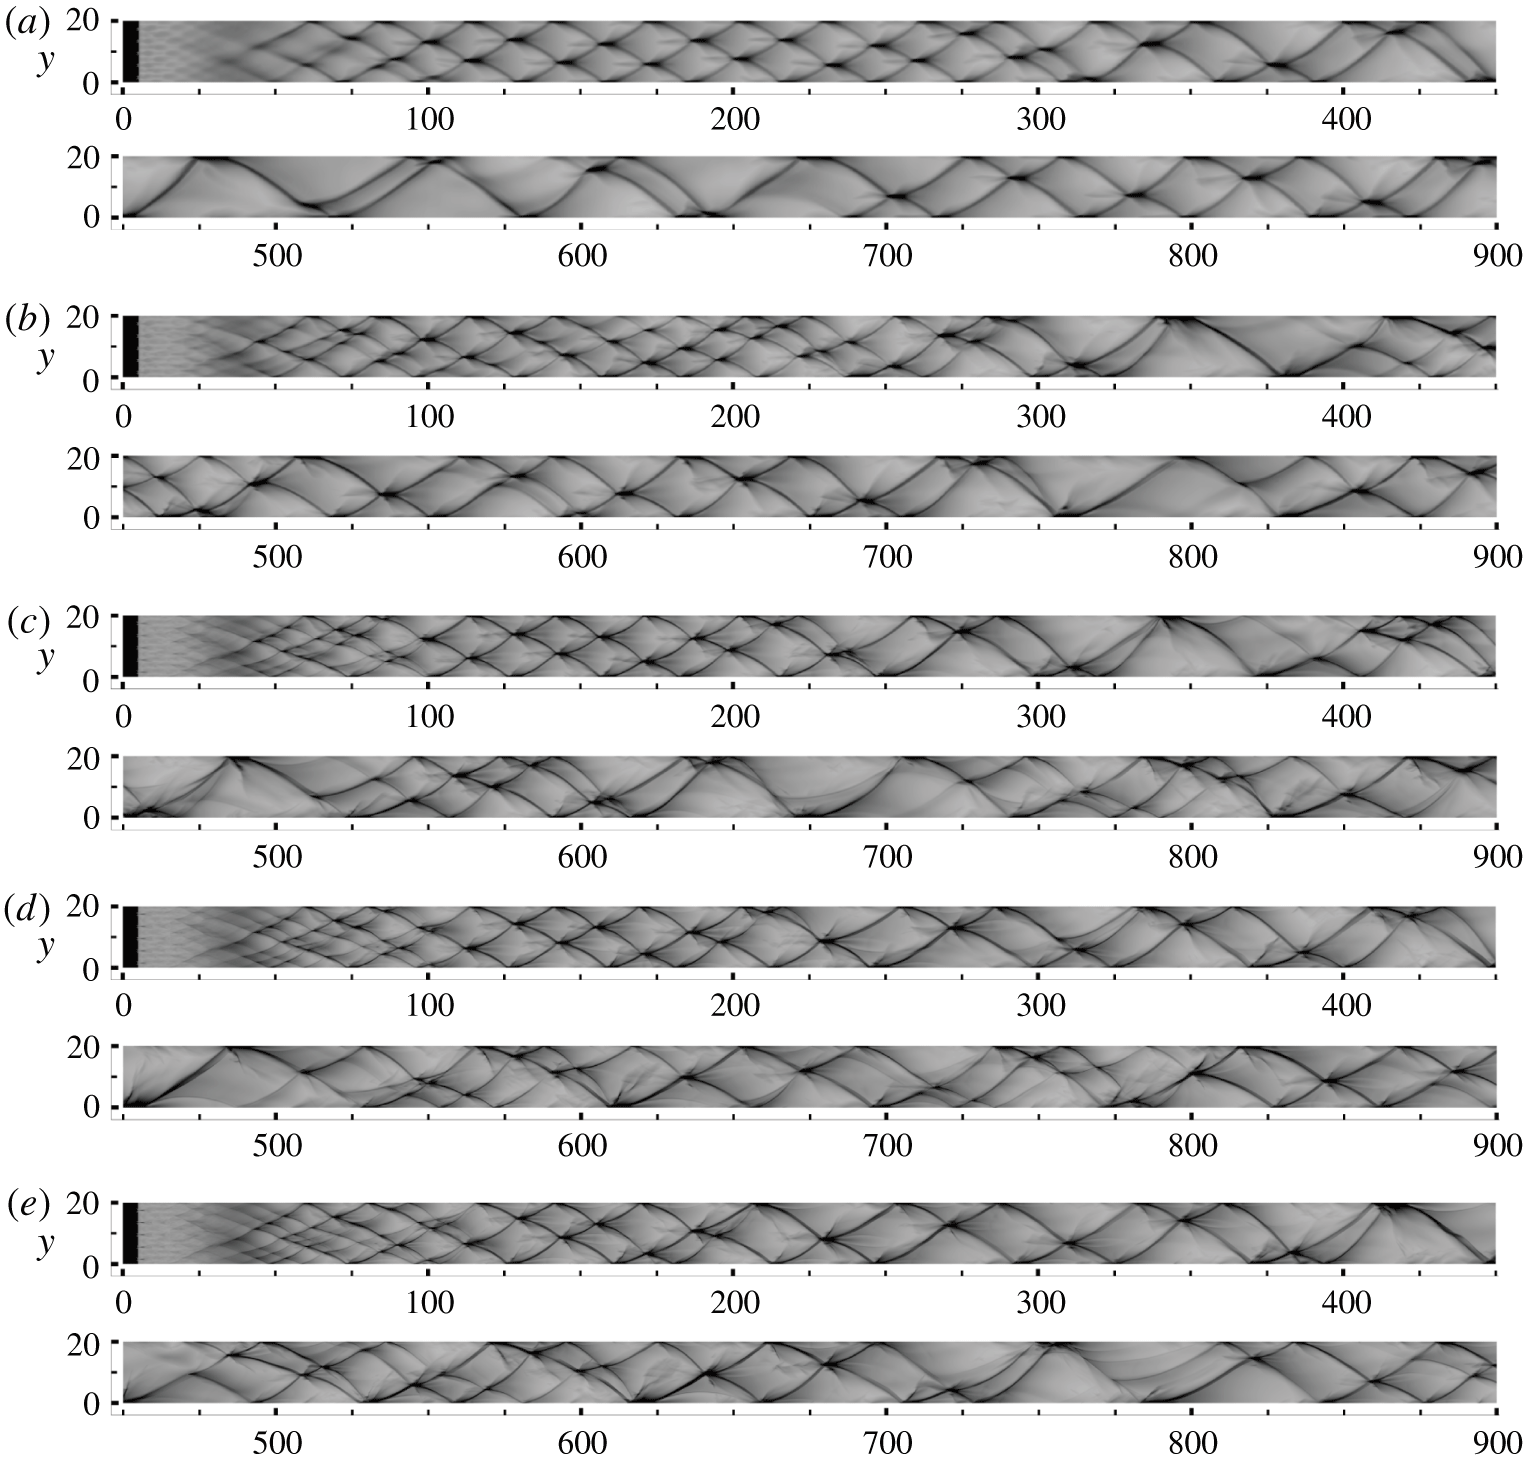
Numerical soot foils for resolutions of (a) 4, (b) 8, (c) 16, (d) 24 and (e)  $32~\text{pts}/\ell _{1/2}$.

To verify grid convergence, five different resolutions are used, corresponding to 4, 8, 16, 24 and  $32~\text{pts}/\ell _{1/2}$. Note that doubling the resolution results in an approximately eightfold increase in computational time. Considering the exceptionally large simulation domain for the diffraction problem, a convergence study using the complete computational domain shown in figure 2 would be prohibitively expensive. As an alternative, the convergence study was performed in a two-dimensional channel
 $20\ell _{1/2}$ wide and
 $900\ell _{1/2}$ long to investigate the long-term cellular dynamics. The numerical soot foils of these simulations are plotted in figure 3, which shows the maximum pressure across the channel. For the lowest resolution of
 $4~\text{pts}/\ell _{1/2}$, the transverse waves have a very regular spacing between
 $x=100$ and
 $x=250$, with three transverse waves across the channel. As the detonation wave propagates further, the transverse waves merge at approximately
 $x=300$. From
 $x=300$ to
 $x=900$, the number of transverse waves flips between one and two. At
 $8~\text{pts}/\ell _{1/2}$, in addition to the strong transverse waves, weak transverse waves are observed at the early stage. Compared to the result for the lowest resolution, the cellular structure is more irregular. When
 $x>300$, the number of transverse waves flips again between one and two, except for the complex interactions between
 $x=400$ and
 $x=500$.
For higher resolutions with 16, 24 and  $32~\text{pts}/\ell _{1/2}$, the cellular dynamics are very similar at
 $x<300$. The long-term cellular behaviour of
 $24~\text{pts}/\ell _{1/2}$ shows striking similarities to that of
 $32~\text{pts}/\ell _{1/2}$. Hence,
 $24~\text{pts}/\ell _{1/2}$ is assumed to be sufficient to resolve the cellular dynamics of the detonation. Although the long-time dynamics of
 $16~\text{pts}/\ell _{1/2}$ is slightly different from those of 24 and
 $32~\text{pts}/\ell _{1/2}$,
 $16~\text{pts}/\ell _{1/2}$ is first used for the preliminary estimation of the critical channel width in § 3.1 to limit the computational cost. Once the critical value is determined,
 $24~\text{pts}/\ell _{1/2}$ is then used for high-precision examination of the structure. The present resolution (
 $24~\text{pts}/\ell _{1/2}$, for
 $\unicode[STIX]{x1D6FE}=1.2$,
 $Q=50$ and
 $E_{a}=24$) agrees with the research of Han et al. (Reference Han, Kong, Gao and Law2017) under the same conditions for cylindrical detonations (
 $20~\text{pts}/\ell _{1/2}$, for
 $\unicode[STIX]{x1D6FE}=1.2$,
 $Q=50$ and
 $E_{a}=24$), and the studies conducted under different conditions (
 $22.5~\text{pts}/\ell _{1/2}$, for
 $\unicode[STIX]{x1D6FE}=1.22$,
 $Q=65.81$ and
 $\unicode[STIX]{x1D703}_{CJ}=E_{a}/T_{vN}\leqslant 4.15$) by Arienti & Shepherd (Reference Arienti and Shepherd2005) and (
 $20~\text{pts}/\ell _{1/2}$, for
 $\unicode[STIX]{x1D6FE}=1.2$,
 $Q=50$ and
 $E_{a}\leqslant 50$) by Shen & Parsani (Reference Shen and Parsani2017).
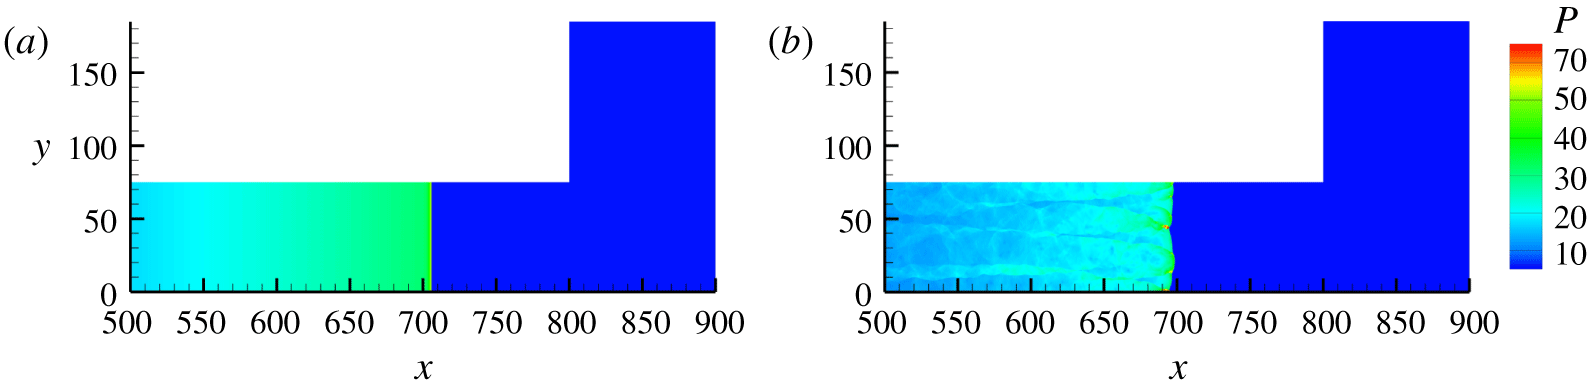
Detonation wave configurations for diffraction study of (a) planar detonation wave and (b) cellular detonation wave.

The number of computational grids for each case with the coarse resolution ( $16~\text{pts}/\ell _{1/2}$) is approximately 180 million, and for the fine resolution (
 $24~\text{pts}/\ell _{1/2}$) it is approximately 410 million. All of the simulations were calculated with message passing interface (MPI) parallelisation on approximately 300 cores in the Tianhe-1A supercomputer system. The computational time was approximately three days for a case with coarse meshes and approximately 10 days for fine meshes.
In this paper, two general configurations are tested. A detonation wave is designated as ‘planar’ if it lacks transverse instabilities (figure 4a); otherwise it is designated as ‘cellular’ (figure 4b). For planar detonation diffraction, the detonation is ignited near the closed end of the inlet channel ( $l_{ig}=5$) by a uniform high-pressure and high-temperature strip with
 $T_{ig}=20$ and
 $P_{ig}=150$. It should be noted that multi-dimensional detonation waves with Arrhenius kinetics are unconditionally unstable (Short & Stewart Reference Short and Stewart1998). Numerical truncation errors can induce the transverse instability after the wave propagates a few hundred half-reaction-lengths (Khasainov, Virot & Veyssière Reference Khasainov, Virot and Veyssière2013; Benmahammed et al. Reference Benmahammed, Veyssiere, Khasainov and Mar2016). Thus, in the inlet channel region, the planar detonation flow is calculated in a one-dimensional manner. Once it enters the unconfined space, the numerical scheme is changed to a two-dimensional version. In this way, there is no transverse oscillation at the exit of the inlet channel for the planar detonation flow. For cellular detonation diffraction, the detonation is ignited by a perturbed high-pressure and high-temperature region with the same thermodynamic conditions as in the planar detonation. The results are presented in the next section, in which numerical schlieren images are plotted according to the function
 $$\begin{eqnarray}\unicode[STIX]{x1D708}=\exp \left[-\unicode[STIX]{x1D707}\min \left(\frac{|\unicode[STIX]{x1D735}\unicode[STIX]{x1D70C}|}{|\unicode[STIX]{x1D735}\unicode[STIX]{x1D70C}|_{max}},\unicode[STIX]{x1D701}\right)\right],\end{eqnarray}$$
where  $|\unicode[STIX]{x1D735}\unicode[STIX]{x1D70C}|$ represents the density gradient magnitude,
 $\unicode[STIX]{x1D707}$ is the amplification parameter to accentuate weak features of the flow and
 $\unicode[STIX]{x1D701}~({\leqslant}1)$ is an adjustable parameter to guarantee the computability of the equation. The greyscale contours of the numerical schlieren images are plotted in a range of 0–1.
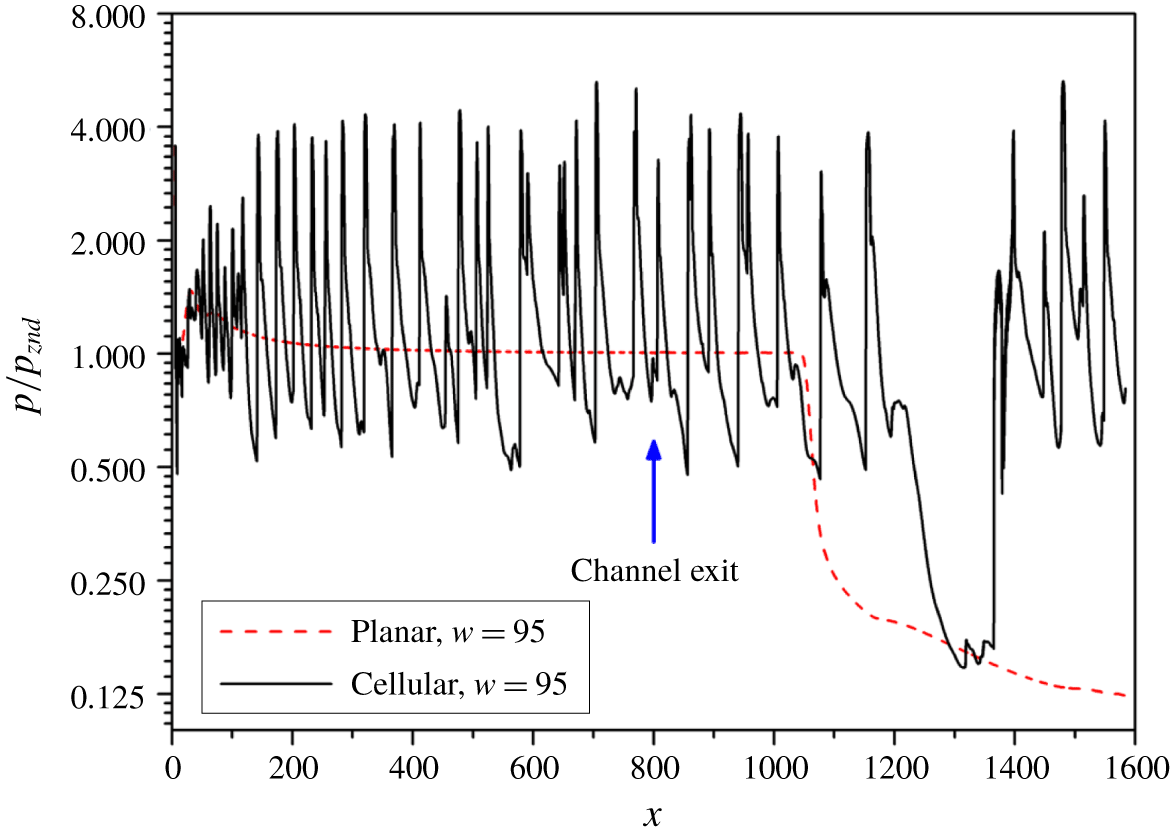
Pressure histories of planar and cellular detonation diffractions along the plane of symmetry for  $w=95$ and
 $16~\text{pts}/\ell _{1/2}$.

3 Results
3.1 Critical channel widths
To identify the critical channel width, a series of numerical tests with a relatively coarse resolution ( $16~\text{pts}/\ell _{1/2}$) were performed first. Figure 5 compares the peak pressure history along the plane of symmetry for planar and cellular detonations with a channel width
 $w=95$. For planar detonation, as the activation energy is very close to the neutral stability boundary, the von Neumann pressure gradually decays to the
 $CJ$ value at approximately
 $x=500$. After the wave front passes through the channel exit, the pressure remains constant until approximately
 $x=1030$. Beyond this point, the pressure keeps dropping due to the expansion waves from the corner, which attenuate the shock strength and, consequently, the induced heat release rate with the maximum disturbance velocity in the reaction zone (Arienti & Shepherd Reference Arienti and Shepherd2005). The shock remains weak, and re-initiation does not occur within the computational domain. In contrast, for cellular detonation, the amplitude of the pressure oscillation is large and irregular inside the inlet channel due to the interaction of multi-dimensional instabilities. The high-pressure oscillation lasts much longer (
 $x\cong 1200$) in the cellular detonation than in the planar detonation due to the impingements of the transverse waves. A strong pressure jump is then observed after a period of low pressure (i.e. at a minimum of approximately 0.15) at
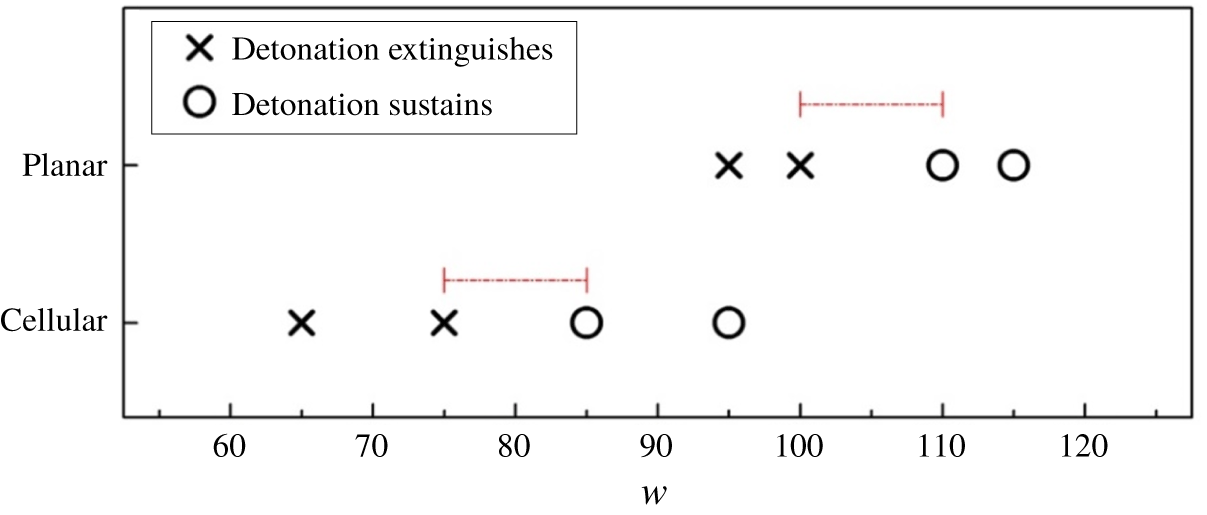
 $x\cong 1200$–1380. The distinct difference between these two cases indicates that transverse waves may facilitate the re-initiation of the detonation wave. To acquire the precise critical channel widths for both scenarios, we simulated another six cases. Figure 6 shows that the critical channel half-width for planar detonation diffraction lies between
 $w=100$ and
 $w=110$, while the critical value for cellular detonation diffraction is between
 $w=75$ and
 $w=85$. The critical channel width predicted using a cellular detonation wave is smaller than that predicted using a planar detonation wave.
To establish the detailed re-ignition processes of different scenarios, in the following sections, two sets of simulations with a grid resolution of  $24~\text{pts}/\ell _{1/2}$ are conducted, with each set covering the near-critical cases (successful/failed detonation transmission) for both the planar detonation and the cellular detonation. A more rigorous analysis of the entire domain is provided below.
Summary of planar and cellular detonation diffractions for  $16~\text{pts}/\ell _{1/2}$.

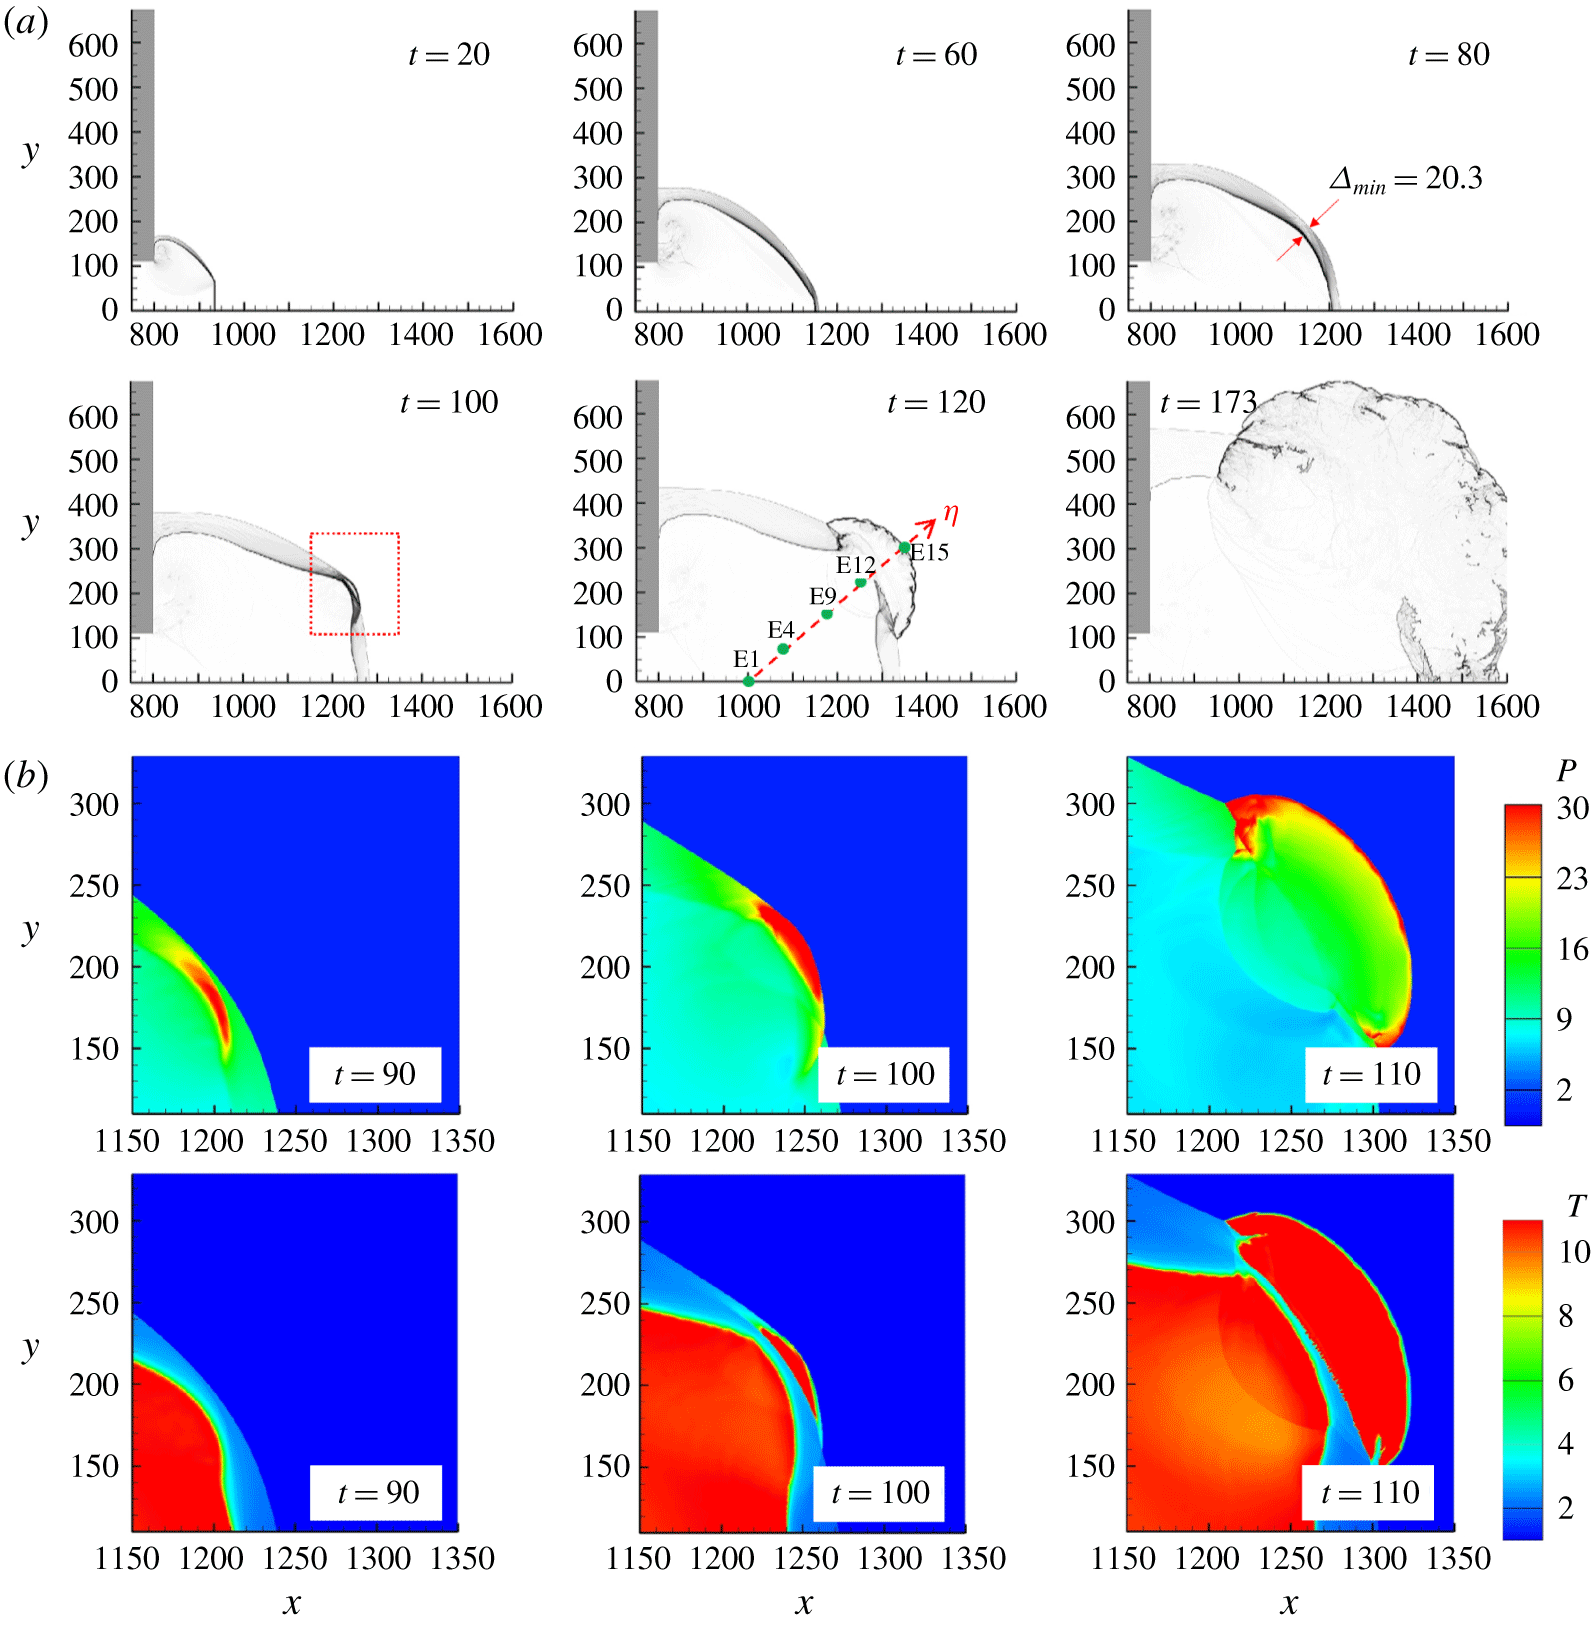
(a) Numerical schlieren images for planar detonation diffraction with  $w=110$. Green dots indicate the initial positions of sample massless particles (E1–E19) along the
 $\unicode[STIX]{x1D702}$ direction. (b) Close-up of the formation of the re-initiation bubble between
 $t=90$ and
 $t=110$.

3.2 Diffraction of the planar detonation wave
We set the reference time  $t=0$ when the wave front reaches the channel exit at
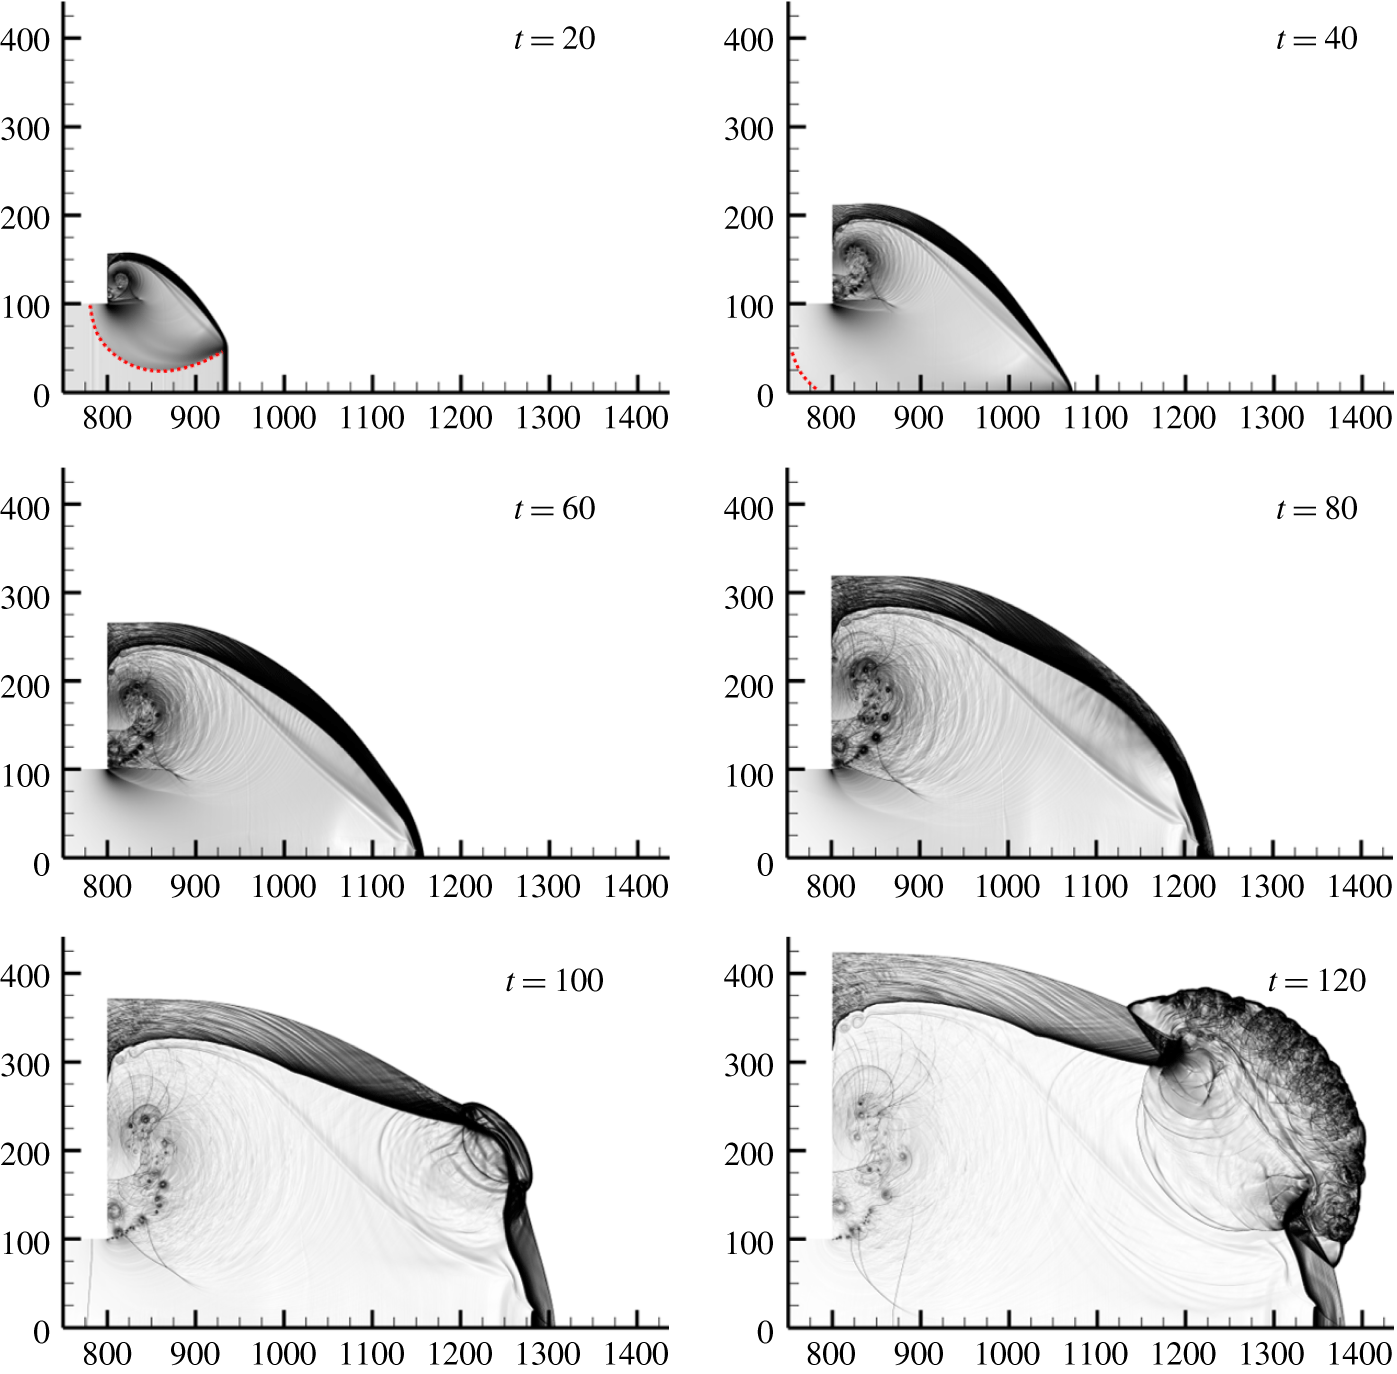
 $x=800$. The overall process for successful re-initiation is first examined. Figure 7(a) presents the numerical schlieren images (
 $\unicode[STIX]{x1D707}=200$,
 $\unicode[STIX]{x1D701}=1$) for diffraction with a channel half-width
 $w=110$. At
 $t=20$, the lower part of the leading shock is not influenced by the disturbance originating from the corner and remains in a uniform planar detonation wave, while the upper shock wave is weakened and curved. From
 $t=20$ to
 $t=80$, the corner disturbance intersects with the shock–flame structure, which is analogous to Skew’s construction in figure 2. The disturbance then reflects from the plane of symmetry and engages with the curved diffracted shock. At
 $t=80$, it is interesting to note that the minimum distance
 $\unicode[STIX]{x1D6E5}_{min}$ between the curved shock and the flame is larger than 20 half-reaction-lengths. The shock is completely decoupled from the flame. A pressure pulse is established and, when it overtakes the shock at
 $t=100$, a separate burned region forms close to the shock. The corresponding high-pressure region (
 $p>30$) is now attributed to the more vigorous reaction and this energises the shock wave to facilitate the re-initiation of a cylindrical expanding detonation wave.
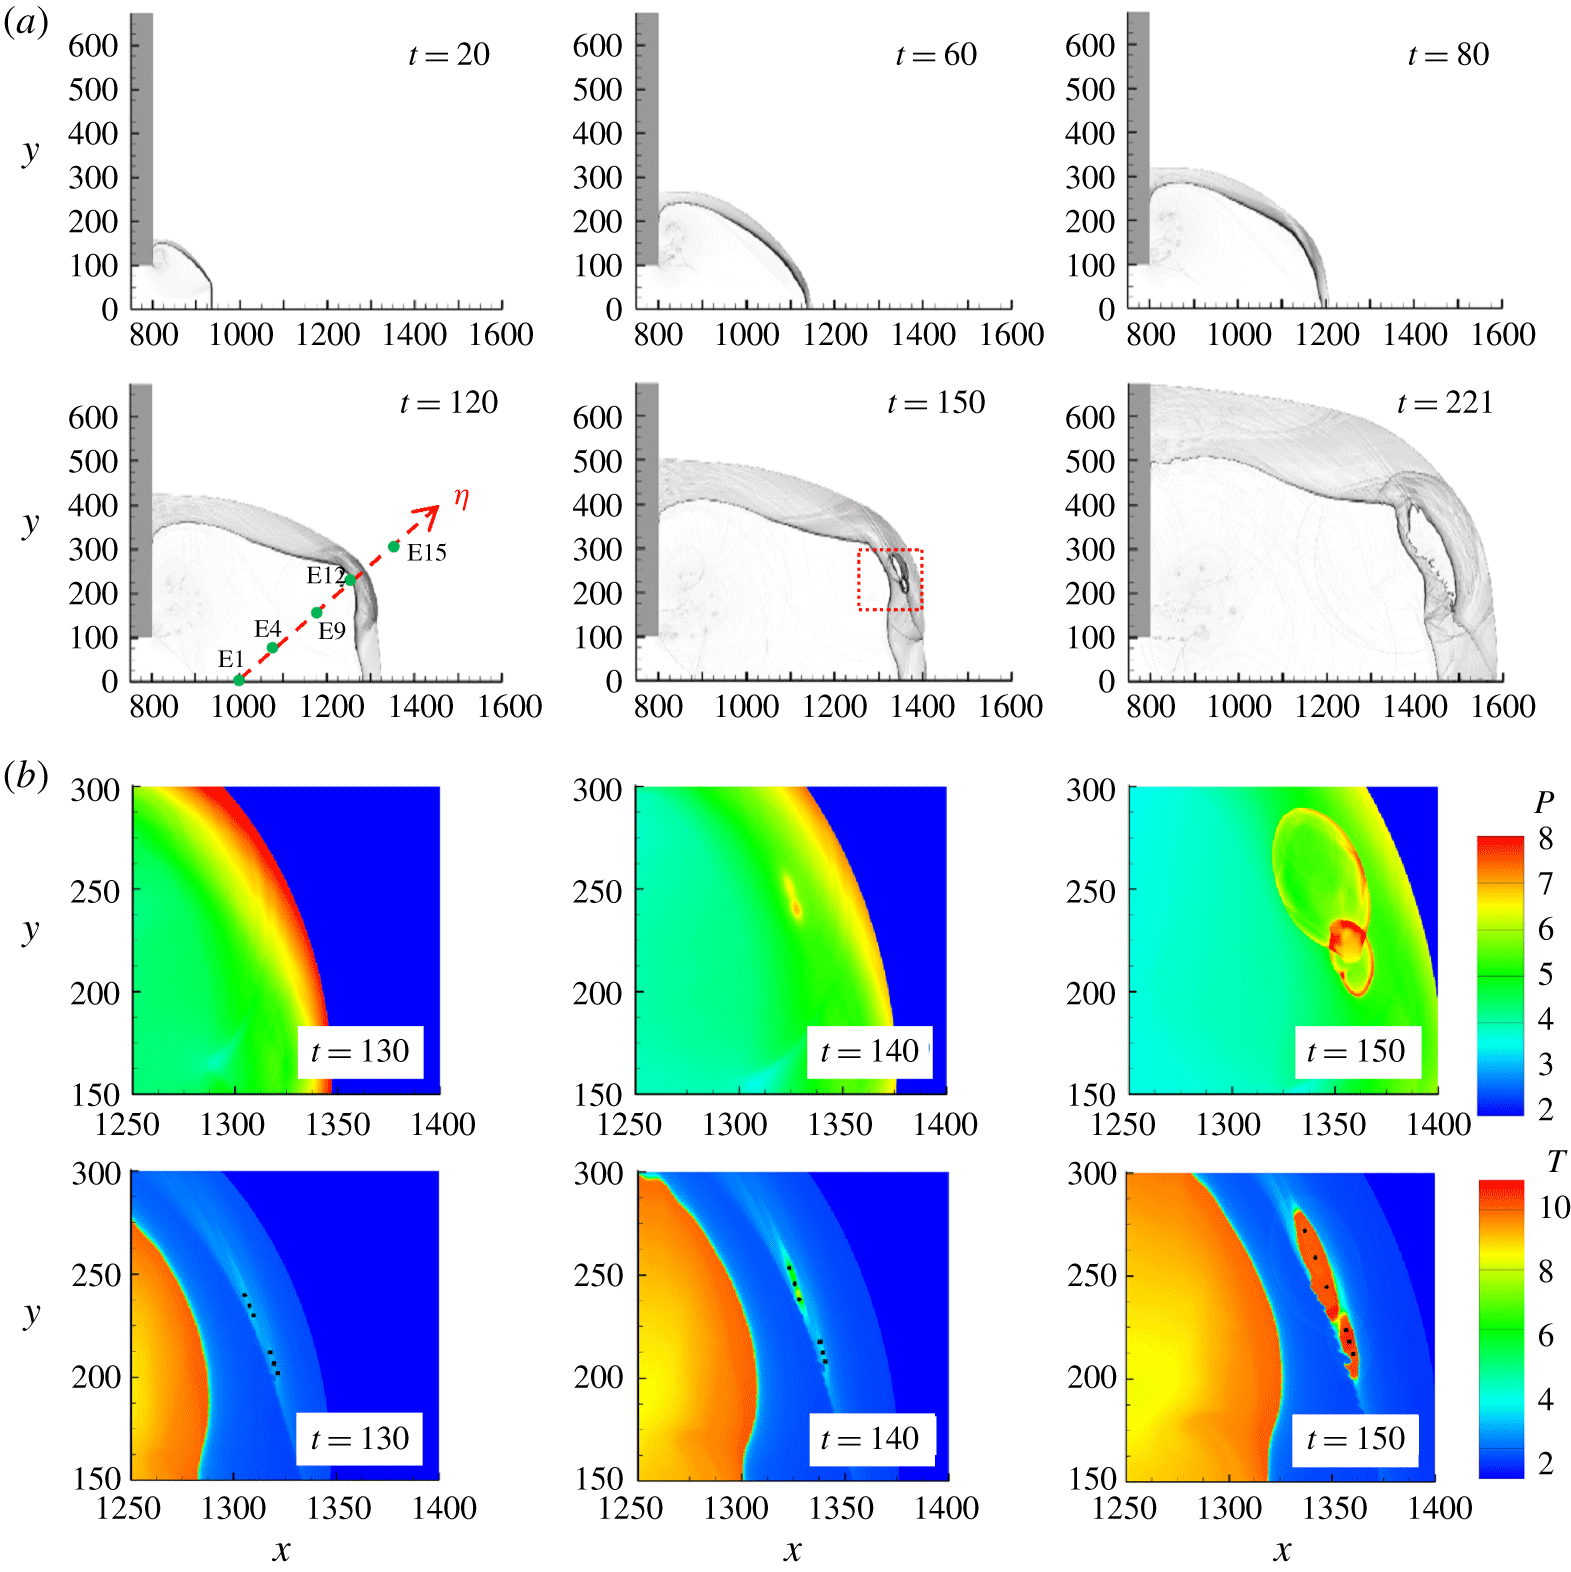
Particle analyses are presented in this work for better interpreting the formation of the re-initiation bubble; this will be investigated in detail in § 3.2.1. At  $t=120$, the size of the hot bubble grows rapidly, and the induced transverse waves sweep across the shocked but unreacted mixture. The
 $\unicode[STIX]{x1D702}$ direction is defined perpendicular to the shock surface near the location of the re-initiation bubble at
 $t=120$. Massless particles located along this direction, E1–E19, are injected into the flow at the beginning of simulations for analysis in § 3.2.1. Thermal data along this direction will be extracted later for discussion. The shock wave generated by the intensive reaction propagates backwards into the products. Meanwhile, the interaction of nonlinear wave propagation and chemical reaction (INWPCR) mechanism plays the main role in the generation of transverse waves (Jiang & Teng Reference Jiang and Teng2012). The highly temperature-dependent reaction rate behind the curved shock front triggers the instabilities near the shock front to form transverse waves. From
 $t=120$ to
 $t=173$, the hot bubble evolves into cylindrical detonation. Figure 7(b) shows a close-up of the formation of the re-initiation bubble.
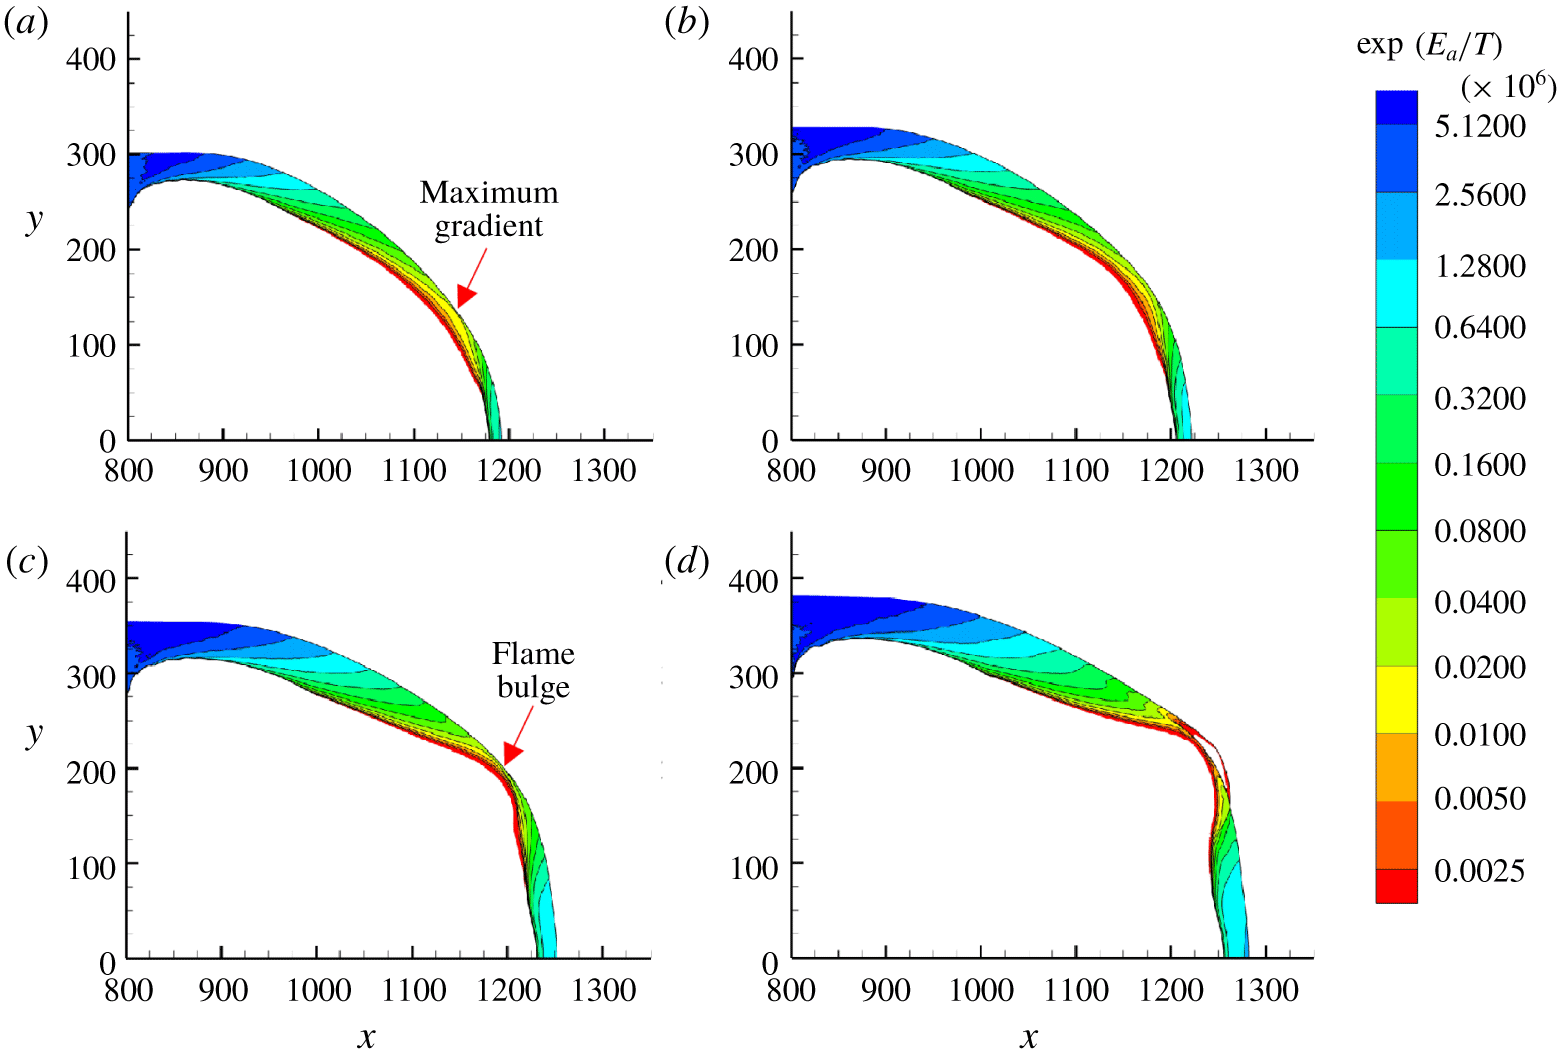
The re-initiation process is further examined for  $t=70{-}100$. The contours of the reference induction time
 $\unicode[STIX]{x1D70F}\sim \exp (E_{a}/T)$ (Radulescu & Borzou Reference Radulescu and Borzou2018), which do not represent the real induction time, is plotted in figure 8. The reference induction time spans several orders of magnitude in the shocked but unreacted area. The zone with the smallest induction time and the largest gradient of induction time is at the upper right side near the flame front. Owing to the large gradient of induction time of the shocked but unreacted gas (along the
 $\unicode[STIX]{x1D702}$ direction), a bulge of flame is observed at the top right during
 $t=70{-}100$. As the simulation proceeds, at
 $t=100$, a hot bubble appears near this location (
 $x=1250$,
 $y=220$). The re-initiation occurs when the pressure pulse overtakes the diffracted shock wave. The acceleration of the flame can be attributed to the existence of a large induction time gradient (Kapila et al. Reference Kapila, Schwendeman, Quirk and Hawa2002), and the synchronisation between the shock wave and heat release can be explained by the shock wave amplification by a coherent energy release (SWACER) mechanism (Lee, Knystautas & Yoshikawa Reference Lee, Knystautas and Yoshikawa1978; Lee Reference Lee2008).
Reference induction time of the shocked but unreacted gas for planar detonation diffraction with  $w=110$: (a)
 $t=70$, (b)
 $t=80$, (c)
 $t=90$ and (d)
 $t=100$. For clarity, data for gas ahead of the shock and the burned gas (
 $\unicode[STIX]{x1D706}<0.5$) are not shown.

The diffraction with a slightly smaller inlet half-channel width ( $w=100$) is shown in figure 9(a). From
 $t=20$ to
 $t=80$, the major structures of the waves are almost the same as those for
 $w=110$. Nevertheless, the hot bubble forms much later than that in the
 $w=110$ case. Moreover, the energy generated by the bubbles is too weak to accelerate the leading shock. At
 $t=150$, a new reaction zone is formed and detached from the major reacted area. Consequently, the reaction-induced pressure waves are decoupled from the reaction zone (
 $t=150$ to
 $t=221$), and thus detonation does not occur. Again, the thermodynamic data along the
 $\unicode[STIX]{x1D702}$ direction at
 $t=120$ in figure 9(a) are recorded for comparison later. Figure 9(b) shows the enlarged pressure and temperature contours in the bubble formation area at
 $t=130{-}150$. Note that the pressure remains significantly low (
 $p=5{-}8$) during the reaction process. Two major reaction regions are observed at
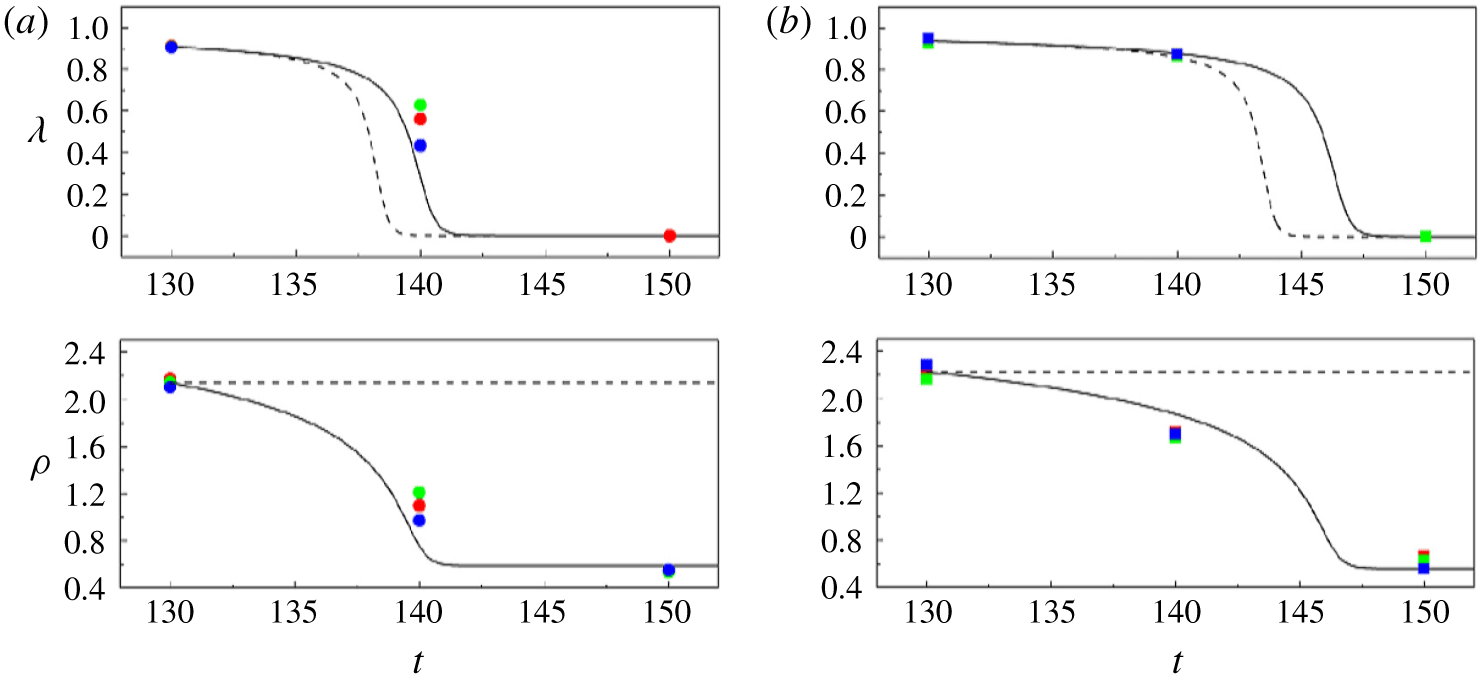
 $t=150$. Three points are then extracted for both regions (see temperature contours in figure 9b) at each time step for the quantitative study. The reaction parameter and density agree well with the prediction of constant-pressure calculation (figure 10). Summarily, for the case with
 $w=100$, the constant-pressure reaction of the gas behind the diffracted shock cannot enhance the shock front to transit to detonation.
(a) Numerical schlieren images for the planar case with  $w=100$. Green dots indicate the initial positions of sample massless particles (E1–E19) along the
 $\unicode[STIX]{x1D702}$ direction. (b) Enlarged pressure and temperature contours during the formation of the reactive bubble between
 $t=130$ and
 $t=150$.

Comparison of the thermodynamic conditions of the three points extracted from (a) the upper region and (b) the lower region in the temperature contours in figure 9b) (symbols), with the computed data using constant-volume (dashed line) and constant-pressure (solid line) assumptions.

Pressure and temperature profiles and shock velocities along the  $\unicode[STIX]{x1D702}$ direction: (a,c)
 $w=110$ and (b,d)
 $w=100$.

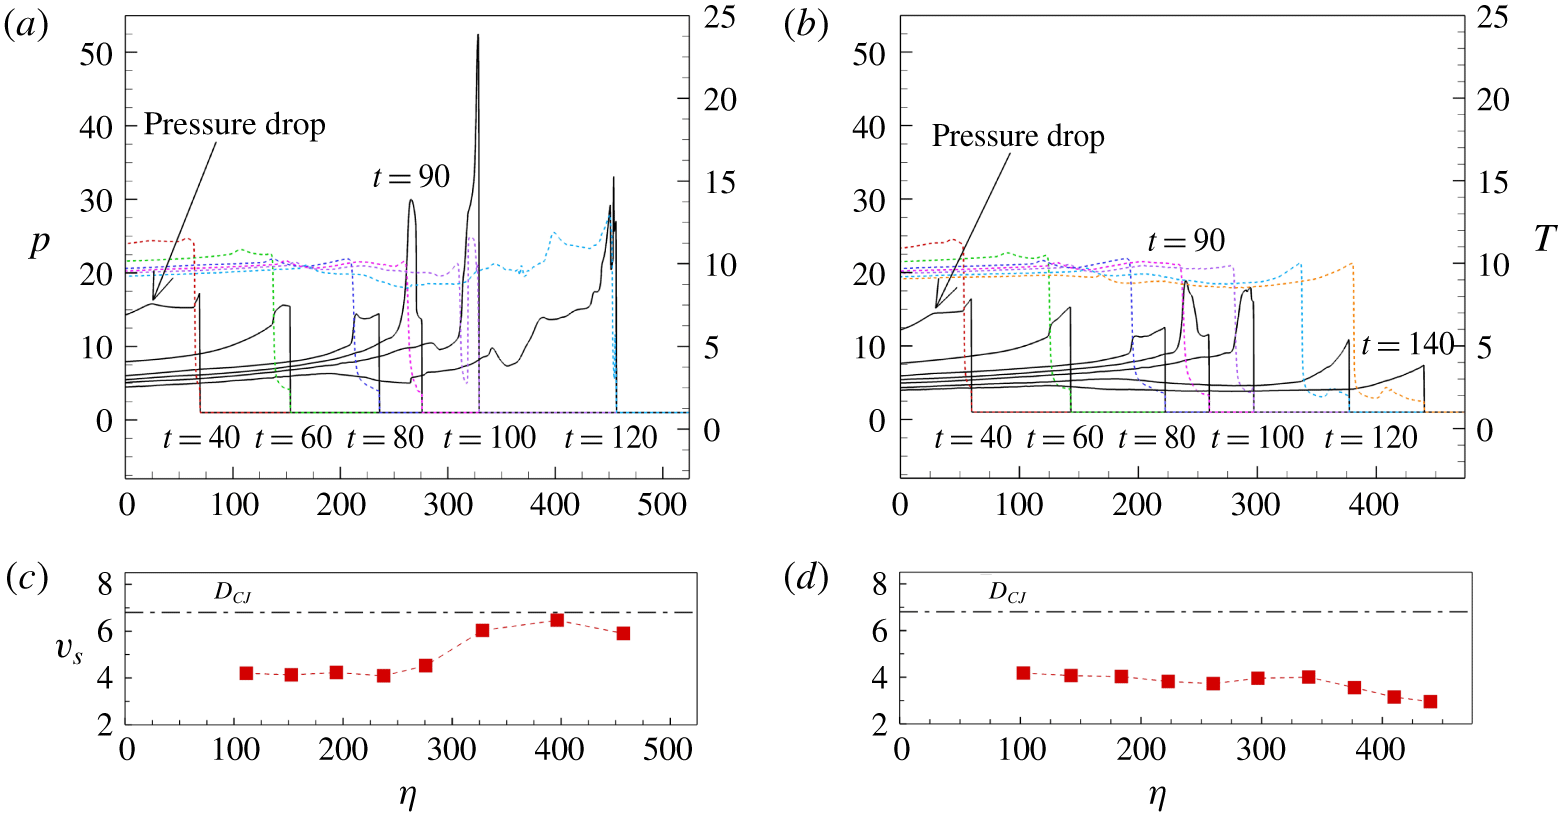
To quantify the differences in the re-initiation processes of the two inlet channel widths ( $w=100$ and 110), the thermodynamic data along the
 $\unicode[STIX]{x1D702}$ direction in figures 7(a) and 9(a) are presented in figure 11. The
 $\unicode[STIX]{x1D702}$ direction is almost parallel to the flow direction for
 $t=40{-}120$ in the
 $w=110$ case and for
 $t=40{-}150$ in the
 $w=100$ case. When
 $w=110$, the pressure contour follows a similar pattern to the critical regime of one-dimensional detonation ignition. The initial decoupling of the shock–flame structure is due to the corner expansion disturbance propagating inside the reaction zone. From
 $t=40$ to
 $t=80$, the length of the shocked but unreacted region (i.e. the distance between the pressure and temperature profiles) continues to increase. Owing to the negative temperature gradient from the flame front to the leading shock from
 $t=80$ to
 $t=90$, a pressure pulse is formed and steepened towards the shock. The birth and amplification of the pressure pulse is in compliance with the scenario of a relatively large temperature gradient for one-dimensional ignition as discussed in Kapila et al. (Reference Kapila, Schwendeman, Quirk and Hawa2002). The collision of this pressure pulse and the leading shock produced a single stronger shock to accelerate the reaction.
In contrast, when  $w=100$, though a pressure pulse is formed, its strength is comparatively weak. The shock strength remains insufficient after it has engaged with the pressure pulse. The decoupling process continues, and the shock velocity drops below
 $0.45D_{CJ}$. For the re-initiation failure case at
 $t=40$, the pressure near the plane of symmetry region is slightly lower than that in the successful re-initiation case. The most plausible explanation for these findings is that the modest decrease in pressure leads the pressure profile to become broader and the amplitude to decrease from
 $t=50$ to
 $t=80$. Interestingly, the pressure drop near the plane of symmetry is the result of the reflected rarefaction wave originating from the corner. The only difference between the two cases is that, in the re-initiation failure case, the reflection of the rarefaction wave from the plane of symmetry is earlier and the reflected wave is less weakened due to the smaller channel width. The re-initiation seems to be controlled by the reflected rarefaction wave, especially for these two cases near the critical regime. This is further discussed in § 3.3.
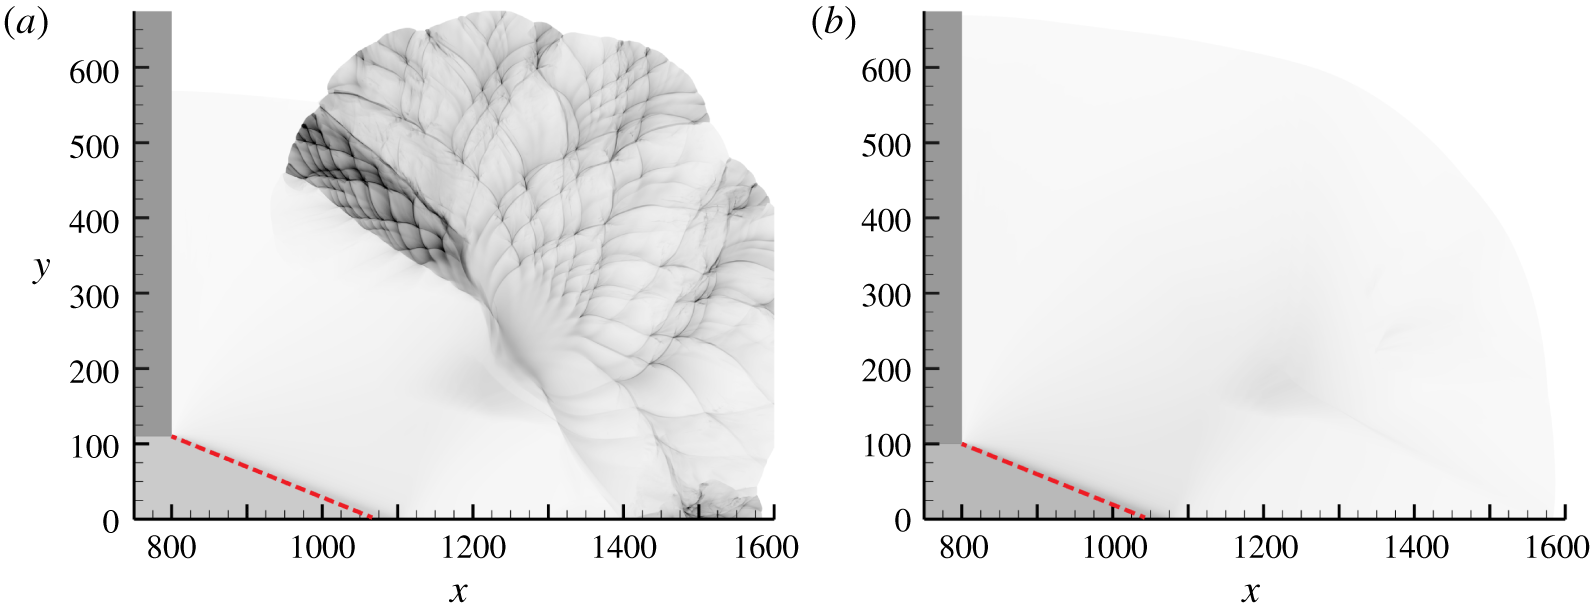
Figure 12 shows the numerical soot foil images for planar cases. For both cases, the disturbance angle agrees well with the prediction generated by the Skews’ construction. The reaction is quickly quenched as the expansion disturbance attenuates the shock wave. In the  $w=110$ case (figure 12a), the re-initiation is established far from the disturbance trajectory at the location in which maximum pressure occurs (
 $x=1250$,
 $y=220$). The local exothermicity for the
 $w=100$ case (figure 12b) is comparatively weak, and the re-establishment of the detonation wave is unsuccessful.
Numerical soot foils for planar detonation diffractions for (a)  $w=110$ and (b)
 $w=100$. The red dashed line indicates the disturbance trajectory.

3.2.1 Particle analysis
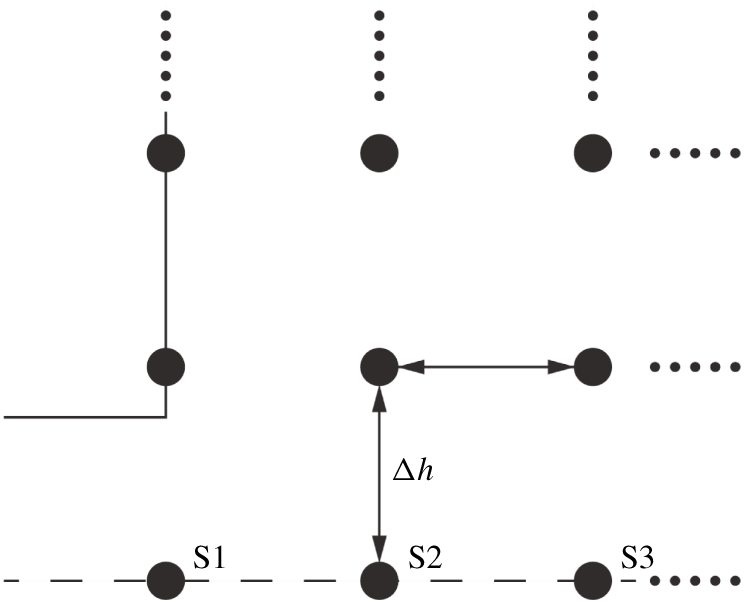
Lagrangian particles are injected into the flow, and the thermodynamic behaviours of these massless particles are traced to understand the mechanism leading the diffracted detonation wave to fail or re-initiate. Particles were initially distributed in the unconfined space with a uniform distance of  $\unicode[STIX]{x0394}h=25$ (figure 13). The positions of these particles are updated according to the local flow velocity at each computational time step. According to the temperature reaction zone structure equation developed by Arienti & Shepherd (Reference Arienti and Shepherd2005, equation (2.13)), the Lagrangian derivative of temperature can be decomposed into four terms representing heat release, shock curvature, transverse divergence and unsteadiness.
Initial locations of the Lagrangian particles in the simulation domain.

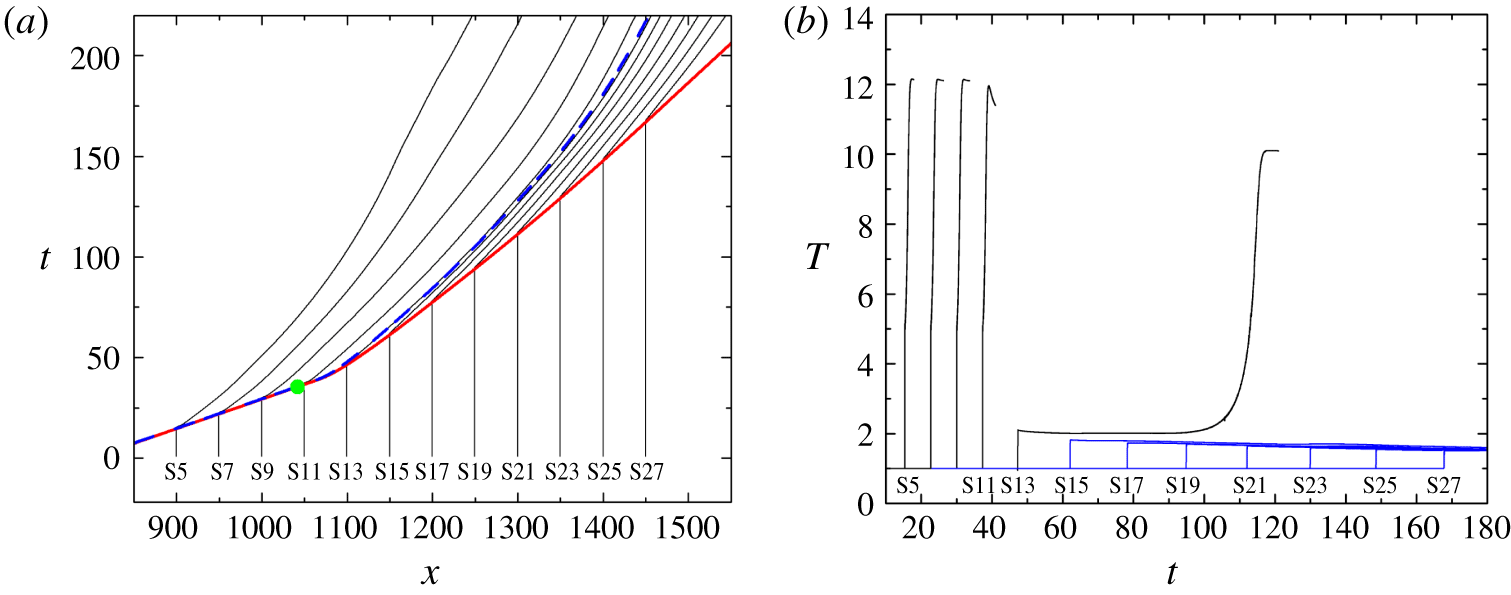
(a) Particle paths for particles on the plane of symmetry for the planar case with  $w=100$. The solid red line indicates the
 $x$–
 $t$ diagram of the leading shock wave; the dashed blue line depicts the
 $x$–
 $t$ diagram of half-reaction completion; and the green dot indicates the theoretical intersection point predicted by the Skews’ construction. (b) Temperature profiles along the particle paths. For ease of illustration, lines are omitted once the particles are mostly reacted, and blue lines show the particles that are still non-reacted until the end of the simulation.

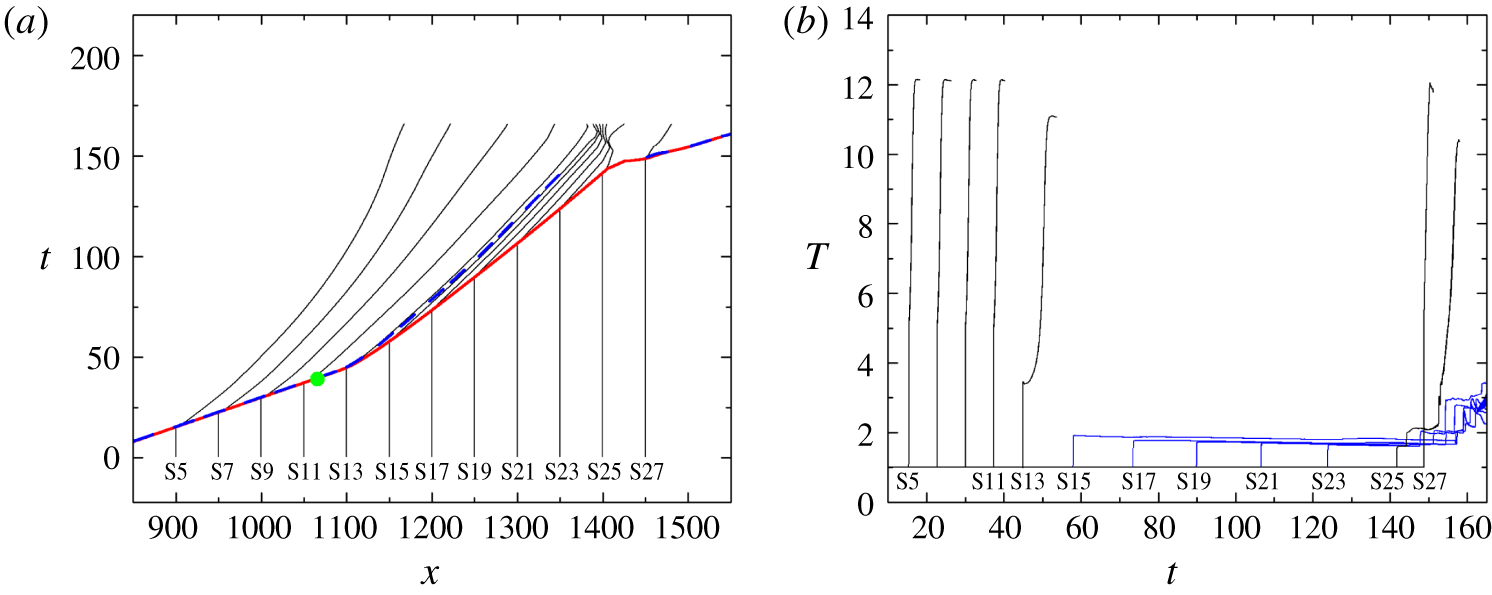
(a) Particle paths for particles on the plane of symmetry for the planar case with  $w=110$. The solid red line indicates the
 $x$–
 $t$ diagram of the leading shock wave; the dashed blue line depicts the
 $x$–
 $t$ diagram of half-reaction completion; and the green dot indicates the theoretical intersection point predicted by the Skews’ construction. (b) Temperature profiles along the particle paths.

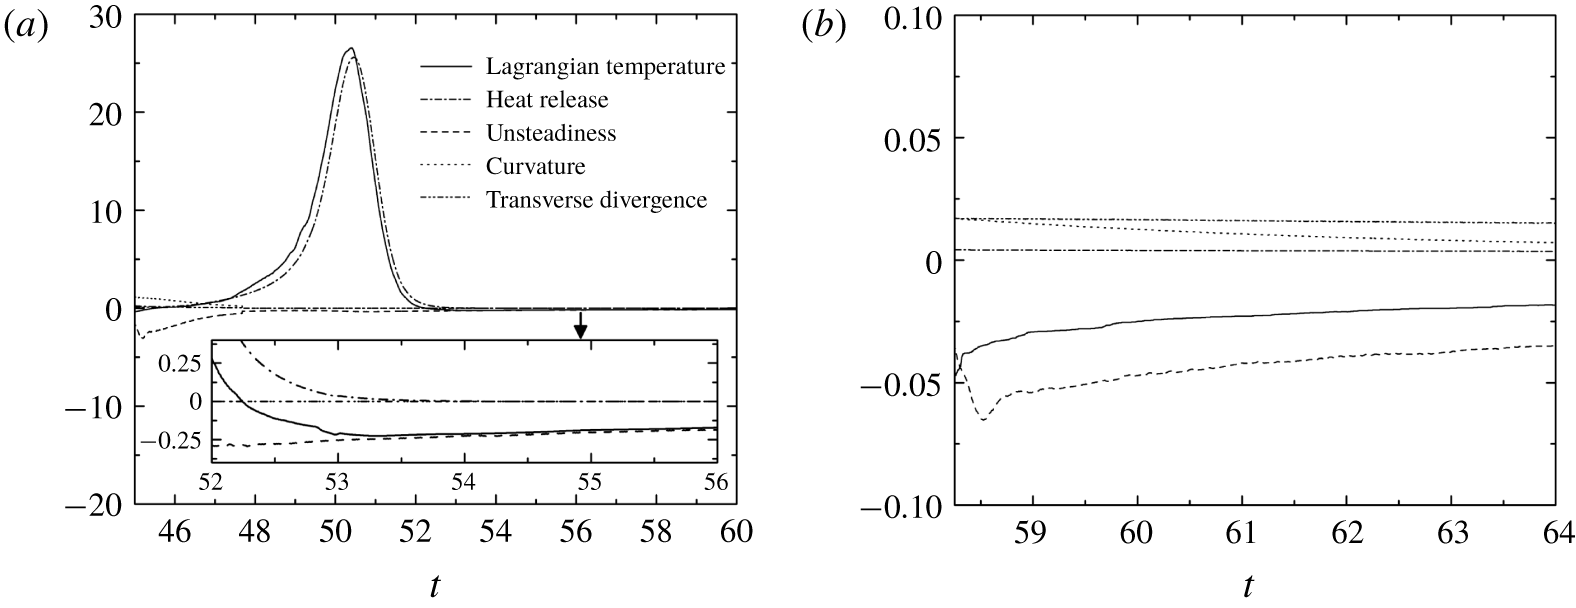
Terms in the Lagrangian temperature derivative for particles on the plane of symmetry in the planar case with  $w=110$: (a) S13 and (b) S15.

The particles on the plane of symmetry are labelled as S1,  $\text{S}2,\ldots ,\text{S}27$. In the planar case with
 $w=100$, the theoretical intersection of the disturbance line with the plane of symmetry is at
 $(x,y)=(1042,0)$. The shock wave speed at the initial location of S11 (
 $x=1050$) is almost unchanged compared with S5–S9 (see the slope in the
 $x$–
 $t$ diagram of the leading shock wave in figure 14a). The early interaction of the corner disturbance results in only a minor decrease of the temperature jump across the shock for S11 (figure 14b). The shock velocity reduces to 56 % of
 $D_{CJ}$ when the shock front reaches S13, and the ignition of S13 is significantly delayed. The temperature jump across the shock for particles S15–S27 decreases gradually, followed by a negative temperature gradient to further reduce the reaction rates of these particles. The trajectories of S15–S27 never cross the trajectory of half-reaction completion until the end of the simulation (figure 14a). This indicates that the reactions along the plane of symmetry are quickly quenched after the corner expansion’s arrival.
In the planar case with  $w=110$, the theoretical intersection point is at
 $(x,y)=(1066,0)$. The reactions of particles S5–S11 are unaffected by the corner disturbance. The ignition of S13 is moderately delayed because its shock velocity remains at approximately 93 % of
 $D_{CJ}$. Similarly, the decayed shock wave (figure 15a) and the negative temperature gradient between S15 and S23 (figure 15b) quench the reaction to approximately
 $t=147$. These particles remain unburned until the end of the simulation, as observed by the large unreacted pocket near the plane of symmetry at
 $x=1400$ in figure 7(a) (
 $t=173$). S25 and S27 are ignited by the impingement of the transverse waves originating from the re-initiation bubble. The maximum half-reaction-length along the plane of symmetry is approximately 71 at
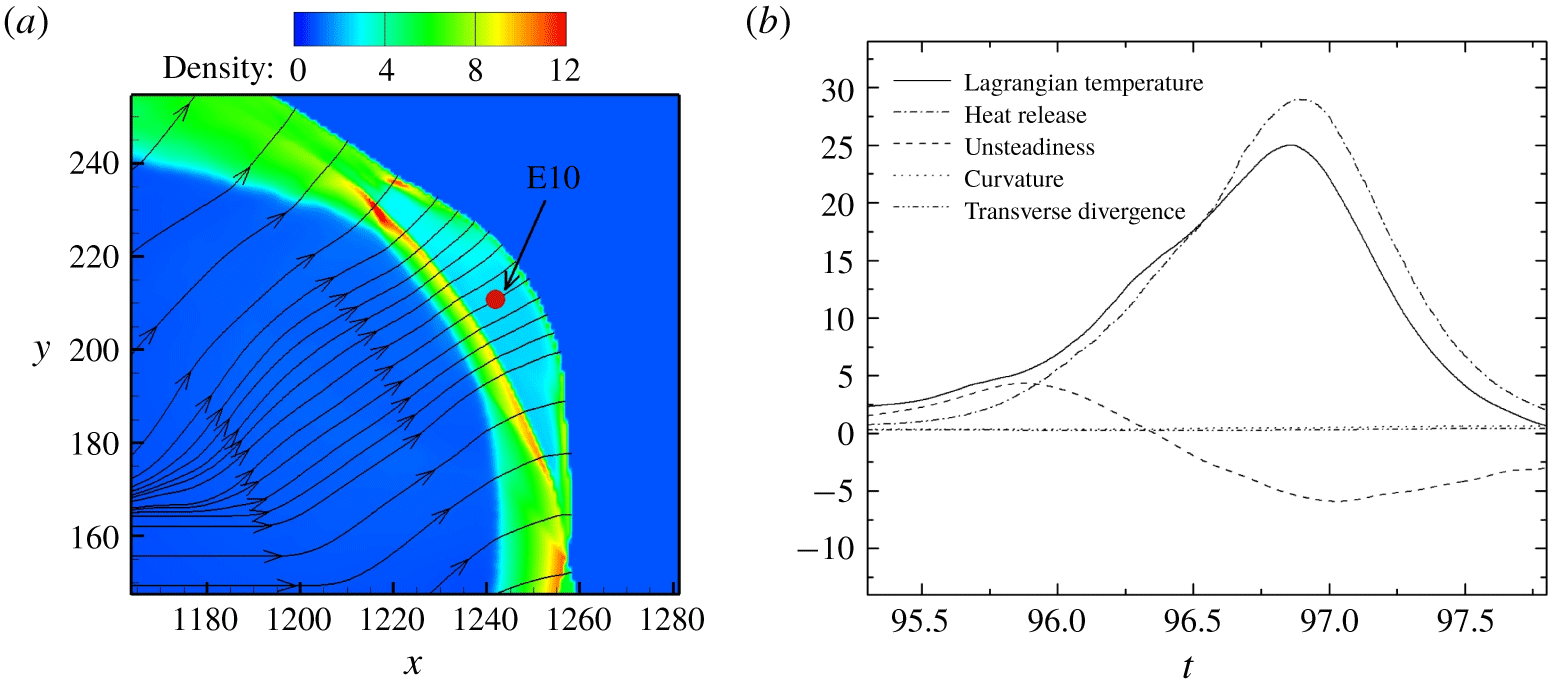
 $t=148$ (figure 15a). The decompositions of the Lagrangian temperature derivative for S13 and S15 are plotted in figure 16. As discussed in Arienti & Shepherd (Reference Arienti and Shepherd2005), the unsteadiness term is the only possible source to quench the reaction for a detonation with a convex-upstream wave front. In figure 16(a), right after the leading shock and the corner disturbance pass the particle S13, the relatively significant negative unsteadiness term results in a small negative Lagrangian temperature derivative and the corresponding ignition delay. Nevertheless, the heat release term dominates and forces the Lagrangian temperature derivative to remain positive subsequently. The curvature, transverse divergence and unsteadiness terms are relatively small in general. At later time (
 $t>53$ in the inset of figure 16a), the unsteadiness term is observed to be the dominant factor of temperature decrease for particle S13. For particle S15 (figure 16b), the amplitude of the unsteadiness term leads to a negative Lagrangian temperature and prevents the particle from auto-ignition.
In both cases of  $w=100$ and
 $w=110$, it is observed that the shock speed along the plane of symmetry decays abruptly after the arrival of corner disturbance. In the decoupling region (
 $x>1100$ for
 $w=100$ in figure 14(a);
 $x=1100{-}1400$ for
 $w=110$ in figure 15a), the slope of the shock trajectory changes slightly, indicating a slow decay in the shock speed. In such cases, the unsteadiness term is found to be the dominant source of quenching the reaction of particles. The weakened shock and the negative temperature gradient prohibit the particles from auto-ignition and re-initiation of detonation along the plane of symmetry.
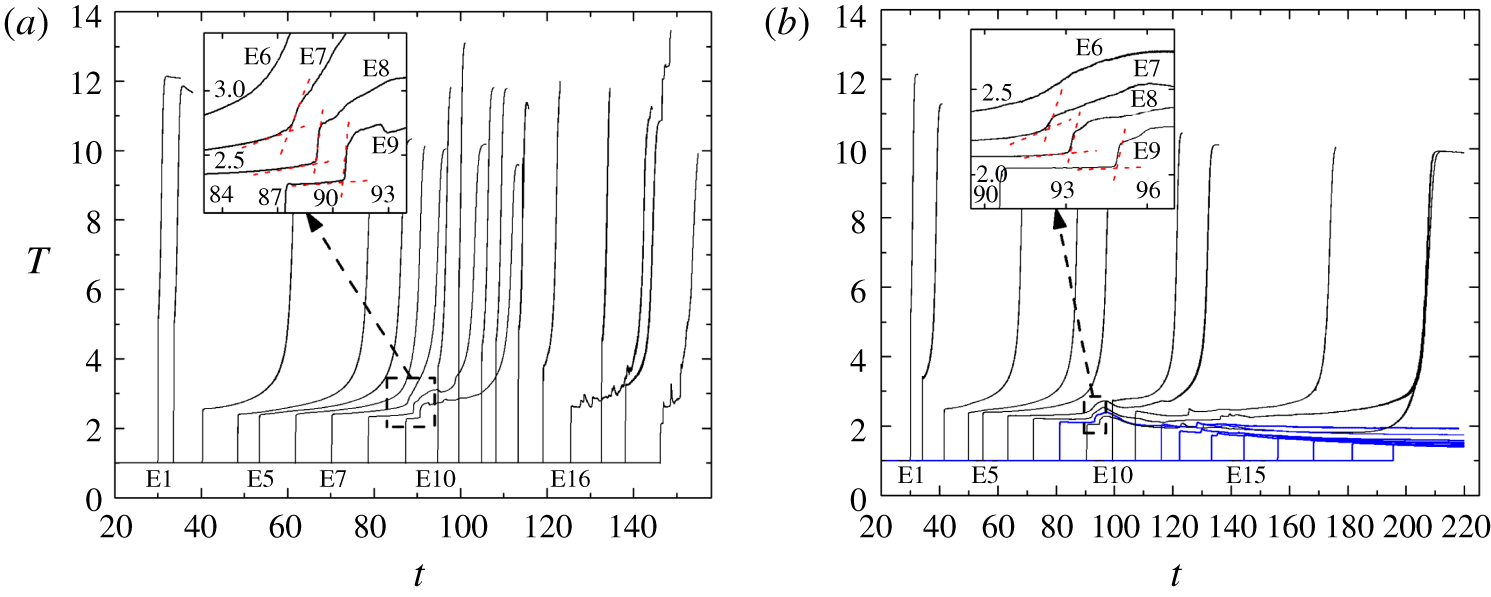
In figure 7, the re-initiation is observed to start from the upper right region of the diffracted shock. The behaviours of the particles that are close to the  $\unicode[STIX]{x1D702}$ line defined in figures 7 and 8 are plotted in figure 17. These particles are labelled E1,
 $\text{E}2,\ldots ,\text{E}19$ in figure 7. In the case with
 $w=110$, the ignition delay time from E1 to E6 increases, which is expected, as the diffracted shock speed decelerates. As observed at
 $t=87$ in figure 17(a), the temperature profile for E7 is no longer a smooth curve. Similar abrupt changes can be observed in the temperature profiles for E8 at
 $t=89$ and E9 at
 $t=91$. This abrupt change in temperature suggests that a significant compression wave might exist and be responsible for facilitating the ignition of these particles. Abrupt changes in temperature also appear for E7–E9 in the case with
 $w=100$ (figure 17b).
Temperature traces of particles along the  $\unicode[STIX]{x1D702}$ direction in figures 7 and 9 for planar detonation diffraction: (a)
 $w=110$ and (b)
 $w=100$. For clear illustration, lines are omitted once the particles are mostly reacted, and blue lines represent the particles that are still non-reacted until the end of the simulation.

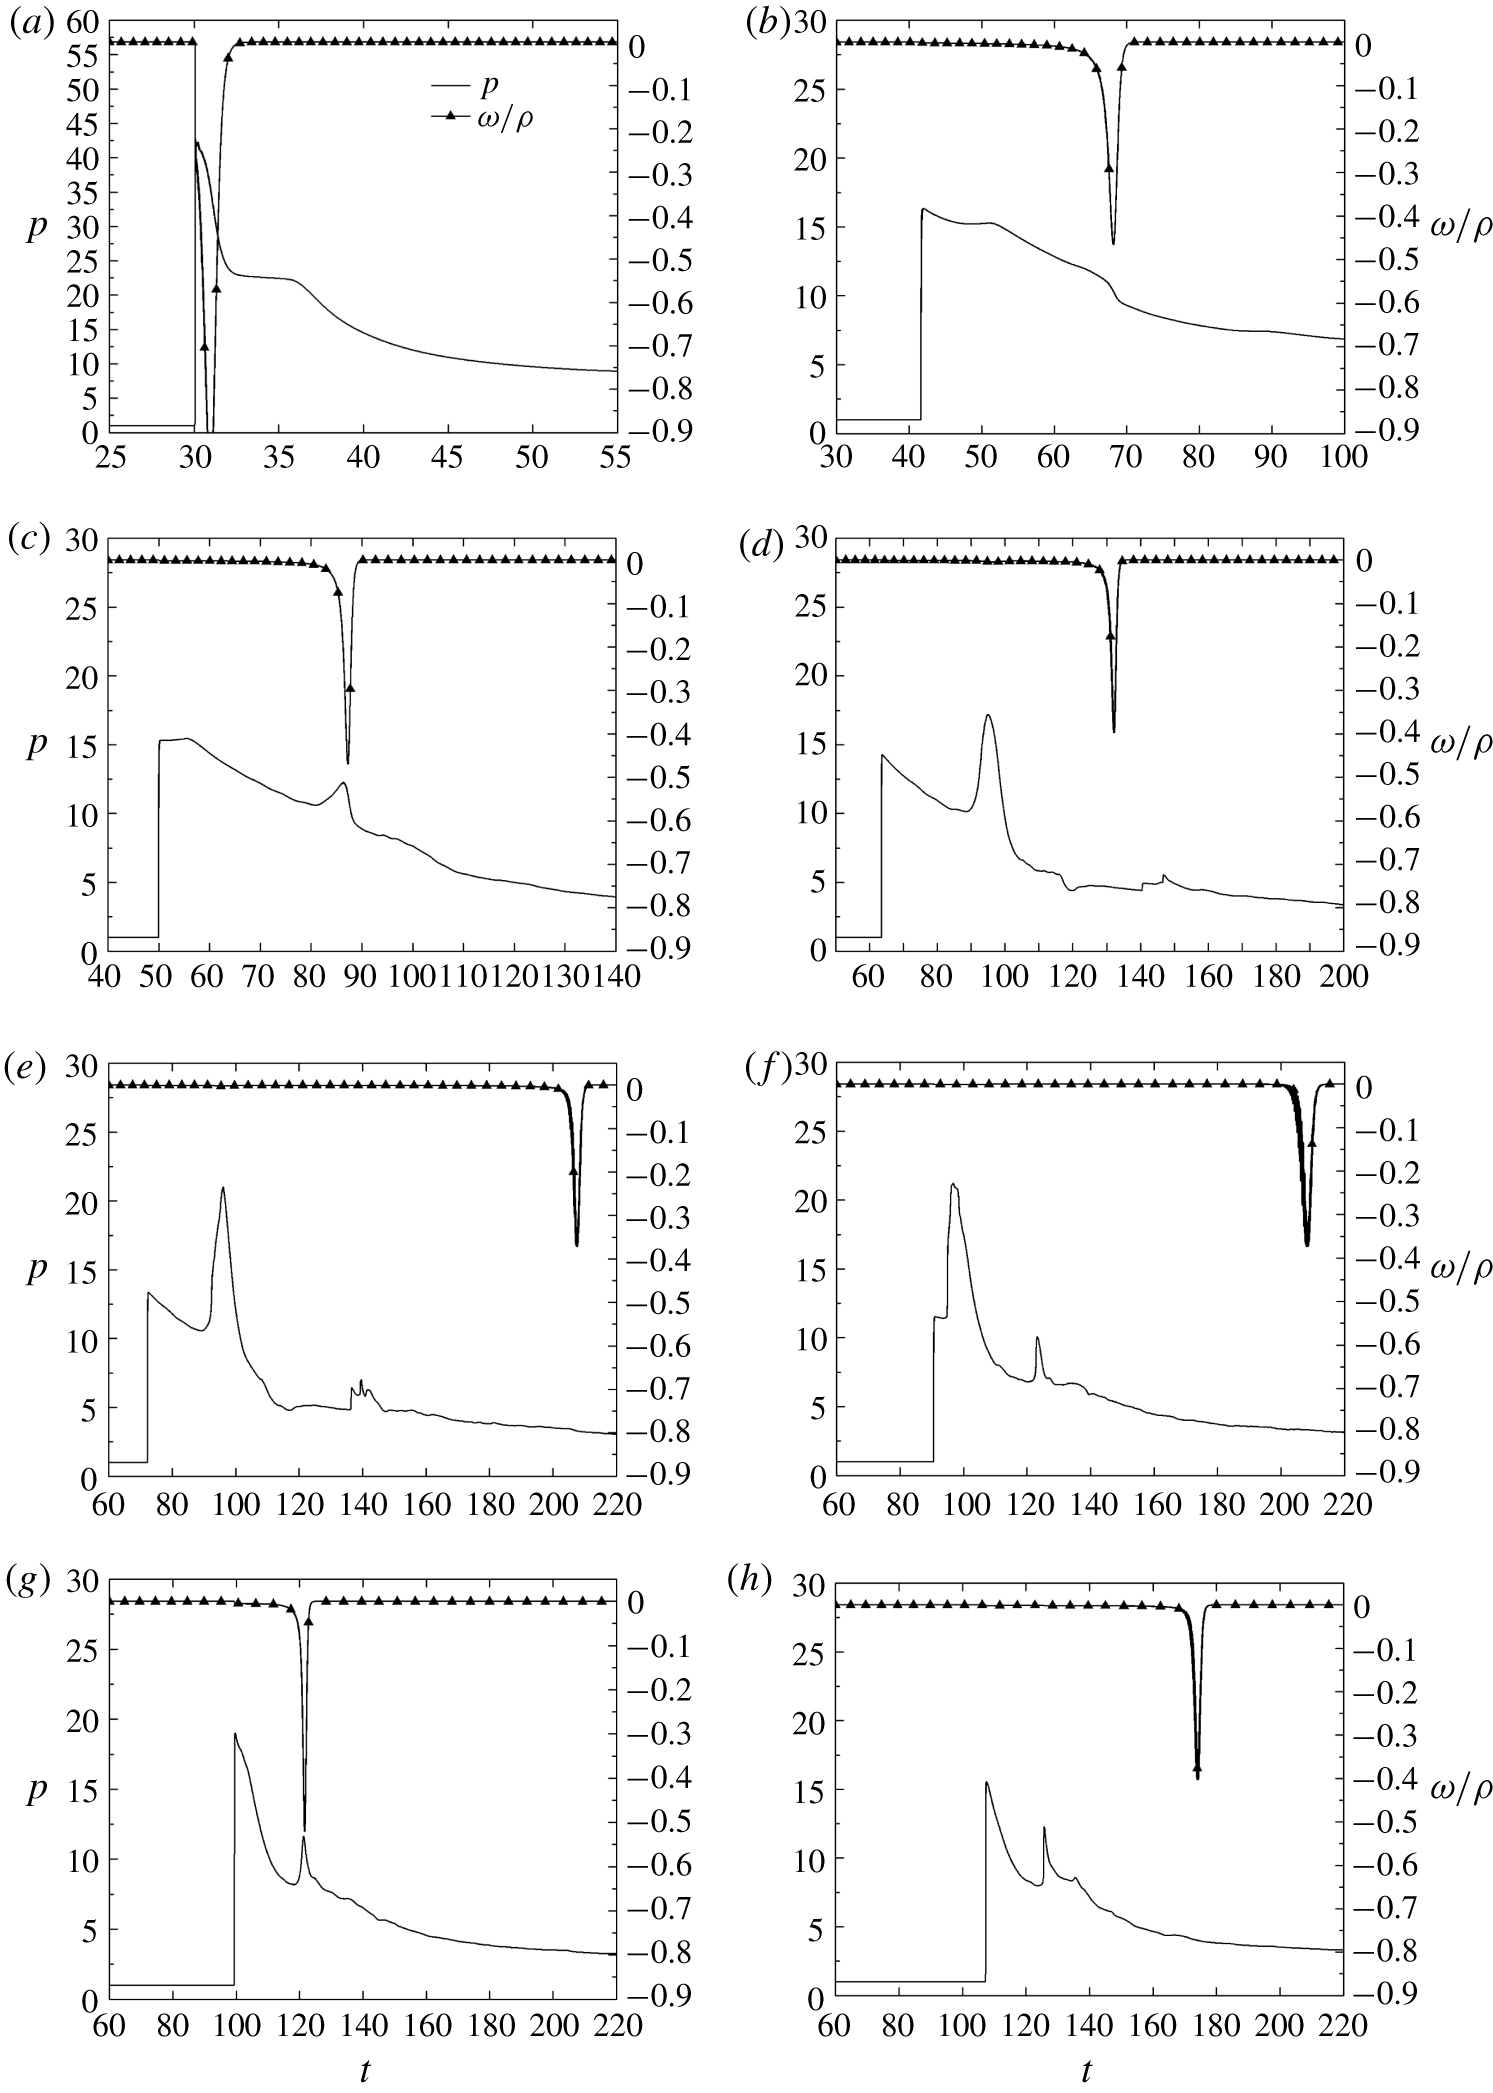
Pressure and reaction rate histories of particles along the  $\unicode[STIX]{x1D702}$ direction in figure 9 for the planar case
 $w=100$: (a) E1, (b) E3, (c) E4, (d) E6, (e) E7, (f) E9, (g) E10 and (h) E11.

To further examine the influence of the compression wave on the particles, the pressure and reaction histories of selected particles close to the  $\unicode[STIX]{x1D702}$ direction in the planar case with
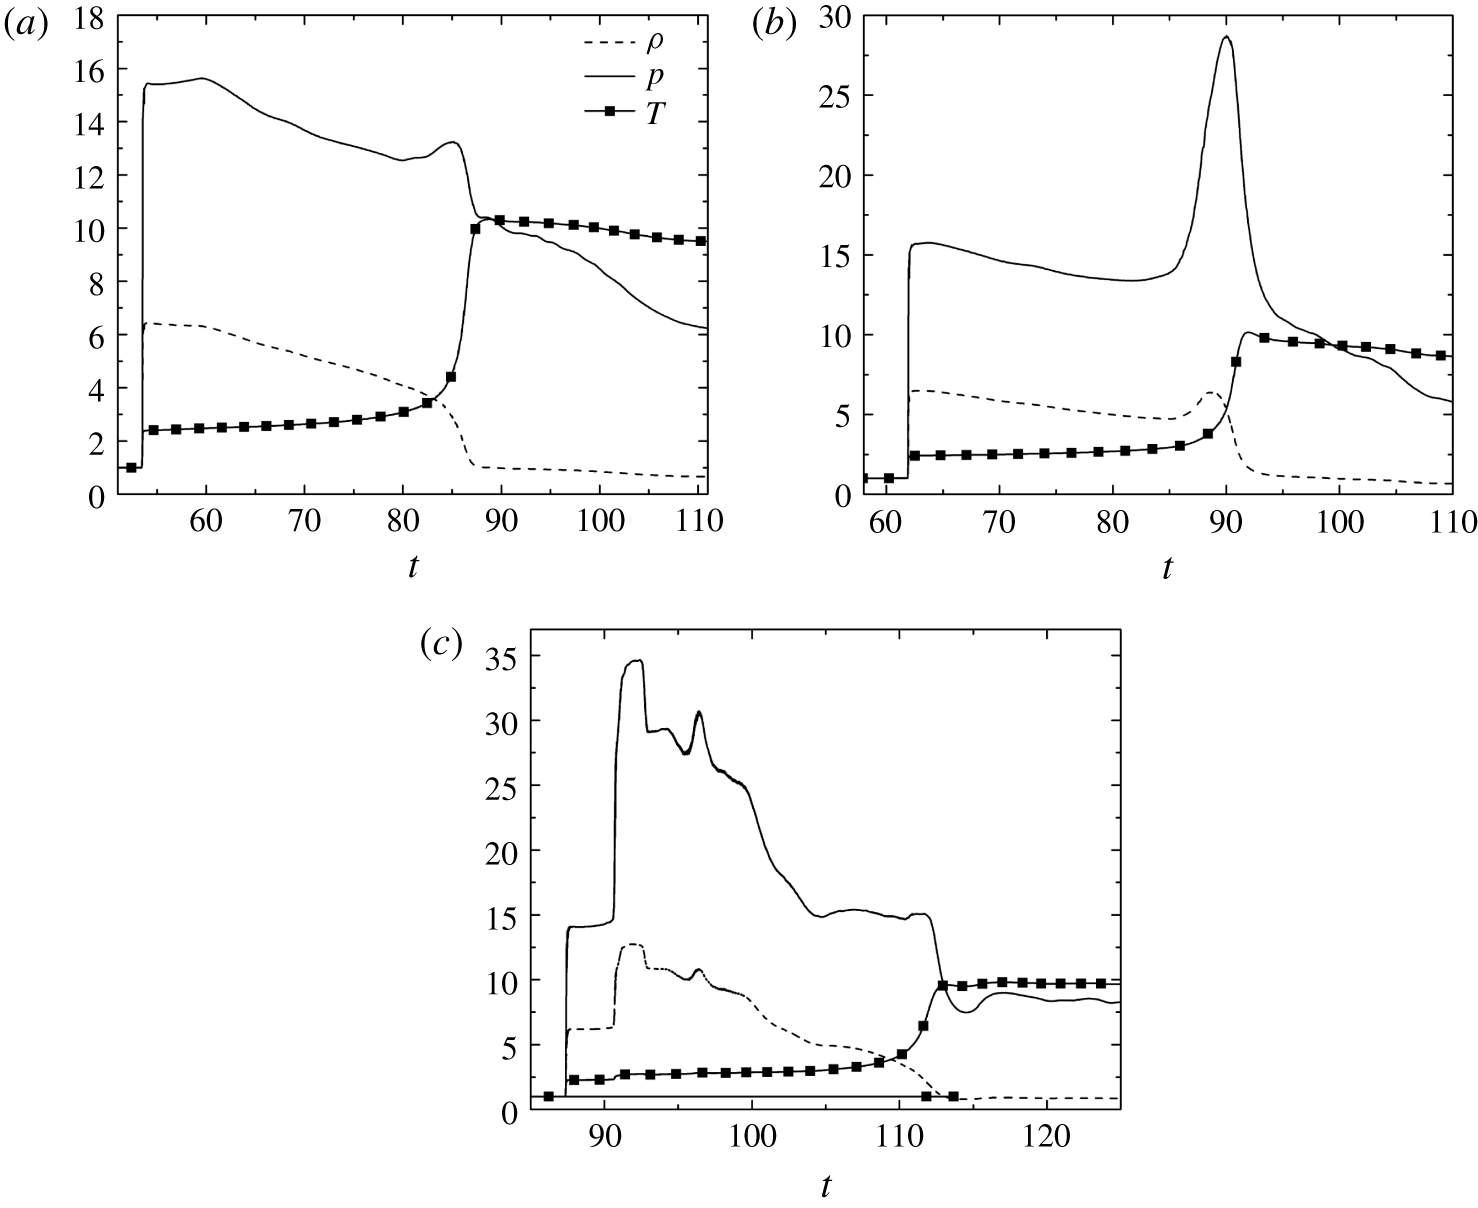
 $w=100$ are plotted in figure 18. Particle E1, which is initially located on the plane of symmetry before the intersection of the disturbance line, has a pressure rise closely coupled with the intensive reaction. As the shock front weakens, the ignition of E3 is delayed by approximately 25 units of time. The peak amplitude of the reaction rate is significantly smaller than that of E1. In contrast with the gradual decrease of pressure during the reaction history for E3, the reaction history for E4 shows an increment of pressure. This compression wave is strengthened and propagates downstream, as indicated by the amplification of the local pressure peak for E6. The reaction for E6 occurs after this compression wave passes with a time delay of approximately 35, and the pressure remains almost constant during the reaction. As the shock front moves further downstream, from E7 to E10, the time delay between the particle encounter with the shock front and the following compression wave shrinks. Finally, this compression wave merges with the leading shock. The pressure of E10 behind this strengthened leading shock is approximately 18.8, higher than 13.3 of E7 and 11.4 of E9. The heat release of E10 occurs with a time delay of approximately 22 behind the strengthened shock. However, the ignition delay continues to increase as observed in E11, which leads to a total failure of re-initiation. In short, the entire system experiences a decoupling process from E1 to E9. Meanwhile, a compression wave is generated and chases the leading shock from E4 to E10. Finally, the strengthened shock accelerates the reaction, but it is still too weak to stop decoupling.
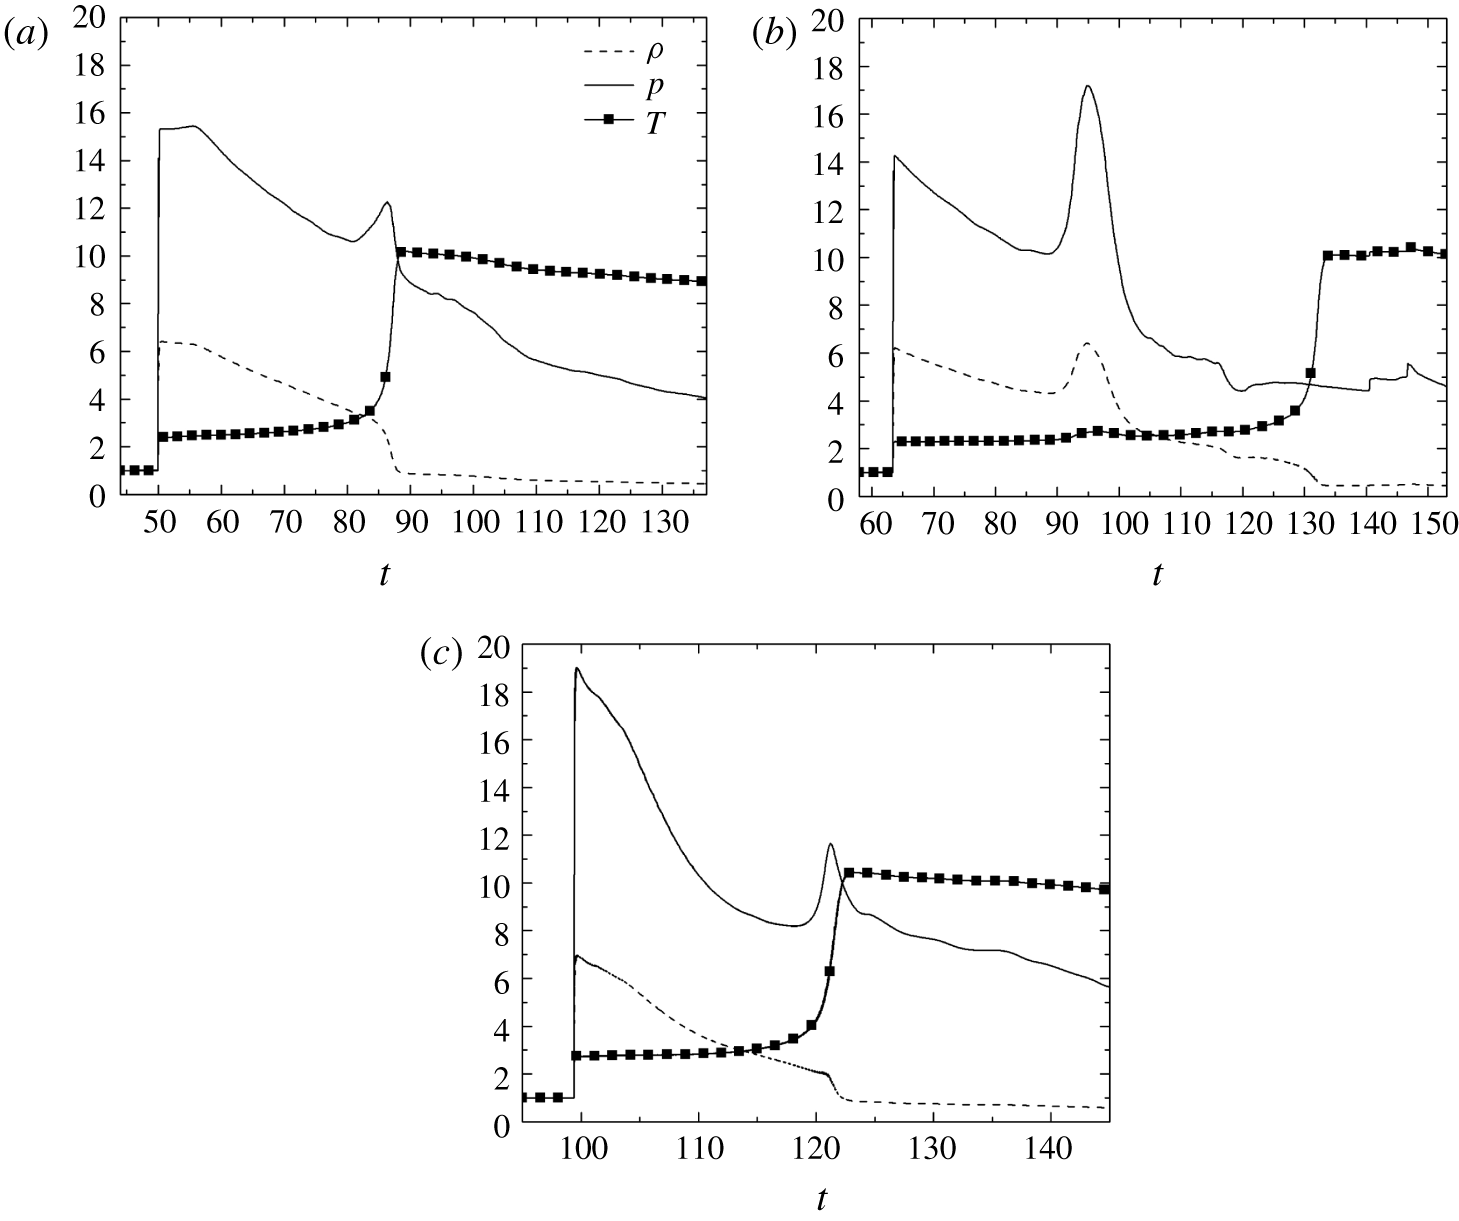
To further clarify the mechanism that creates the above-mentioned compression wave, figure 19(a) displays the thermal histories for E4. It is observed that, during the pressure and temperature increasing period at  $t\approx 85$, the density decreases only moderately, indicating that this compression wave is a reaction-induced wave. The heat release of E4 and its surrounding gas contributes to establishing this compression wave. The peak pressure of this compression wave in figure 19(a) is further amplified by the heat release from other particles around and behind E4, as shown in figure 19(b). Both the pressure and density of E6 increase at
 $t\approx 95$ when the compression wave overtakes the particle. Another compression wave is induced by a more intense reaction at
 $t\approx 119$ for E10 in figure 19(c) (larger
 $\unicode[STIX]{x1D714}$/
 $\unicode[STIX]{x1D70C}$ than those of particles E6, E7 and E9 in figure 18). Similar to the E4 case, during the pressure and temperature increasing period, the density decreases only moderately during the reaction (figure 19c). This secondary compression wave is detected by upstream particles E9 at
 $t\approx 123$, E7 at
 $t\approx 136$, and downstream particle S11 at
 $t\approx 125$ in figure 18.
Density, pressure and temperature histories along the particle path for (a) E4, (b) E6 and (c) E10 for the planar case with  $w=100$.

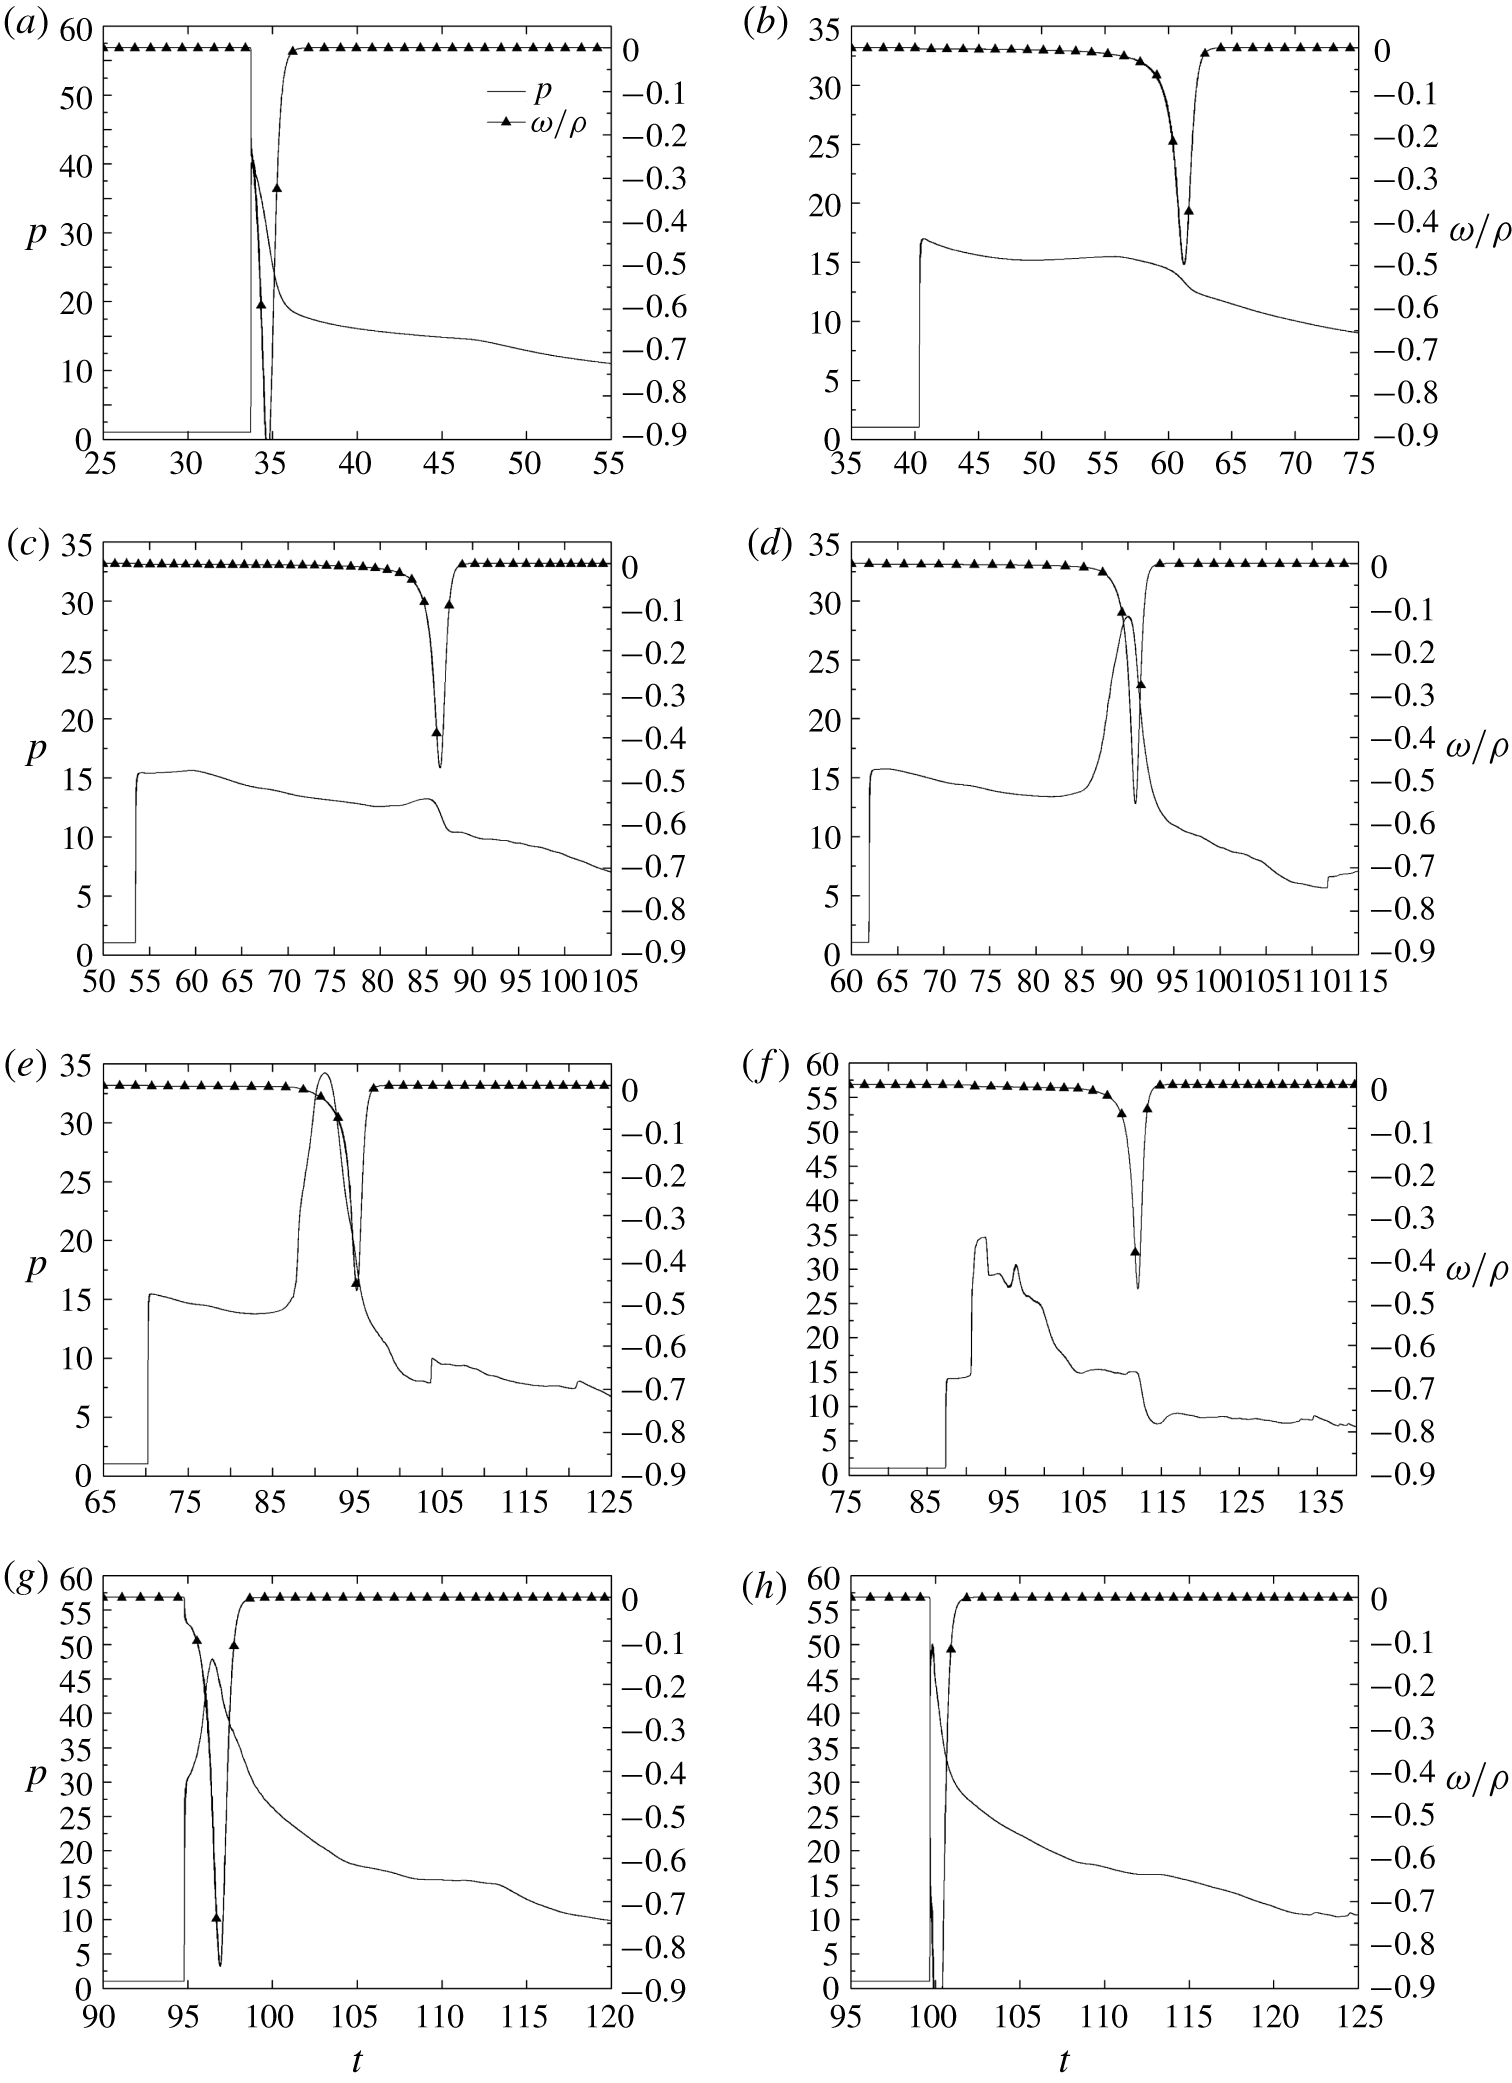
We now consider the planar case with  $w=110$ (figure 20). The plot for E1 is very similar to that in the case with
 $w=100$ and thus is not shown here. E2 is initially located close to the disturbance line; and
 $P_{vN}$ is only slightly decreased. The ignition delay of E3 is approximately 21, which is shorter than that of E3 (
 ${\sim}$25) in the failure case (
 $w=100$). A compression wave is formed at
 $t\approx 85$ for E5 (figures 20c and 21a). Soon after, E6 meets this compression wave at
 $t\approx 90$, and the intensive heat release amplifies the compression wave (figure 21b). The compression wave propagates towards the shock and is continuously intensified by the simultaneous heat release of the particles behind it (see E7–E9). The heat release for E9 starts with a time delay of approximately 21 after the compression wave passes (figures 20f and 21c), which has a rather small contribution to the amplification of the compression wave. The compression wave merges with the leading shock for E10. Eventually, the detonation wave that passes through E11 is overdriven, with a
 $P_{vN}$ of 50. The particle traces in the near field behind the re-initiation bubble are found to be perpendicular to the curved shock. At the time when the E10 particle experiences a complete reaction, the distance between the curved shock and this particle is approximately 7.2 (figure 22a). These conditions (i.e. the distance between the curved shock and the particle E10 is short such that the particle traces in the near field behind the re-initiation bubble are perpendicular to the curved shock) make the decomposition of E10 reliable. In figure 22, the unsteadiness term is positive before
 $t=96.4$. This corresponds to what is observed in figure 20(g), where the E10 particle is pressurised by the coalescence of the curved shock and the chasing compression wave. In contrast with the negative unsteadiness term for a particle passing through a decelerating detonation wave, as illustrated in figure 16, this positive unsteadiness term, together with the heat release term, amplifies the temperature increase rate of E10.
Pressure and reaction rate histories of particles along the  $\unicode[STIX]{x1D702}$ direction in figure 7 for the planar case with
 $w=110$: (a) E2, (b) E3, (c) E5, (d) E6, (e) E7, (f) E9, (g) E10 and (h) E11.

Density, pressure and temperature histories along the particle path for (a) E5, (b) E6 and (c) E9 for the planar case with  $w=110$.

(a) Density contour together with particle paths and the location of E10 at  $t=98.794$. (b) Terms in the Lagrangian temperature derivative for particle E10 on the
 $\unicode[STIX]{x1D702}$ line in the planar case with
 $w=110$.

Notably, for particles on the wall, the results from both Arienti & Shepherd (Reference Arienti and Shepherd2005) and this study show that decoupling persists until the impingement of external transverse waves. Therefore, the results will not be repeated here.
3.3 Effect of the reflected rarefaction wave
The comparison of the two cases described in the previous section indicates that the diffraction results may depend on interactions among the flame bulge, the shock and the reflected rarefaction wave. A further investigation is performed by applying equation (2.10) for numerical schlieren with  $\unicode[STIX]{x1D707}=4000$ and
 $\unicode[STIX]{x1D701}=0.05$. This results in areas near the strong waves appearing dark in the image, but the weak waves inside the burnt mixture are visible.
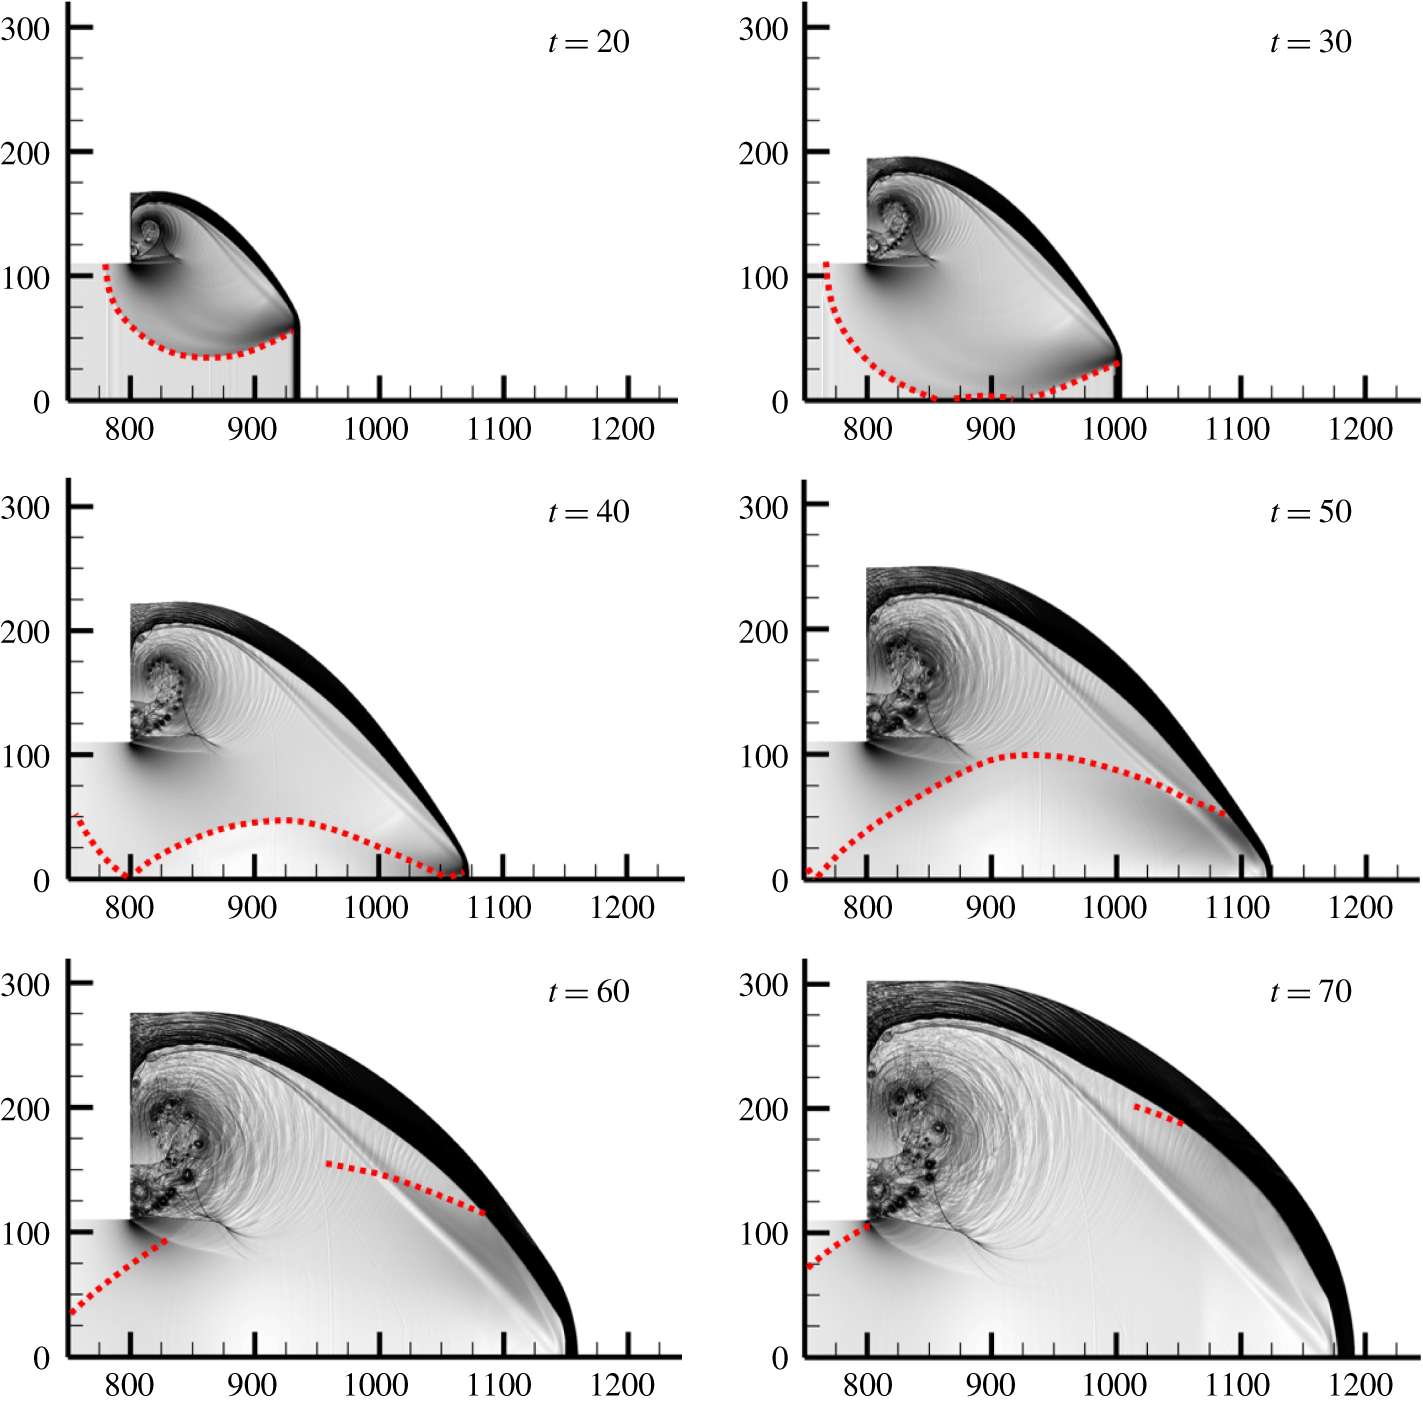
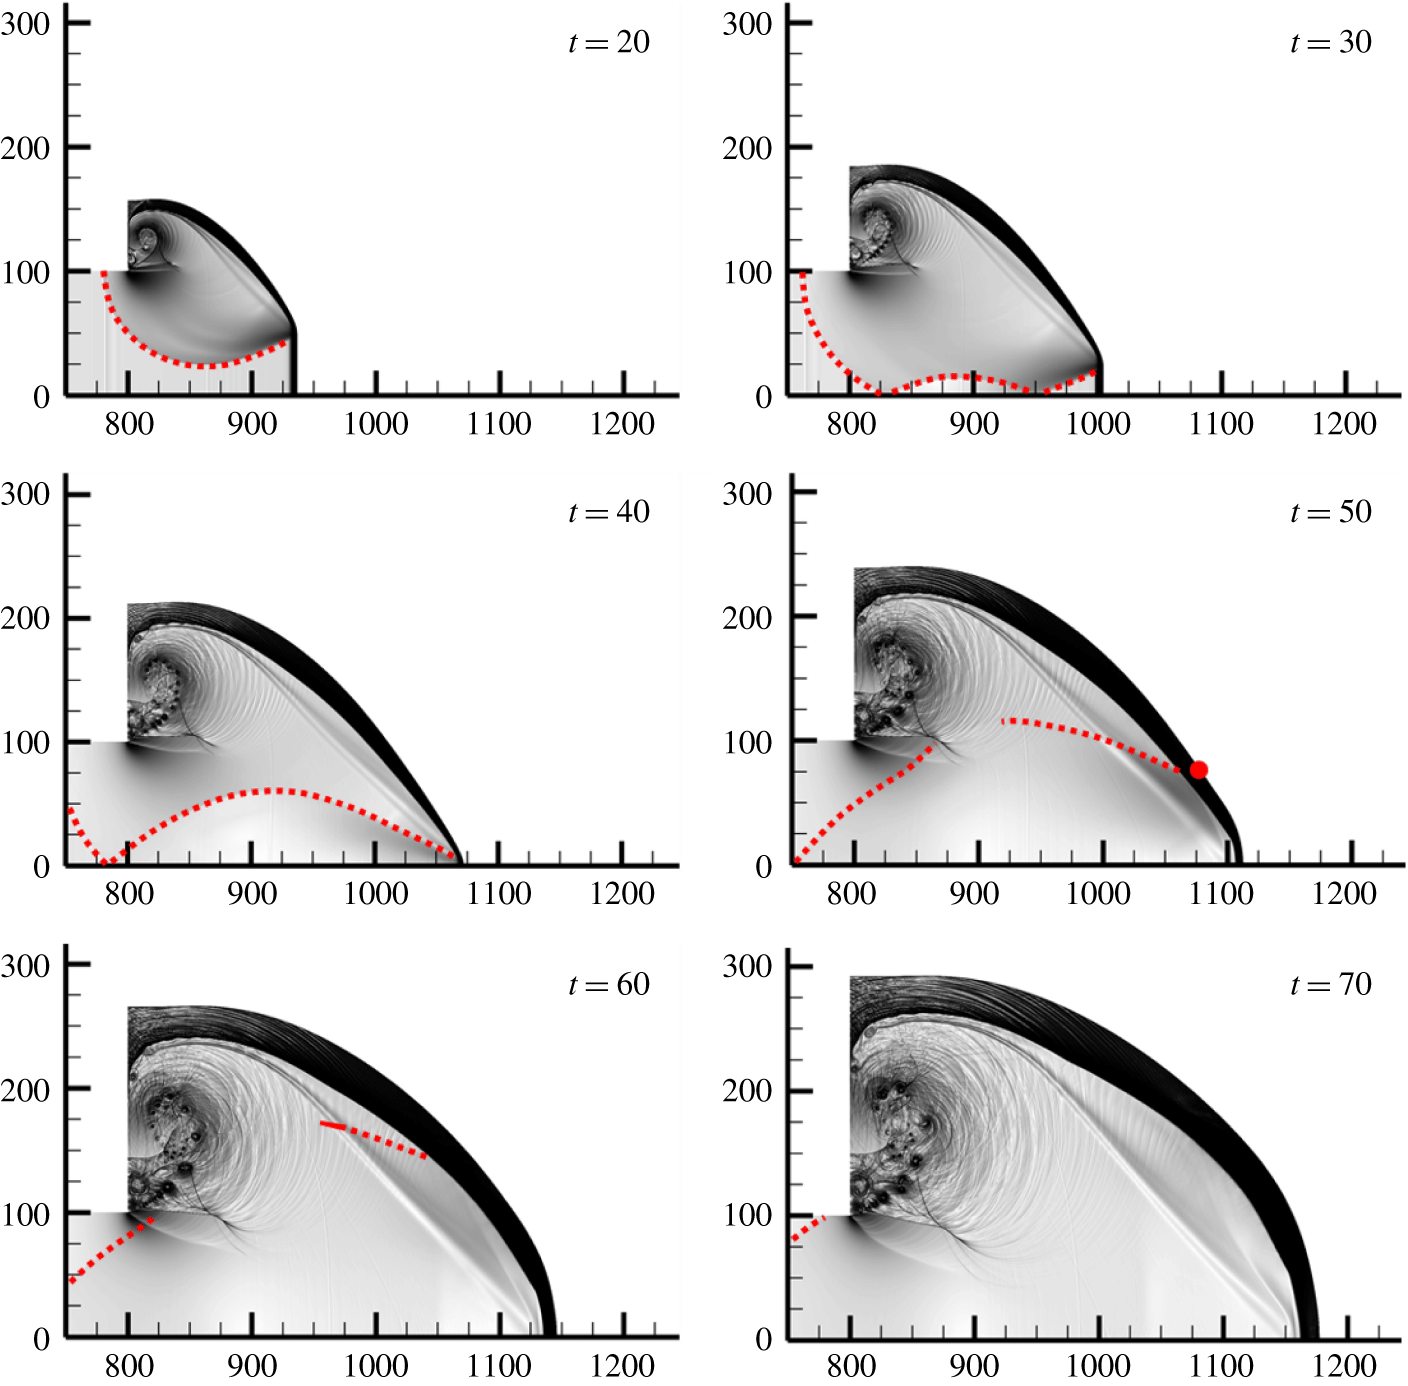
Numerical schlieren images that accentuate the weak flow features for  $w=110$ and
 $w=100$ are shown in figures 23 and 24, respectively. For easy interpretation, the rarefaction waves and reflected wave fronts that can be identified in the figures are indicated with red dotted lines. At
 $t=20$, both cases show an identical wave pattern: a rarefaction wave propagates downwards from the top unconfined region, and the regions under the influence of the wave are exactly the same in both cases. As the rarefaction front reaches the plane of symmetry, a reflected rarefaction wave is induced (
 $t=30$). Owing to the narrower channel width, the reflected wave above the plane of symmetry in the
 $w=100$ case propagates to a higher position than that in the
 $w=110$ case. For both cases, the reflected wave front is characterised by a progressive decrease in the pressure amplitude (figure 11). The reflected wave continues to move upwards (
 $t=40$) and later interacts with the shocked reactant and with the complex vortices close to the corner (
 $t=50{-}70$).
Enhanced numerical schlieren images for  $w=110$. The red dotted lines indicate the head of the rarefaction wave and its reflections.

Enhanced numerical schlieren images for  $w=100$. The red dotted lines indicate the head of the rarefaction wave and its reflections. The red circle at
 $t=50$ indicates the initial location of particle E4.

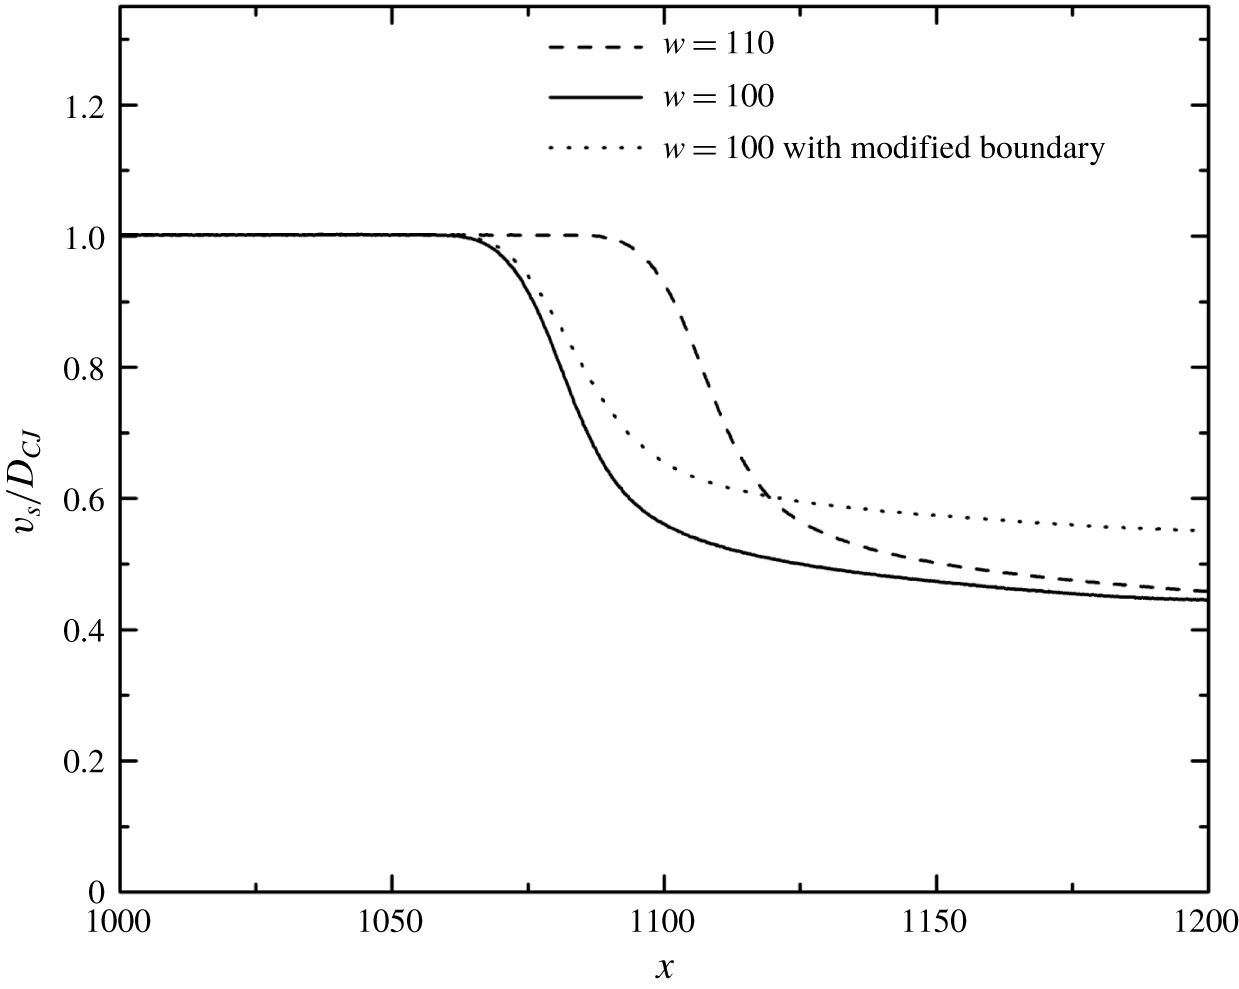
For both cases, the diffracted wave fronts are similar until the reflected rarefaction wave interacts with the shock. The re-establishment of the detonation wave seems to be greatly influenced by this reflected wave, since the reflected wave could alter the strength of the leading shock and thus the temperature gradient behind it. For example, in the planar case with  $w=110$, as the leading shock overtakes particle S13, the reflected rarefaction wave just starts to merge with the leading shock (figure 25). Contributed by both the initial expansion and the reflection, the shock decelerates sharply from 93 %
 $D_{CJ}$ at
 $x=1100$ to 50 %
 $D_{CJ}$ at
 $x=1150$ (figure 26). Consequently, particle S13 exhibits a large heat release term initially and is then dominated by the unsteadiness term, while S15 is dominated by the unsteadiness term throughout the interaction process (figure 16).
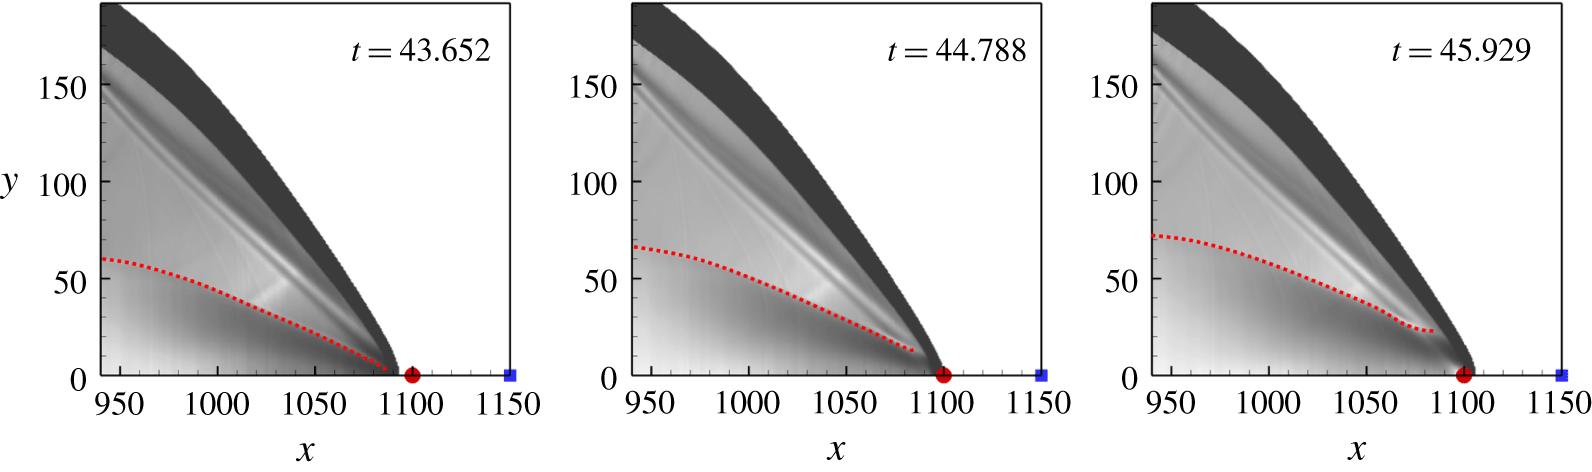
One way to examine this hypothesis is to eliminate the reflection of the rarefaction wave for the subcritical case, i.e.  $w=100$. In this case, the boundary condition for the lower side of the computational domain is implemented by the zero-gradient condition (modified boundary case). The corresponding results are shown in figure 27. From
 $t=20$ to
 $t=40$, the rarefaction wave impinges on the lower boundary and is not reflected. The hot bubble forms again at
 $t=100$ at a location very close to that of the
 $w=110$ case. The shock deceleration along the plane of symmetry for this modified boundary case is found to be less significant compared to its unmodified counterpart (figure 26). This indicates that the reflection of the rarefaction wave further weakens the strength of the leading shock. For particle E4 along the re-initiation path in the
 $w=100$ case with the symmetry boundary condition, it encounters the leading shock at
 $t=50$ (figure 24). The local shock front near E4 has not been attenuated by the reflected rarefaction wave. When particle E4 completes reaction at
 $t\approx 90$, the reflected rarefaction wave has already merged with the leading shock. This makes particle E4 ideal to quantitatively measure the effect of the reflected rarefaction wave.
Numerical schlieren images when particle S13 is encountering the leading shock for case with  $w=110$. The red circles and the blue squares indicate the initial locations of S13 and S15, respectively. The red dotted lines indicate the head of the reflected rarefaction waves.

Shock velocities along the plane of symmetry.

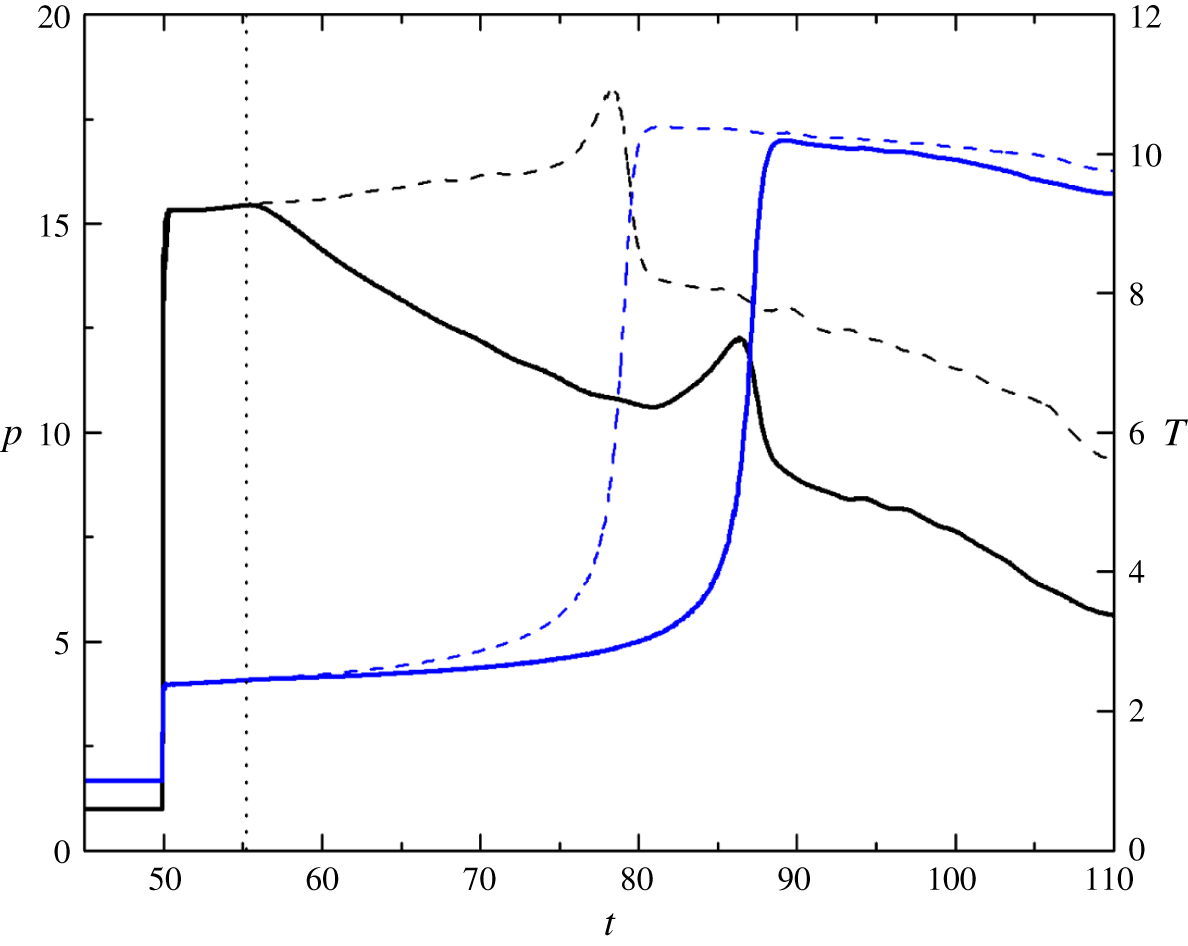
Figure 28 plots the temperature and pressure histories of E4 in the  $w=100$ cases with reflective and non-reflective (modified) boundary conditions. During
 $t=50{-}55.2$, the pressure histories of the two cases overlap with each other, suggesting that the reflected rarefaction wave has not reached the particle. From
 $t>55.2$, the pressure of E4 in the case with the reflective boundary condition decreases gradually due to the arrival of the reflected rarefaction wave. In the same time, the rate of temperature increase is slightly smaller than the modified (zero-gradient) case. Therefore, the ignition occurs at a later time for the original case (with the reflective boundary condition) compared to the modified case. The peak pressure during reaction also reduces for the original case, compared to the modified case. The mechanism of re-initiation near the critical channel width is as follows. The rarefaction wave first curves around the detonation wave front and attenuates the reaction rate behind it for both the
 $w=110$ and
 $w=100$ cases. Later, as described in § 3.2.1, a compression wave is formed and propagates towards the leading shock through the shocked reactant. Meanwhile, the rarefaction wave reflects from the plane of symmetry and affects the shocked reactant with a delayed reaction and a smaller pressure amplitude. Re-initiation therefore depends on the competition between the formation and amplification effect of the compression wave and the attenuation effect of the reflected rarefaction wave. For the
 $w=110$ case, the attenuation by the reflected rarefaction wave is weaker (due to the larger channel width) and is not sufficient to suppress the re-establishment of the detonation wave. The failure of re-initiation in the
 $w=100$ case is mainly caused by the stronger attenuation of shock strength and the subsequent compression wave, due to the rarefaction wave reflected from the plane of symmetry. Consequently, the re-initiation fails.
Enhanced numerical schlieren images for  $w=100$ with the zero-gradient condition applied on the lower boundary. The red dotted lines indicate the head of the rarefaction wave.

Pressure (black lines) and temperature (blue lines) histories of particle E4 for the case with  $w=100$. Solid lines represent results for reflective boundary condition; dashed lines represent results for zero-gradient boundary condition. The dotted line indicates the time that the particle is influenced by the reflected rarefaction wave in the case with reflective boundary condition.

3.4 The role of transverse waves in detonation diffraction
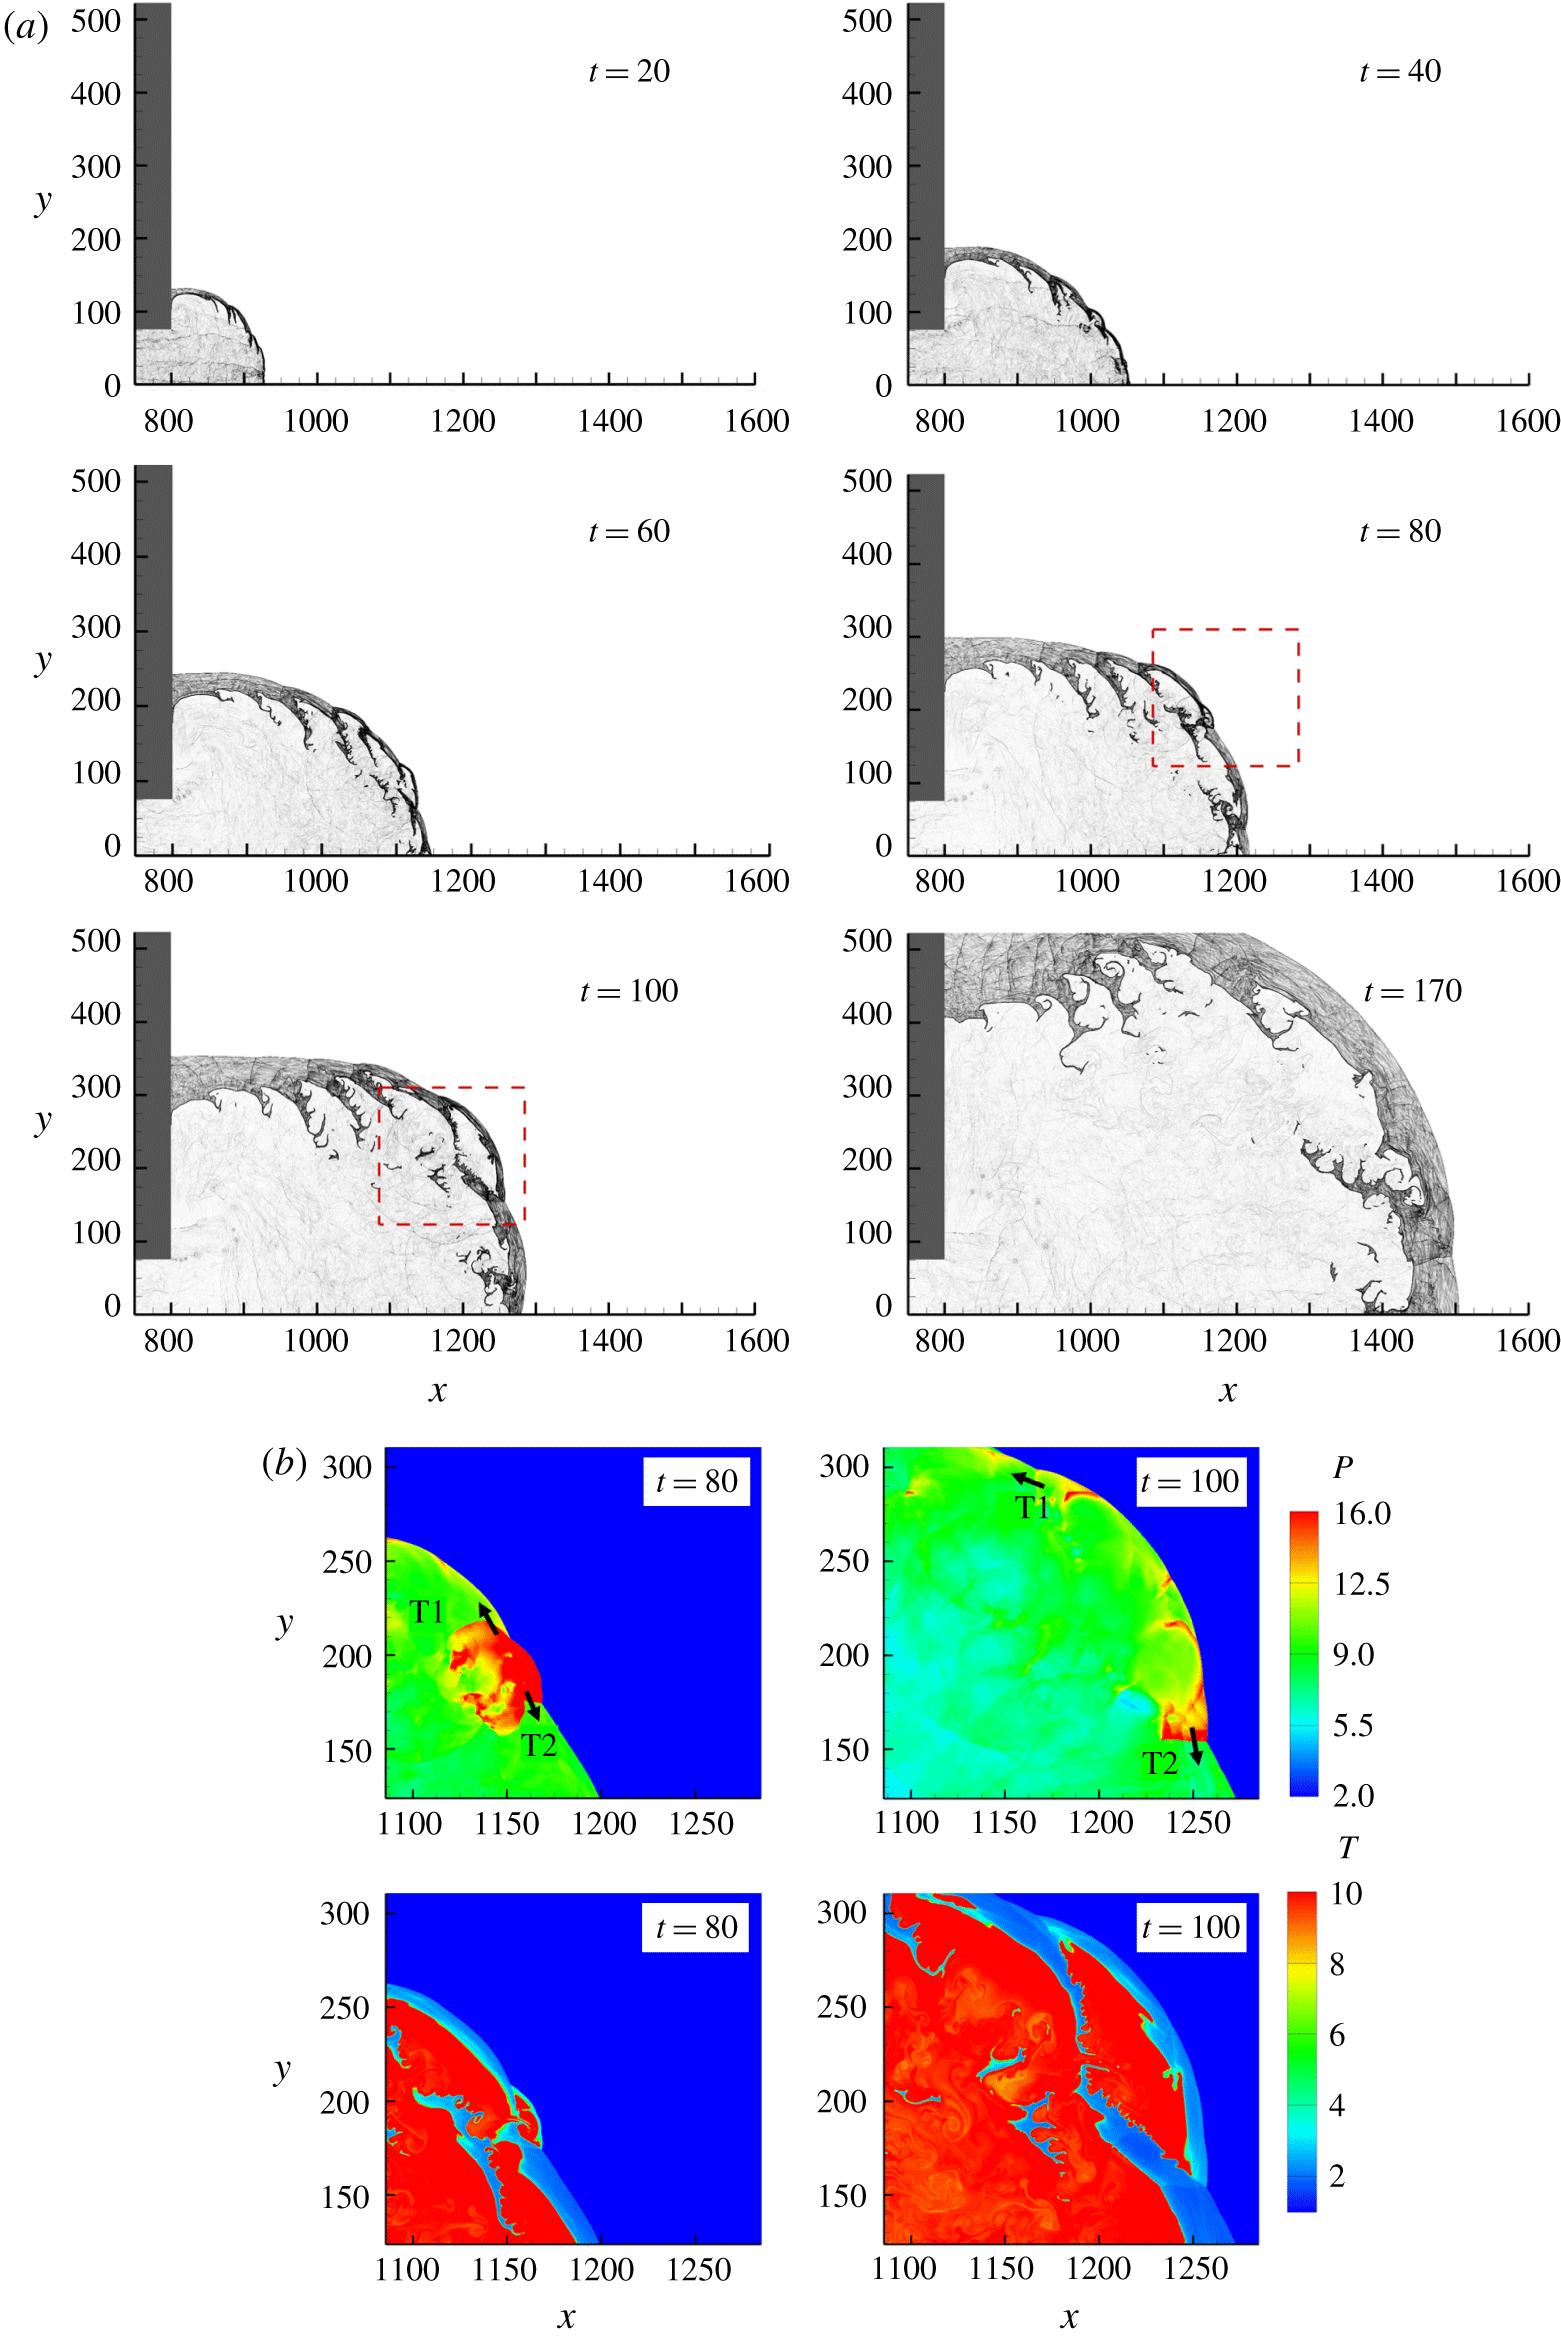
In this section, cases with transverse detonation waves inside the inlet channel are discussed. Figure 29(a) shows the diffraction process for  $w=75$ (
 $\unicode[STIX]{x1D707}=200$,
 $\unicode[STIX]{x1D701}=1$). Because of the transverse unsteadiness, the flow structure is much more complex than in the planar cases described above. At
 $t=20$, the flame front in the disturbed zone is no longer smooth; instead, multiple keystone structures are found due to the presence of transverse wave interaction (Gallier et al. Reference Gallier, Le Palud, Pintgen, Mével and Shepherd2017). According to the Skews’ construction, the corner disturbance reaches the plane of symmetry at
 $x=982$. However, in this case, the shock front near the plane of symmetry is still closely coupled with the flame at
 $x=1175$ (
 $t=60$). As the detonation wave propagates further, the distance between the shock front and the flame front increases, and, eventually, the two fronts are decoupled completely (
 $t=80$ to
 $t=170$). This is denoted as the subcritical case. Figure 29(b) shows the pressure and temperature contours at the enlarged area for
 $t=80$ and
 $t=100$. As the detonative Mach stems expand into the stationary flow field, no collision of transverse waves T1 and T2 with other transverse waves is observed; thus, no high pressure or temperature is presented, which is crucial for the induction of local overdriven explosions.
(a) Numerical schlieren images for the cellular case with  $w=75$ and (b) pressure and temperature contours at the enlarged area for
 $t=80$ and
 $t=100$.

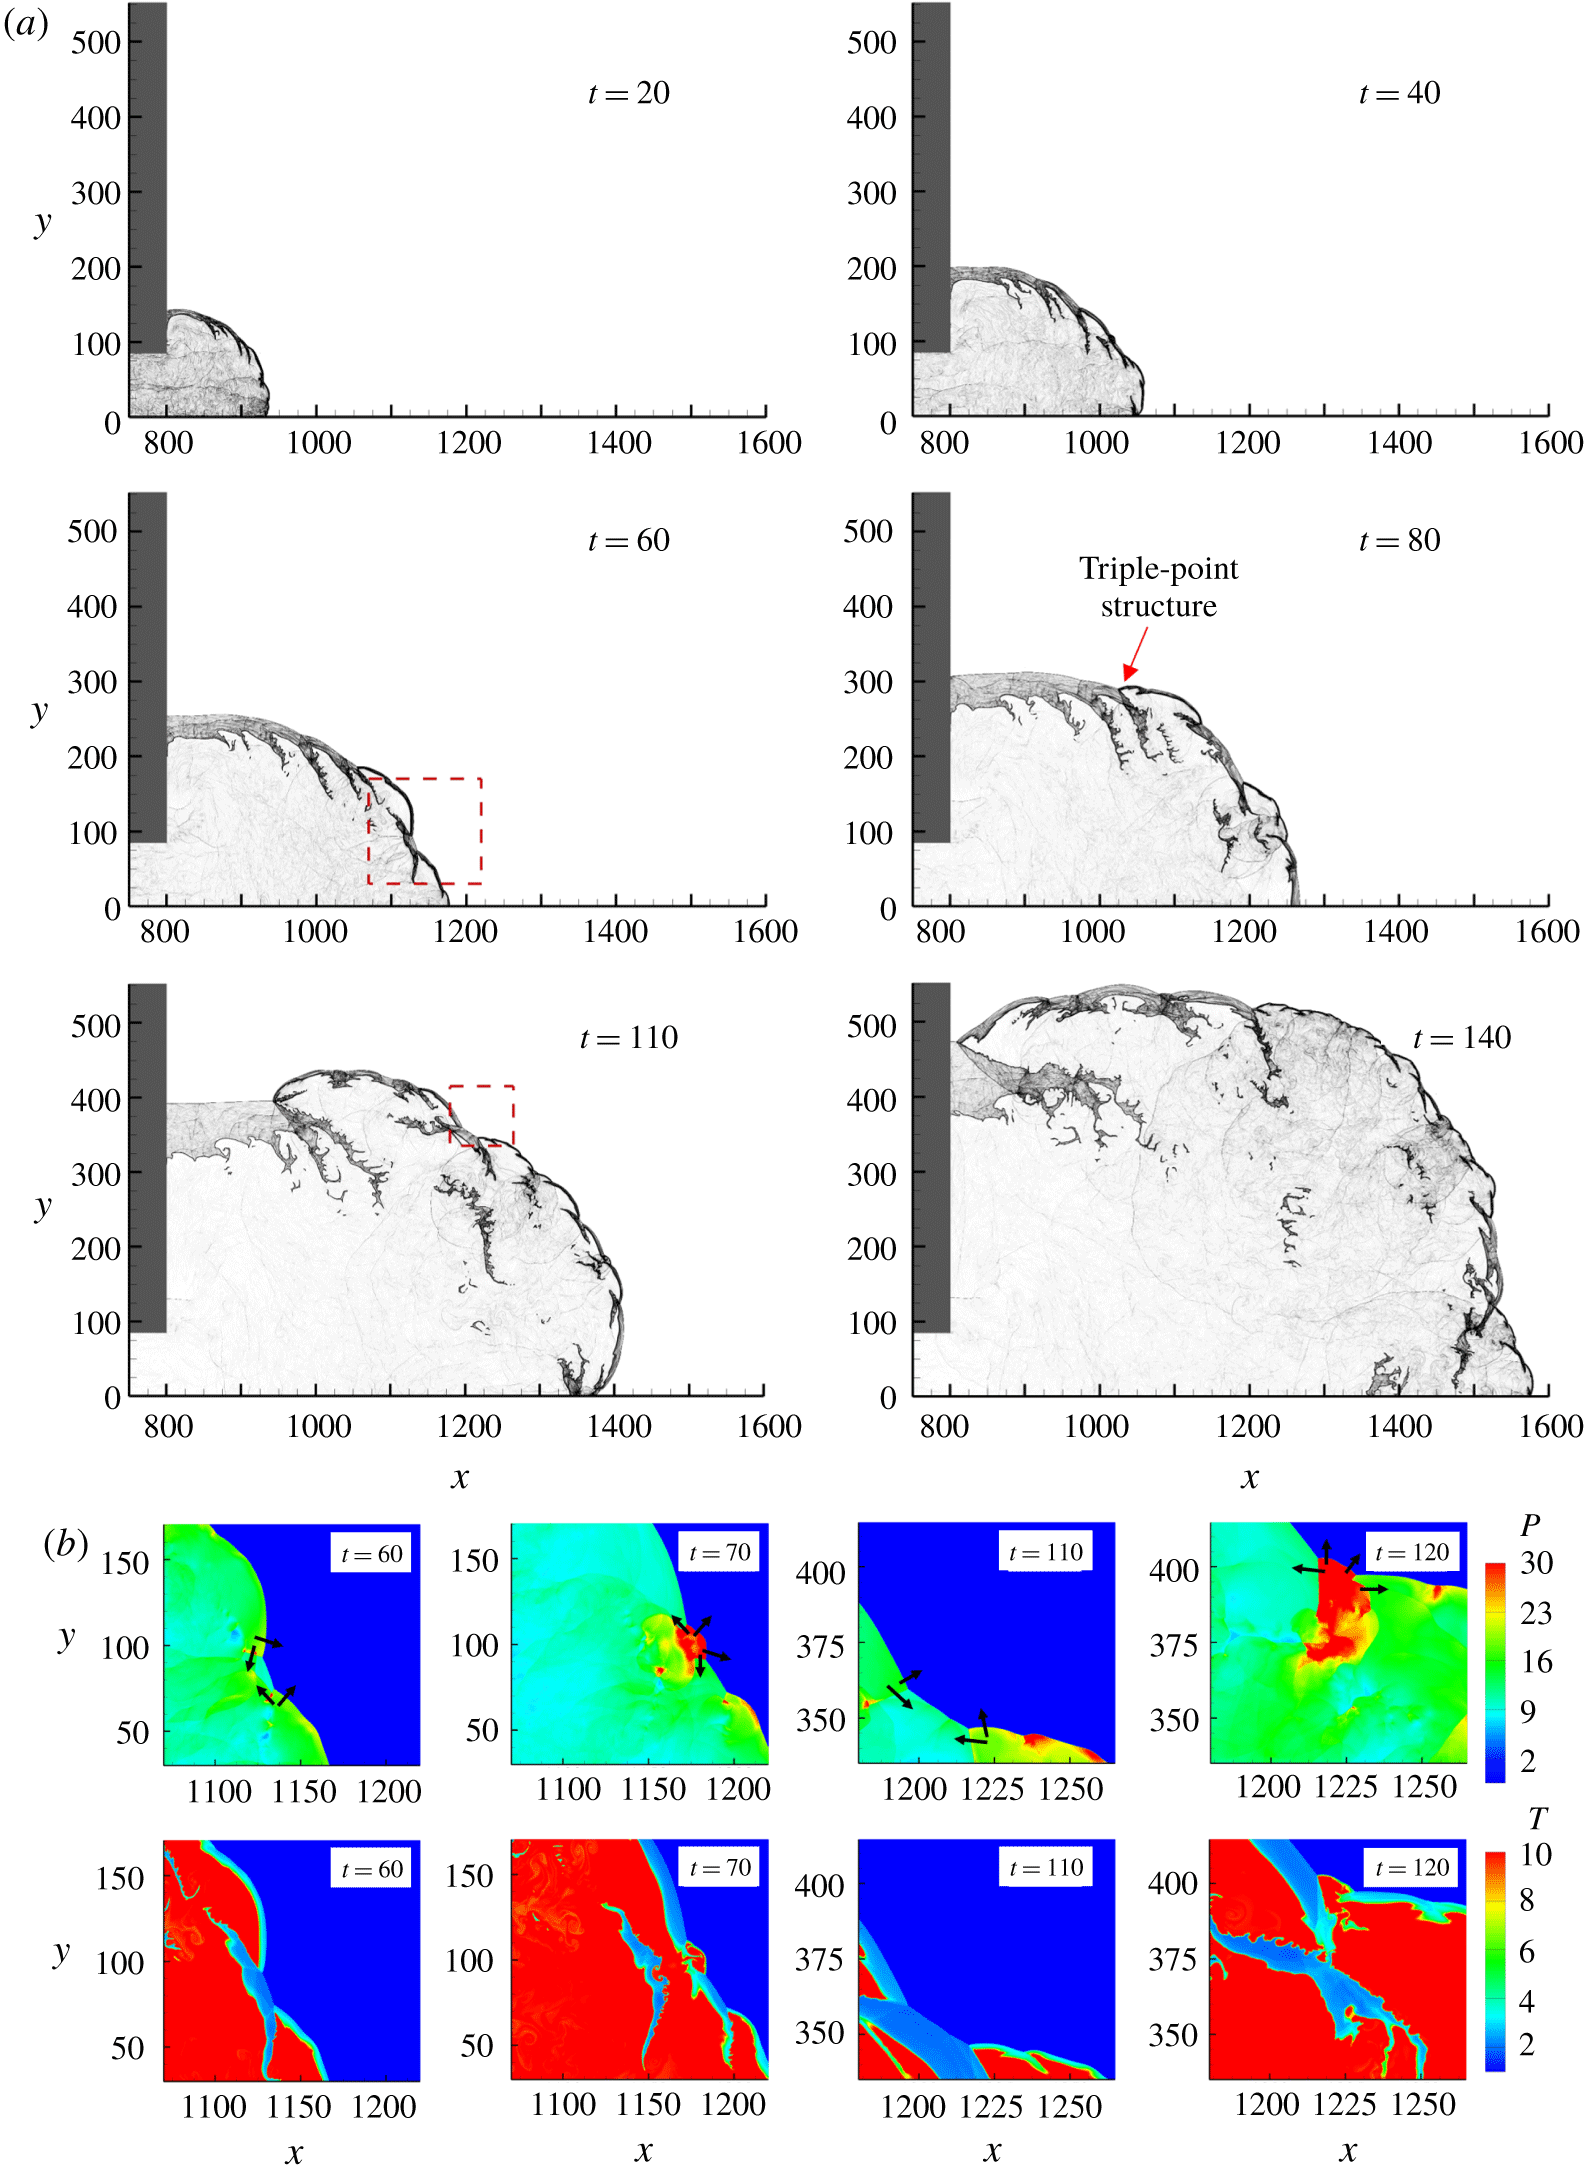
(a) Numerical schlieren images for the cellular case with  $w=85$ and (b) pressure and temperature contours at the enlarged areas between
 $t=60$ and
 $t=70$ and between
 $t=110$ and
 $t=120$.

For the  $w=85$ case, the Skews’ construction predicts that the disturbance will reach the plane of symmetry at
 $x=1006$. Similar to the subcritical case, the shock–flame structure remains coupled when the shock front just passes this point. Compared with the supercritical case for planar detonation diffraction (figure 7, at
 $t=80$), no complete decoupling is observed during the diffraction process (figure 30a), and the re-initiation location is also different. Multiple collisions are presented to sustain the shock–flame coupling (figure 30b). At
 $t=60$, the high-pressure and high-temperature region induced by the collision becomes a local explosion, which can be observed at
 $t=70$. A complex triple-point structure at
 $t=80$ that is responsible for engulfing the shocked reactant close to the wall has been commonly observed in experiments (Nagura et al. Reference Nagura, Kasahara, Sugiyama and Matsuo2013). A similar mechanism can be observed from
 $t=110$ to
 $t=120$.
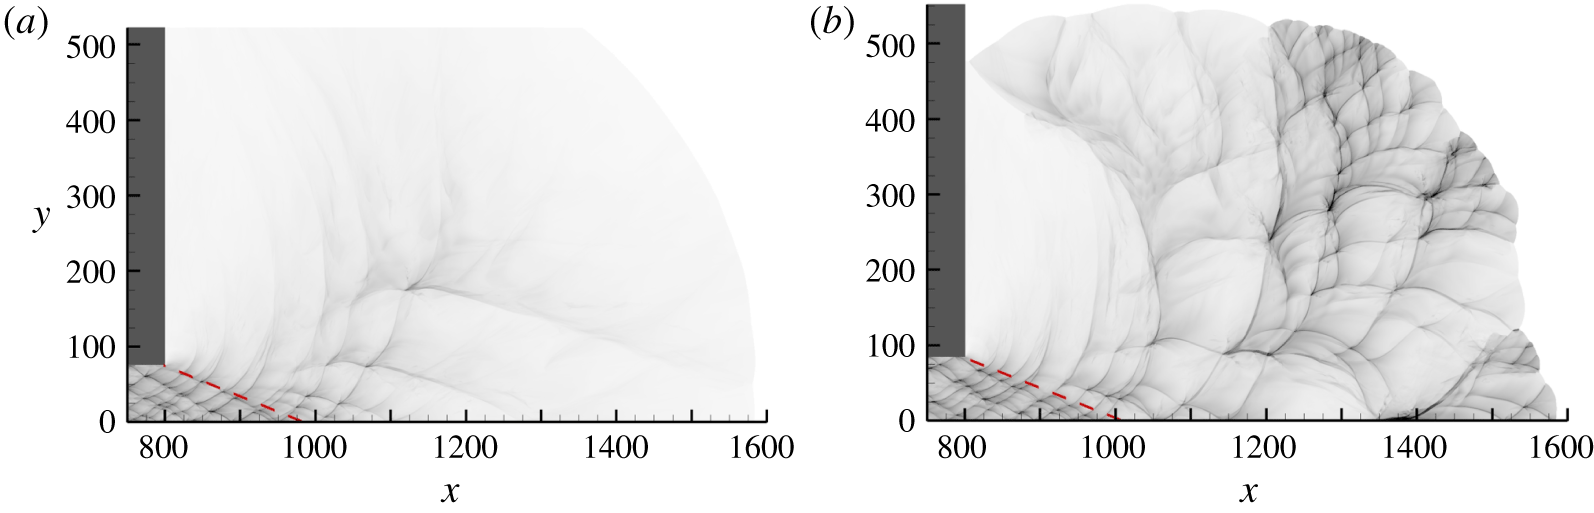
In summary, for supercritical/subcritical planar detonation diffractions, the detonation initially extinguishes behind the shock with the presence of a large area of shocked but unreacted mixture, and re-initiation is primarily determined by the strength of the reflected rarefaction wave. The combined effect of transverse wave collisions and the reflected rarefaction wave plays an important role in cellular detonation diffractions. The newly formed Mach stem is responsible for fast burning. Otherwise, the reaction will quench if the Mach stem continues to decay to a weak incident shock. The failure of re-initiation occurs when there are not enough strong transverse wave collisions to create new strong Mach stems before the decoupling phenomenon, due to a strong reflected rarefaction wave effect. Successful re-initiation occurs with the formation of multiple hot bubbles, which form during the collisions of transverse waves with opposite directions. Overall, transverse waves can facilitate the successful transmission of detonation with a smaller critical inlet channel width. Because the dynamics of transverse waves are unpredictable, the hot bubble locations are more or less randomly distributed, as shown in the numerical soot foils in figure 31.
Numerical soot foils for cellular detonation diffractions with (a)  $w=75$ and (b)
 $w=85$.

Although these calculations are performed for a weakly stable detonation using simplified chemical kinetics, the re-initiation results show many similarities to those observed in the experimental work of Mehrjoo et al. (Reference Mehrjoo, Gao, Kiyanda, Ng and Lee2015). They used porous-walled tubes to suppress transverse instability and demonstrated that successful transmission was reliant on frontal instability. Furthermore, the results of the present study provide a plausible explanation for the failure of correlation between the critical channel width and the cell width for highly diluted mixtures (Desbordes et al. Reference Desbordes, Guerraud, Hamada and Presles1993). For highly unstable mixtures, the presence of a substantial number of transverse waves tends to increase the possibility of successful transmission; thus, the correlation between the channel width and the cell width is established. However, in the study of highly diluted mixtures with the presence of weak transverse waves, corresponding to the situation of the planar cases, the competition between the attenuation effect of the reflected rarefaction wave and the coalescence of the compression wave and the shock becomes crucial and depends on the critical channel width. In this situation, the correlation between the dynamic parameters is less significant.
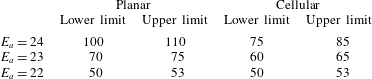
For further investigate the effect of cellular instabilities on the critical width under various activation energies, table 1 lists the upper and lower limits of the critical channel widths for  $E_{a}=22$–24, when
 $Q$ and
 $\unicode[STIX]{x1D6FE}$ are kept constant. The difference between the two scenarios shrinks as the activation energy decreases. When
 $E_{a}=22$, the critical channel widths for both scenarios fall between 50 and 53 half-reaction-lengths. This indicates that, for a more stable mixture, the effect of cellular instabilities on the critical width vanishes in the diffraction and reconciles with the result of the scenario with a planar incident wave.
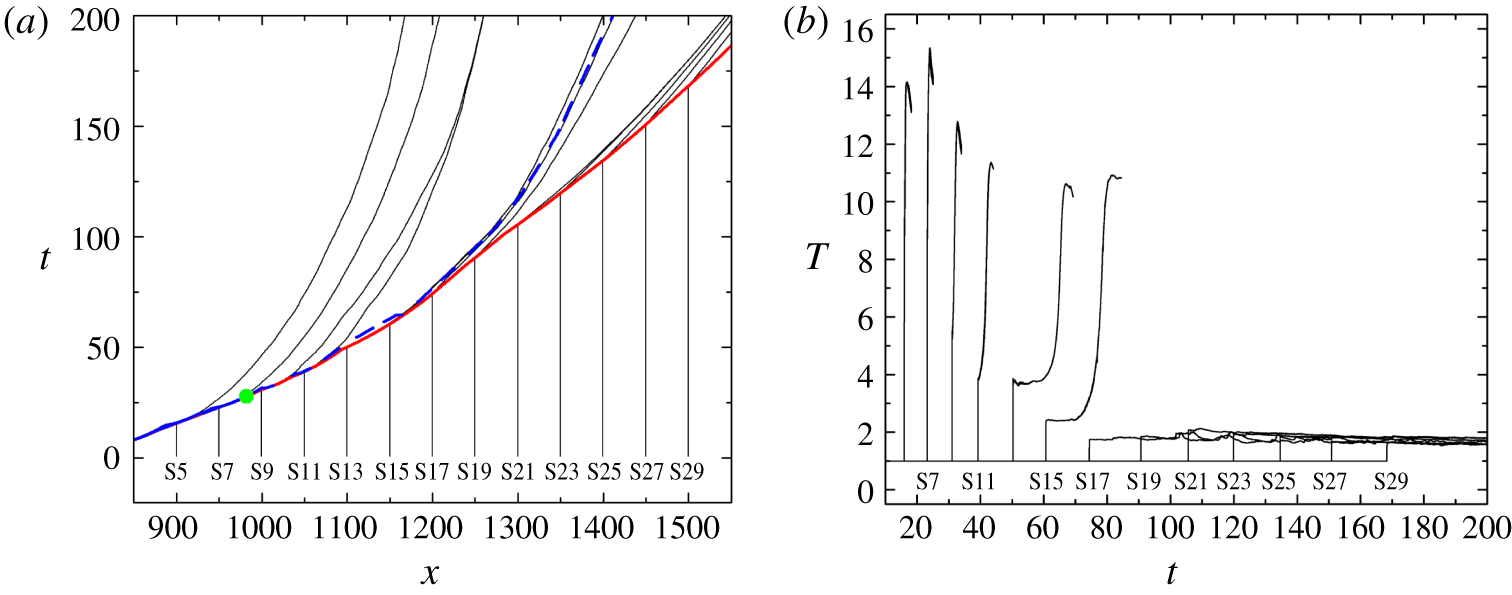
(a) Particle paths for particles on the plane of symmetry for the cellular case with  $w=75$. The solid red line indicates the
 $x$–
 $t$ diagram of the leading shock wave; the dashed blue line depicts the
 $x$–
 $t$ diagram of half-reaction completion; and the green dot indicates the theoretical intersection point predicted by the Skews’ construction. (b) Temperature profiles along the particle paths.

The variation of critical channel width with the activation energy.

3.4.1 Particle analysis
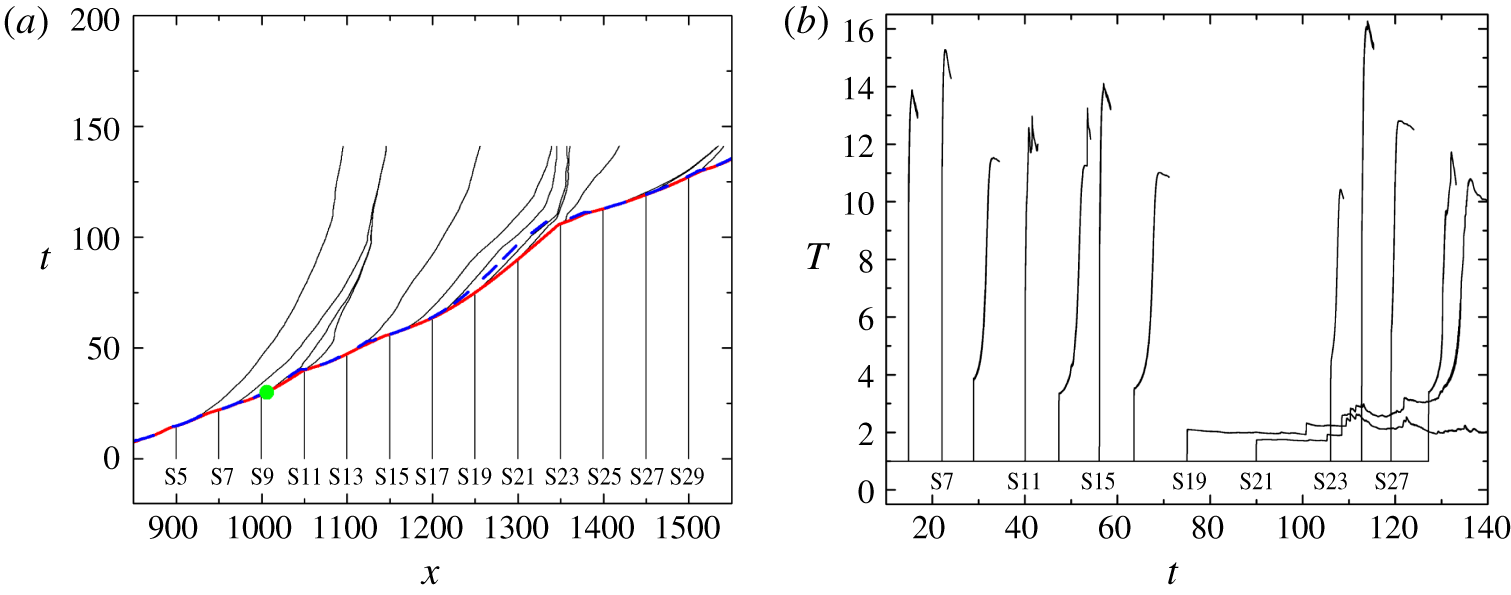
In the cellular case with  $w=75$, the theoretical intersection of the disturbance line with the plane of symmetry is at (
 $x,y$) = (982, 0). In contrast with the quick decoupling processes beyond the intersection points in the planar cases (figures 14a and 15a), the shock front and the flame front are still loosely coupled until
 $x\approx 1200$ (figure 32a) on the plane of symmetry, though the cellular structure has been distorted across the disturbance line (figure 31a). The ignition delays increase gradually from particle S9 to particle S15, with reaction quenched for particles S17–S29 (figure 32b). Notably, the particle locations are the same as those in figure 13.
In the cellular case with  $w=85$, the intersection point is at (
 $x,y$) = (1006, 0). Similar to the failure case, the shock front and flame are coupled together along the plane of symmetry, except at
 $x\approx 1220{-}1350$, where the maximum half-reaction-length is approximately 25 at
 $t=107$ (figure 33a). This is due to the lack of transverse wave impingement in this region, as observed in figure 31(b). Particle S19 remains unreacted in an unreacted pocket until the end of the simulation (
 $x=1357$ at
 $t=140$ in figure 30a). S21 is burnt in the complex flow field far behind the leading shock, with an ignition delay of approximately 44. For the remaining particles, they are basically burnt in two scenarios. In the first scenario, the particles are overtaken by the newly formed Mach stems. The speed of the Mach stem in the current simulation is recorded up to nearly
 $1.3D_{CJ}$. Particles passing through this locally overdriven wave are characterised by a high
 $T_{vN}$ and a very short ignition delay. Particles S5, S7, S11, S15, S25 and S27 are classified as the first scenario. In the second scenario, as the decay of the Mach stem becomes significant,
 $T_{vN}$ decreases, and the ignition delays of particles will increase. This scenario includes particles S9, S13, S17, S23 and S29.
(a) Particle paths for particles on the plane of symmetry for the cellular case with  $w=85$. The solid red line indicates the
 $x$–
 $t$ diagram of the shock wave; the dashed blue line depicts the
 $x$–
 $t$ diagram of half-reaction completion; and the green dot indicates the theoretical intersection point predicted by the Skews’ construction. (b) Temperature profiles along the particle paths.

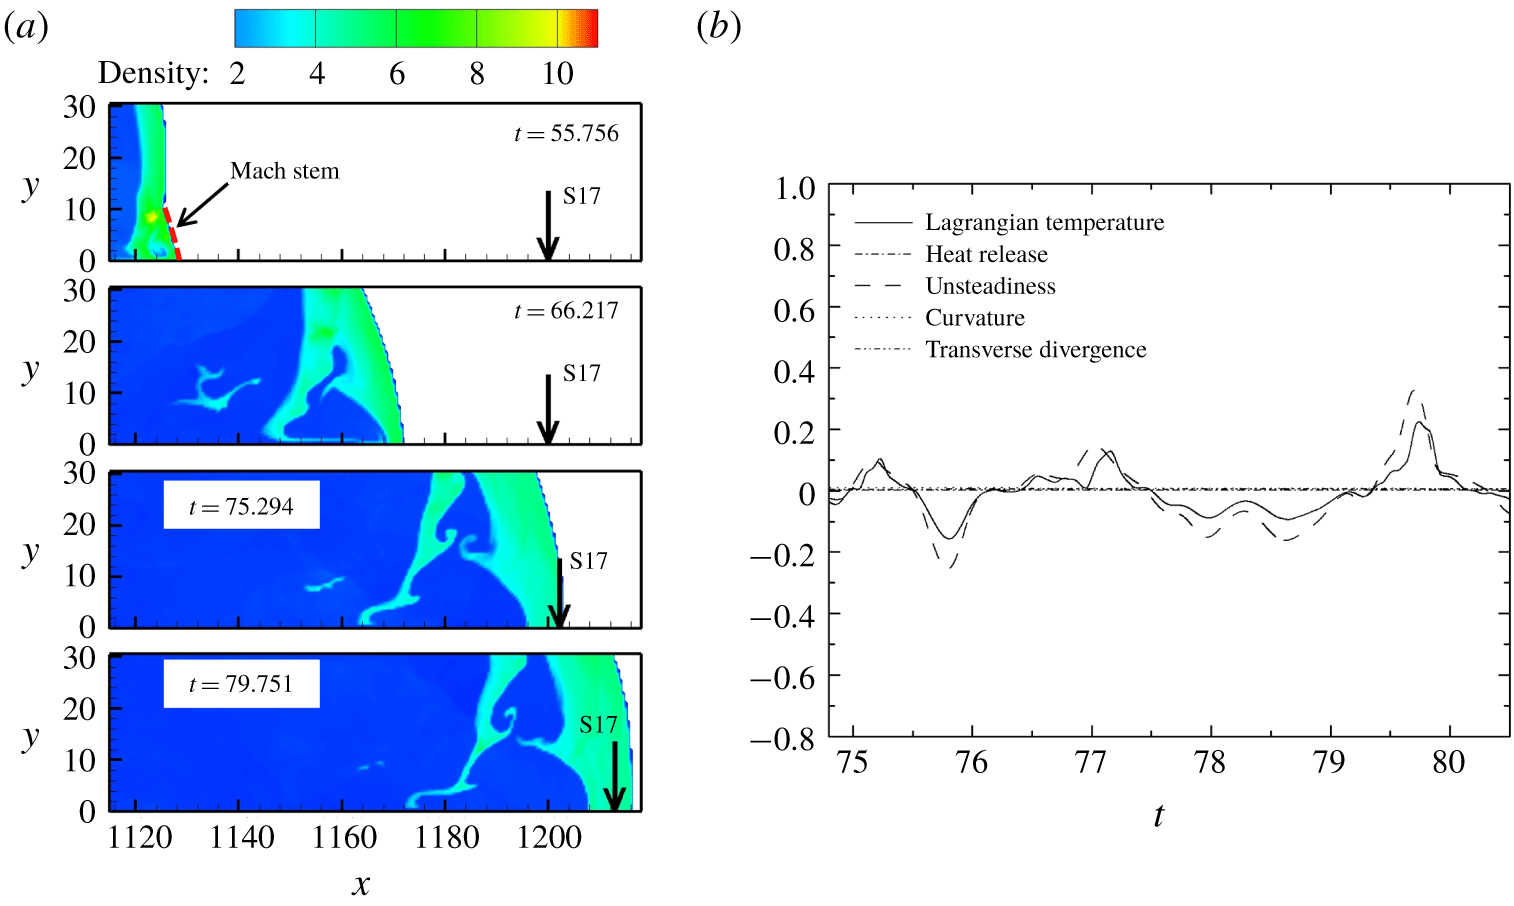
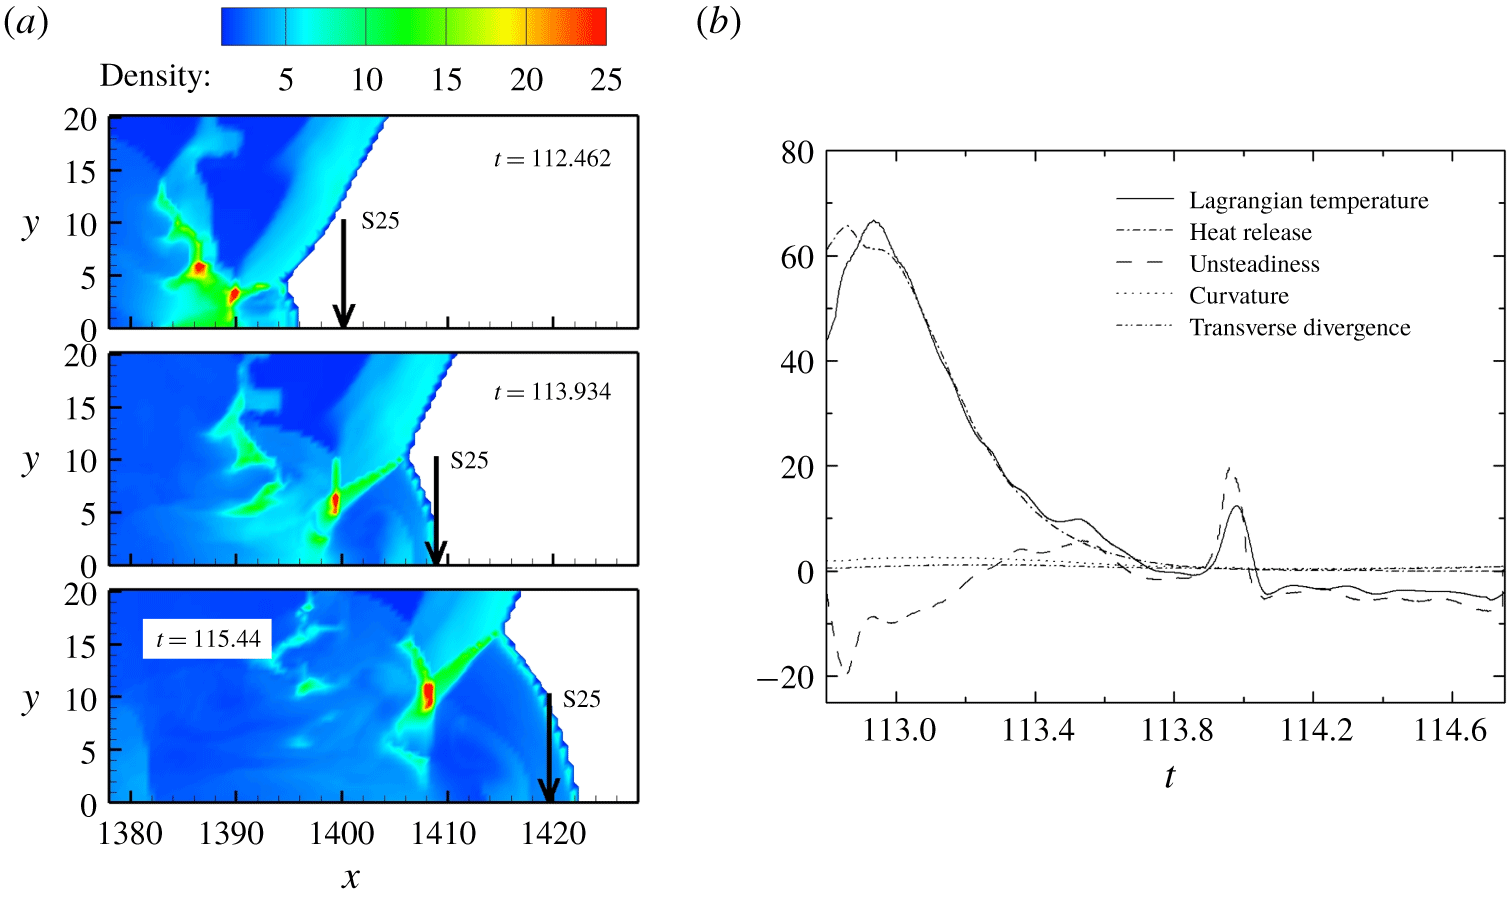
We now examine closely the behaviour of particles in cellular detonation propagation. Particle S17 from the case with  $w=75$ is selected to represent the situation where no transverse wave collision occurs and the Mach stem continues to decay (figure 34a). On the other hand, particle S25 from the case with
 $w=85$ is selected to represent the situation when the particle is ignited by a newly formed Mach stem (figure 35a). The decomposition of the terms in the Lagrangian temperature derivative for particle S17 are displayed in figure 34(b). The curvature term, the transverse divergence term and the heat release term are all close to zero. The variation of the Lagrangian derivative of temperature is mainly attributed to the unsteadiness term. For particle S25 in the cellular case with
 $w=85$ (figure 35b), the unsteadiness term remains negative before
 $t=113.25$ as a result of decaying shock velocity. Later, the unsteadiness term fluctuates, which might be due to the interaction with the wake flow. The corresponding amplitude of the heat release term is large compared to those for the planar re-initiation case with
 $w=110$ in figure 16(a). The heat release term dominates the increase of the Lagrangian derivative of temperature at the early stage of a particle’s encounter by the newly formed Mach stem, whereas the unsteadiness term becomes dominant when the Mach stem continues to decay.
(a) Locations of particle S17 in the flow. (b) Terms in the Lagrangian temperature derivative for particle S17 on the plane of symmetry in the cellular case with  $w=75$.

(a) Locations of particle S25 in the flow. (b) Terms in the Lagrangian temperature derivative for particle S25 on the plane of symmetry in the cellular case with  $w=85$.

From the analysis of S17 ( $w=75$) and S25 (
 $w=85$), we conclude that, for the gas studied here, the newly formed Mach stem is responsible for burning the reactant. Without the formation of new triple points, the Mach stem will continue to decay to a weak incident shock, and the reaction will quench. The scenarios to burn the gas have already been well observed and analysed from particles on the plane of symmetry. Notably, the particles along the
 $\unicode[STIX]{x1D702}$ line were not decomposed as we did in the planar cases, because the
 $\unicode[STIX]{x1D702}$ line is no longer the re-initiation path. Furthermore, in the free space far from the symmetry plane, the flow structure behind the leading shock is complicated for the cellular case. The assumption that the flow is symmetric along the
 $\unicode[STIX]{x1D702}$ line is no longer valid for particles in this region.
4 Conclusion
This paper presents the numerical results of a weakly unstable detonation diffraction. To mimic the experimental conditions, a long inlet channel was used to exclude the influence of the boundary condition at the rear end of the channel. The diffractions of a planar detonation wave and a cellular detonation wave were investigated. The critical channel width for successful transmission was smaller for the cellular detonation wave than for its planar counterpart. One of the most significant findings of this study is that, for planar detonation diffraction, due to the large induction time gradient of the shocked but unreacted gas, a bulge of flame appears at the upper right portion. Re-initiation is attributed to the formation of the compression wave induced by the relatively intense heat release in the shocked but unreacted zone and its amplification towards the diffracted shock. Re-initiation occurs if the coalescence of the compression wave and the shock wave is overdriven. This is similar to one of the key mechanisms of the deflagration to detonation transition. In addition, the rarefaction wave seems to be crucial for the formation of the re-initiation bubble. In the planar case with  $w=100$, early reflection suppressed the reaction along the
 $\unicode[STIX]{x1D702}$ direction and destroyed the deflagration to detonation transition process. This hypothesis is supported by the successful transmission case without the presence of reflected rarefaction wave.
The second major finding is that the transverse wave can facilitate the successful transmission of detonation with a smaller critical inlet channel width. In the cellular cases, particle analysis reveals that the particles are mostly burnt by the newly formed Mach stem with a velocity higher than  $D_{CJ}$. In the absence of new triple-point formation, the reaction is quenched when the decay of the Mach stem is significant. In the cellular cases, the transmission is largely determined by the effective collisions of transverse waves, with multiple randomly distributed hot sites, rather than a single hot bubble, as seen in the planar cases. It is also important to note that our simulations address the re-initiation mechanism for an ideal inviscid gas with a simplified chemical model. For highly unstable gases, in addition to the consumption of the reactant by Mach stems, the propagation/re-initiation dynamics involves the burning mechanism of unreacted pockets. Turbulent mixing will be important near the surfaces of the pockets, and three-dimensional simulations with diffusive effects should be considered. Further investigation is recommended to assess the effects of turbulent fluctuations (Maxwell et al. Reference Maxwell, Bhattacharjee, Lau-Chapdelaine, Falle, Sharpe and Radulescu2017; Radulescu Reference Radulescu2018; Radulescu & Borzou Reference Radulescu and Borzou2018), chemical kinetics and non-equilibrium thermodynamics (Shi et al. Reference Shi, Shen, Zhang, Zhang and Wen2017; Uy, Shi & Wen Reference Uy, Shi and Wen2018, Reference Uy, Shi and Wen2019) on diffraction problems.
Acknowledgements
This work was supported by the State Key Laboratory of Explosion Science and Technology, Beijing Institute of Technology (grant no. KFJJ18-12M) and the National Natural Science Foundation of China (grant no. 11772284).
Declaration of interests
The authors report no conflict of interest.