Implications
Insulin-like growth factors (IGFs) are involved in the regulation of growth and metabolism and are hence influencing economically important traits in livestock. Genetic variation in the porcine IGF2 gene has previously been shown to have a strong impact on growth and body composition traits. Here, we are describing the identification of additional genetic variation within this genomic region. The results can contribute to the understanding of mechanisms regulating growth and body composition and thus improve the breeding for economically important traits in pigs.
Introduction
The insulin-like growth factor (IGF) system is an evolutionary conserved regulatory network encompassing the two growth factors IGF1 and IGF2, their corresponding cell surface receptors IGF-1R and IGF-2R and several binding proteins. The IGF system exhibits several distinct effects on growth and metabolism, thus affecting important performance traits in livestock species. IGF1 is expressed at different levels under the control of the pituitary growth hormone (GH) in most tissues during the entire lifespan of an organism. It substantially contributes to the control of growth, differentiation, cell proliferation and apoptosis. On the other hand, the expression level of IGF2 is independent of GH and its importance is more confined to fetal development and growth. The IGF2 gene is subject to genomic imprinting and only the paternally inherited allele is expressed.
Several quantitative trait loci (QTL) affecting growth-related traits have been identified within the IGF2 region in livestock species. In pigs, a major QTL for muscle growth, fat deposition and heart size was mapped at the position of IGF2 on porcine chromosome SSC2 (Jeon et al., Reference Jeon, Carlborg, Törnsten, Giuffra, Amarger, Chardon, Andersen-Eklund, Andersson, Hansson, Lundström and Andersson1999; Nezer et al., Reference Nezer, Moreau, Brouwers, Coppieters, Detillieux, Hanset, Karim, Kvasz, Leroy and Georges1999; De Koning et al., Reference De Koning, Rattink, Harlizius, van Arendonk, Brascamp and Groenen2000; Thomsen et al., Reference Thomsen, Lee, Rothschild, Malek and Dekkers2004). The QTL explains up to 30% of the phenotypic variance for muscle growth and up to 20% for backfat (BF) size, respectively (Jeon et al., Reference Jeon, Carlborg, Törnsten, Giuffra, Amarger, Chardon, Andersen-Eklund, Andersson, Hansson, Lundström and Andersson1999; Nezer et al., Reference Nezer, Moreau, Brouwers, Coppieters, Detillieux, Hanset, Karim, Kvasz, Leroy and Georges1999). A causative quantitative trait nucleotide (QTN) was identified by Van Laere et al. (Reference Van Laere, Nguyen, Braunschweig, Nezer, Collette, Moreau, Archibald, Haley, Buys, Tally, Andersson, Georges and Andersson2003). The mutation is located within a regulatory structure in intron 3 (IGF2-intron3-G3072A) of the gene affecting the binding of the transcription factor ZBED6 and thus leading to a threefold increased expression in skeletal muscle (Markljung et al., Reference Markljung, Jiang, Jaffe, Mikkelsen, Wallerman, Larhammar, Zhang, Wang, Saenz-Vash, Gnirke, Lindroth, Barrés, Yan, Strömberg, De, Pontén, Lander, Carr, Zierath, Kullander, Wadelius, Lindblad-Toh, Andersson, Hjälm and Andersson2009). Jungerius et al. (Reference Jungerius, van Laere, Te Pas, van Oost, Andersson and Groenen2004) verified and re-analysed the polymorphism in other pig breeds. Genetic variation related to the number of born piglets, BF thickness and lean meat content has been identified in introns 2 and 7 of the IGF2 gene (Knoll et al., Reference Knoll, Putnová, Dvořák and Čepica2000; Vykoukalová et al., Reference Vykoukalová, Knoll, Dvorák and Čepica2006). However, these polymorphisms did not explain the variation beyond the effect of the IGF2-intron3-G3072A polymorphism. Recently, it was shown that the effect on prolificacy in sows with a different paternal IGF2 genotype might be a secondary effect, resulting from differences in fat deposition (Stinckens et al., Reference Stinckens, Mathur, Janssens, Bruggeman, Onagbesan, Schroyen, Spincemaille, Decuypere, Georges and Buys2010).
The aim of this study was to confirm the QTL within an experimental Piétrain × Large White/Landrace population and to test for the existence of additional genetic variation explaining phenotypic variance beyond the IGF2-intron3-G3072A mutation.
Material and methods
Animals and phenotypes
A three-generation resource pedigree comprising 2741 F2 animals was established by mating five purebred Piétrain boars to Large White, Landrace and Large White × Landrace crossbred sows. All founder animals were genotyped homozygous stress resistant at the ryanodine receptor locus. The F2 generation was established by repeatedly mating F1 boars to several full-sib sows (for further details see Borchers et al., Reference Borchers, Reinsch and Kalm2000, Reference Borchers, Reinsch and Kalm2002 and Reference Borchers, Reinsch and Kalm2004).
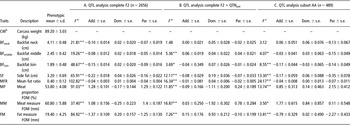
Phenotypic data was recorded for a broad range of performance traits including growth, body composition and meat quality. In this study, eight body composition traits were analyzed (Table 2). All carcass trait data were collected after routine slaughter in an abattoir without any intervention in the living animal. Carcass weight was measured directly after slaughtering. BF thickness was determined as the biggest fat depth over the withers (BFneck), the smallest fat depth over the middle of the back (BFmiddle) and the smallest fat depth over the Musculus psoas major (BFloin). The side fat (SF) thickness is the biggest meat-free fat depth over the ventral end of the Musculus latissimus dorsi. Further, fat- and meat measures were recorded between the third- and second-last rib using the infrared reflection stab-in probe ‘Fat-O-Meat'er’ (Carometec A/S, Herlev, Denmark). From this data, the meat proportion (MP) was calculated according to the ‘Bonner Formula’ from 1999: MP (%) = 51.279 + 0.305 × area of Musculus longissimus dorsi (cm2) − 0.270 × fat area (cm2) − 0.406 × SF depth (cm) − 0.664 × mean BF depth (cm). The meat–fat ratio (MFR) was calculated from the loin eye muscle area and the area of overlying fat measured at an incision between the 13th and 14th rib. The listed methods of measurement and calculation are in accordance with the performance-testing directive of the central association for German pig production (Zentralverband der Deutschen Schweineproduktion). In total, 2404 animals with complete phenotypic data sets were used.
Markers and genotyping
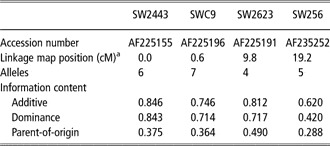
The four microsatellite markers SW2443, SWC9, SW2623 and SW256 (Table 1) were chosen from the MARC-USDA porcine linkage map (http://www.marc.usda.gov, Alexander et al., Reference Alexander, Troyer, Rohrer, Smith, Schook and Beattie1996; Rohrer et al., Reference Rohrer, Alexander, Keele, Smith and Beattie1994 and Reference Rohrer, Alexander, Hu, Smith, Kele and Beattie1996) to cover the first 20 cM at the telomeric end of SSC2p including IGF2 at 0.6 cM. One of the used markers is located 13 kb downstream of IGF2-in3G3072A in the 3′-UTR of IGF2 (Van Laere et al., Reference Van Laere, Nguyen, Braunschweig, Nezer, Collette, Moreau, Archibald, Haley, Buys, Tally, Andersson, Georges and Andersson2003). Genotyping was done by ratio-optimized multiplex-PCR and subsequent fragment length analysis with an ABI 3130xl capillary sequencer (Applied Biosystems, Foster City, CA, USA), the obtained genotypes were validated using the tool PEDSTATS (Wigginton and Abecasis, Reference Wigginton and Abecasis2005).
Marker statistics and information contents

aAccording to the MARC-USDA porcine linkage map.
The single nucleotide polymorphism (SNP) IGF2-intron3-G3072A was genotyped by pyrosequencing (Services in Molecular Biology GmbH, Rüdersdorf, Germany) according to Van Laere et al. (Reference Van Laere, Nguyen, Braunschweig, Nezer, Collette, Moreau, Archibald, Haley, Buys, Tally, Andersson, Georges and Andersson2003) in a subset of the pedigree comprising the complete P- and F1-generation as well as 715 F2 animals. The QTN genotypes of additional 1352 F2 animals were imputed using the adjacent microsatellite marker SWC9. Furthermore, the microsatellite was used to determine the parental origin of the QTN alleles in heterozygous F2 animals.
Statistical analysis
The QTL analysis was performed applying an interval mapping approach according to Haley and Knott (Reference Haley and Knott1992) using the QTL mapping application GridQTL (Seaton et al., Reference Seaton, Hernandez, Grunchec, White, Allen, De Koning, Wei, Berry, Haley and Knott2006). The fixed effects of sex, family and fattening group were included in the model and the carcass weight was considered as a covariate. The analyzed body composition traits are listed in Table 2. The significance thresholds were derived empirically by a permutation test with 10 000 permutations as described by Churchill and Doerge (Reference Churchill and Doerge1994) and the marker information contents were calculated according to Knott et al (Reference Knott, Marklund, Haley, Andersson, Davies, Ellegren, Fredholm, Hansson, Hoyheim, Lundström, Moller and Andersson1998) as implemented in GridQTL.
Summary of the analyzed traits and results of the QTL analyses using the complete F2 without (A.) and with (B.) inclusion of the presence of a paternally inherited favorable QTN allele as fixed effect and the reduced subset homozygous for the favorable QTN allele (C.). For each QTL analysis the F-value, Add., Dom. and Par. effect together with their s.e. are given

QTL = quantitative trait loci; QTN = quantitative trait nucleotide; Add. = estimated additive; Dom. = dominance; Par. = parent-of-origin; FOM = Measured with ‘Fat-O-Meat'er’.
aAsterisks depict significant QTL (*for the 0.05 level and **for the 0.01 level of significance).
bCW was used as a covariate.
The analysis was performed in three steps starting with the entire set of genotyped animals. In the second step, the QTL analysis was extended by including the fixed effect of either a paternally or a maternally inherited positive QTN allele (growth stimulating allele A). Finally, the QTL analysis was repeated within two subgroups of animals alternatively homozygous for the QTN, thus completely eliminating the segregation of the QTN as a possible source of variation.
Results and discussion
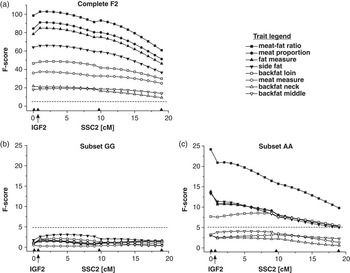
The initial QTL analysis in 2404 genotyped animals without the inclusion of a QTN effect expectedly revealed highly significant QTL for all analyzed traits (Table 2) with the QTL peaks located exactly at the IGF2 position (Figure 1a). The most pronounced QTL are those for MFR, MP, fat measure (FM) and SF with the QTL for MFR explaining 13% of the phenotypic variance. A clear parent-of-origin effect was observed for those traits, consistent with the effects reported by Jeon et al. (Reference Jeon, Carlborg, Törnsten, Giuffra, Amarger, Chardon, Andersen-Eklund, Andersson, Hansson, Lundström and Andersson1999), Nezer et al. (Reference Nezer, Moreau, Brouwers, Coppieters, Detillieux, Hanset, Karim, Kvasz, Leroy and Georges1999), De Koning et al. (Reference De Koning, Rattink, Harlizius, van Arendonk, Brascamp and Groenen2000) and Thomsen et al. (Reference Thomsen, Lee, Rothschild, Malek and Dekkers2004). The estimated additive effects are similar in size compared with the estimated parent-of-origin effects. This can be expected, because imprinting in the form of uniparental expression should similarly manifest itself in both estimates when applying the current method. The estimated dominance effects are minor and have high standard errors. The algebraic sign of the additive effect indicates the founder line origin of the allele increasing the trait measure. In this case, all alleles increasing muscle measures do thus originate from Piétrain and those increasing FMs from the White breeds.
Test statistics profile for the complete set of animals (a) and the subsets of animals alternatively homozygous at the IGF2-intron3-G3072A mutation (b: unfavorable allele G, c: favorable allele A). Marker positions are shown with triangles on the abscissa. Dashed lines depict the significance threshold given as the highest F-threshold obtained from the permutation procedure for α = 0.01 across all analyzed traits.

A total of 743 animals including the founder lines and the F1 generation were genotyped for the QTN described by Van Laere et al. (Reference Van Laere, Nguyen, Braunschweig, Nezer, Collette, Moreau, Archibald, Haley, Buys, Tally, Andersson, Georges and Andersson2003). All Piétrain founder boars were homozygous for the positive QTN allele (A), whereas the Large White and Landrace founder sows, except for two animals, were homozygous for the alternative allele (G). Consequently, the F1 generation is predominantly heterozygous for the SNP resulting in the existence of all possible genotypes and combinations of parental allele origins in the F2 generation. On the basis of the co-segregation of the QTN and the microsatellite SWC9, it was possible to infer the QTN genotypes of additional 1352 F2 animals, resulting in a total of 2095 available SNP genotypes. Assuming that one megabase physical distance corresponds to 1 cM, a recombination frequency of 0.013 can be expected between the two polymorphisms. Thus, the impact arising from possibly wrong inference of QTN genotypes is negligibly small. In addition, the information coming from microsatellites was used to determine the parental origin of the QTN alleles in 1592 F2 animals, because almost all F1 animals are heterozygous for the biallelic SNP. The subset of animals with complete SNP information was included in the subsequent analysis steps.
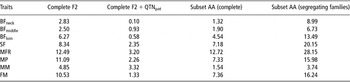
After standard QTL mapping, the QTL analysis was repeated including the presence of either a paternally or maternally inherited positive QTN allele as a fixed effect. Whereas the maternally inherited positive QTN allele had almost no effect (data not shown), the same QTN allele had a strong impact when it was paternally inherited and explained most of the observed phenotypic variance. However, a QTL with significant effects on the analyzed traits remained within the IGF2 region. This QTL still explains >3% of the phenotypic variance observed in the analyzed subset for the trait MFR but only 0.1% for the trait BFneck (Table 3).
Proportions of phenotypic variance explained by the QTL in percent. Given are the values for the analyses using the complete F2 without and with (+QTNpat) inclusion of the presence of a paternally inherited favorable QTN allele as fixed effect and the analysis confined to the reduced subset homozygous for the favorable QTN allele (subset AA). The latter has further been confined to 170 F2 animals from two families segregating for the additional QTL

QTL = quantitative trait loci; QTN = quantitative trait nucleotide; BF = backfat; SF = side fat; MFR = meat–fat ratio; MP = meat proportion; FM = fat measure; MM = meat measure.
The large resource pedigree provides the possibility to confine the analysis to two F2 groups alternatively homozygous for the QTN (AA, n = 489 and GG, n = 568), completely eliminating the variation contributed by the IGF2-intron3-G3072A mutation. This approach allows getting a better insight into the architecture of variation within this chromosomal region. As the alternative alleles essentially originate from different breeds it can be checked where additional variation in the vicinity of the IGF2-intron3-G3072A mutation stems from. Indeed, no QTL could be observed in the GG subset (Figure 1b), whereas significant QTL for all analyzed traits except for BFneck were detected in the subset homozygous for the positive allele A (Table 2, Figure 1c). The additional QTL explains up to 12% of the remaining variance in the AA subset (Table 3). The confinement to the AA subset reduces the phenotypic variance substantially when compared with the complete pedigree. The reduction is especially pronounced for the traits MFR, MP and FM, in which the variance is 30%, 25% and 28% smaller, respectively. Thus, the estimated proportion of phenotypic variance explained by the additional QTL is overestimated with respect to the complete resource population. The values of explained variance obtained from the analysis including the favorable paternal QTN allele and using the complete F2 are more informative in this context (Table 3). However, all families are segregating for the IGF2-intron3-G3072A mutation, whereas only two families are segregating for the additional QTL. Within these families the proportion of variance explained by the QTL is very high explaining almost one-third of the phenotypic variance for meat–fat ratio in animals homozygous AA at the IGF2-intron3-G3072A mutation.
These findings clearly indicate the presence of additional causative genetic variation within our resource population. A similar approach of detecting additional polymorphisms contributing to a QTL effect beyond known mutations by analyzing QTL homozygous subgroups has been applied by Kühn et al. (Reference Kühn, Thaller, Winter, Bininda-Emonds, Kaupe, Erhardt, Bennewitz, Schwerin and Fries2004) in the German Holstein population. The authors analyzed bulls homozygous for the DGAT1 mutation K232A and thereby identified a variable number of tandem repeats (VNTR) within the promoter region of the gene additionally contributing to the QTL variance.
With all Piétrain founder boars homozygous for the A allele, the animals homozygous GG exclusively carry IGF2 haplotypes derived from the white breeds. However, in the subset AA, combinations of Piétrain and Large White/Landrace haplotypes do occur due to two heterozygous founder sows. When excluding the 170 descendants of these sows from the analysis, no significant QTL remains within the AA subset as well. In an analysis confined to these families with combinations of positive QTN alleles of Piétrain and Large White/Landrace origin similar effects as in the analysis of the complete AA subset can be observed (Table 3).
On the basis of the results of this study, we conclude that additional causative genetic variation exists besides the known IGF2-intron3-G3072A mutation within or adjacent to the IGF2 gene contributing to the QTL effect. The estimated effects in the AA subset all have the same direction as observed within the entire pedigree suggesting a polymorphism working synergistically to the IGF2-intron3-G3072A polymorphism. However, it remains unclear whether the imprinting characteristics of the newly discovered QTL are consistent with the mechanism described for IGF2. This becomes obvious when looking at the effects estimated for meat measure. For this trait a substantial parent-of-origin effect can be observed in the QTL analysis using the complete F2, whereas the additional QTL in the AA subset exhibits mainly an additive effect. Further investigations with the aim to identify the putative additional mutation/s will be conducted.
Acknowledgements
The authors are grateful to the H. Wilhelm Schaumann Stiftung, Hamburg, Germany, for financial support of the study.