1. Introduction
In spite of the overwhelming evidence that world fisheries are in crisis, with fishing efforts far exceeding sustainable levels, all forms of fishing regulations are constantly being violated worldwide (see OECD, 2006 for some estimates of illegal fishing). Moreover, some fisheries have completely collapsed or are much depleted, which poses a serious threat to food security and sustainable livelihoods, especially in developing coastal countries (Pauly and Zeller, Reference Pauly and Zeller2003). To reverse or halt the over fishing, adequate levels of compliance must be enforced. A possible means of achieving this is to investigate the reasons for non-compliance and then formulate policies accordingly. In view of this, following Becker's theoretical model (Reference Becker1968), later developed by Ehrlich (Reference Ehrlich1973) and Block and Heineke (Reference Block and Heineke1975), a number of empirical studies have been done to verify the determinants of non-compliance with fishery regulations. Some of the leading works in this area are Furlong (Reference Furlong1991), Kuperan and Sutinen (Reference Kuperan and Sutinen1994), and Hatcher et al. (Reference Hatcher, Jaffry, Thébaud and Bennett2000). The theoretical basis of these models sees the fisherman as a self-interested and rational economic agent who aims at maximizing expected utility from illegal fishing. Consequently, he engages in illegal fishing if the expected gains from violation outweigh the gains from legal fishing.
The crime models applied to the violation of fishery regulations (such as closed area, quantity restriction, or gear restriction) have considered a situation where the potential violator faces a one-period decision problem of maximizing an expected utility (see for example Sutinen and Anderson, Reference Sutinen and Andersen1985; Anderson and Lee, Reference Anderson and Lee1986; Sutinen and Hennessey, Reference Sutinen, Hennessey, Miles, Pealey and Tokes1986; Furlong, Reference Furlong1991; Kuperan and Sutinen, Reference Kuperan and Sutinen1994; Charles et al., Reference Charles, Mazany and Cross1999; Sutinen and Kuperan, Reference Sutinen and Kuperan1999; Hatcher et al., Reference Hatcher, Jaffry, Thébaud and Bennett2000; Hatcher, Reference Hatcher2005; Chavez and Salgado, Reference Chavez and Salgado2005). Following Heineke's portfolio model of time allocation (Reference Heineke and Heineke1978), time is included in the models and treated as a one-period decision variable (e.g. see Furlong, Reference Furlong1991). Thus the fisherman is assumed to have a fixed amount of time, of which he spends some amount on illegal fishing (see Furlong, Reference Furlong1991; Sutinen and Kuperan, Reference Sutinen and Kuperan1999). Alternatively, he faces a one-period binary decision problem of obeying or not obeying a specific regulation, say a catch quota (see e.g. Hatcher et al., Reference Hatcher, Jaffry, Thébaud and Bennett2000). However, for crimes that are committed repeatedly, such as the one considered in this paper – the acquisition and use of nets with an illegal mesh size – the uncertainty of time of detection makes it difficult, if not impossible, for the potential violator to aggregate the uncertain gains from the crime to be used for one-period or static decision-making. Furthermore, the fact that it is possible for a violator to get away with the crime for some time implies that he will want to know how long he can continue undetected, which will depend on the probability that he will be caught, given that he has managed to get away with the crime in the past (i.e. instantaneous conditional probability). Thus, he will be confronted with the task of choosing an optimal path of violation. Since the expected returns are obtained over a period of time, in addition to the instantaneous conditional probability of detection and the fine, the optimal path will depend on the individual discount rate. This type of crime is, therefore, modelled as a dynamic deterrence problem (see for example Davis, Reference Davis1988; Nash, Reference Nash1991; Leung, Reference Leung1991, Reference Leung1994).
In this paper, the existing work on regulatory compliance in a fishery is extended to investigate whether the individual discount rate, among other possible factors, influences the intensity of violation of the mesh size regulation, a crime that is committed repeatedly. The predictions of the model are tested with data from an artisanal fishery in Ghana. The artisanal or inshore fishery in Ghana is characterized by the use of destructive fishing gears, including nets that have patches with small mesh sizes that target juvenile stock, contributing to over fishing (Atta-Mills et al., Reference Atta-Mills, Alder and Sumaila2004; Walker, Reference Walker2002; Koranteng, Reference Koranteng1992). This is a typical fishery crime that constitutes an example of a dynamic deterrence problem and is therefore modelled as such in this paper. The results of this study indicate that the individual discount rate is statistically significant and positively related to the intensity of violation of the mesh size regulation. Furthermore, the risk and severity of punishment, social pressure, the perceived legitimacy and feasibility of the regulation, and the fairness of the regulation increase the intensity of violation, and younger skippers have a higher intensity of violation.
The rest of the paper is organized as follows. The basic model is presented in section 2. This is followed by the survey design and data description in section 3. Section 4 presents the calculations and discusses the model. Section 5 concludes.
2. The theoretical framework
The model for this study is a dynamic deterrence model that closely follows the logic of Davis (Reference Davis1988), Nash (Reference Nash1991), and Leung (Reference Leung1991, Reference Leung1994) and is tailored to suit the problem of why fishermen violate the mesh size regulation. Ideally, a composite index of the illegal mesh size, the size of the illegal net, and the frequency of illegal net use should indicate the extent to which the regulation is violated. However, if constant returns to scale are assumed between the composite index and effort in the fishery, then the level and composition of harvest, for any given level of stock, may be a good proxy for the intensity of violation of the mesh regulation (e.g. see Turvey, Reference Turvey1964, and Boyd, Reference Boyd1966, for a similar assumption of the relationship between fishing capacity and effort). Note that, notwithstanding the weakness associated with the use of harvest as a proxy, this method has the advantage of being based on data that are fairly easily obtainable. Fish are normally traded in a market and are consequently not very easy to conceal, whereas data on the mesh size of nets and the extent to which these nets are being used are much more difficult to obtain. Moreover, self-reported data of the kind relied on in some other empirical studies on violation of fishing regulations can suffer from some degree of falsification.
Consider a standard Schaefer model in which the level of harvest perfectly correlates with the level of effort for any given level of stock. Suppose that a potential violator i of the mesh size regulation has a profit function given by π i(yi, xi, ki, px, py, w), where yi is the harvest of juvenile stock; xi is the harvest of mature stock; ki, following Boyce (Reference Boyce1996), is a common fixed cost of harvest, which is independent of the composition of catch; px and py are prices per kilogram of xi and yi respectively, which are assumed to be constant over time; and w is a vector of input prices, which is also assumed to be time invariant. The nets with the legal mesh size can harvest only the mature stock, but those with the illegal mesh size can harvest both the mature and the immature or juvenile stock. Let illegal net denote a fishing net composed partly of the authorized mesh size (i.e. the legal net) and partly of the unauthorized smaller mesh size. If the offender uses an illegal net, he targets both mature and juvenile stock (i.e. xi > 0 and yi > 0) and makes a profit defined by

where C ix(x i, w) and C iy(y i, w) are individual specific cost functions for the harvest of xi and yi respectively that satisfy the following conditions. They are non-negative, non-decreasing in xi and yi respectively; non-decreasing in and concave in w; homogeneous of degree 1 in w; and C ix(0,w) = C iy(0, w) = 0. On the other hand, if the fisherman uses the legal net, he targets only the mature stock (i.e. x i > 0 and y i >0), and his profit is  . This specification, which assumes that the harvest is linear and separable in the use of the smaller and the approved mesh sizes, is consistent with Charles et al. (Reference Charles, Mazany and Cross1999). The catch with an illegal net is referred to as illegal harvest and that of the legal net as legal harvest. Furthermore, if it is assumed that the fisherman is not a pure profit-maximizing agent, but derives disutility, say incurs a psychological cost, directly from harvesting x i (i.e. z i(x i)) and y i (i.e. d i(y i)), then his quasi-linear profit function may be re-specified as

where z ix > 0 diy > 0 and d i(0) = 0. It is assumed that the disutility from catching the mature and juvenile fish depends on a fisherman's perceptions of social pressure, the fairness, legitimacy, and feasibility of the regulation, and the current level of the fish stock compared to that of the past.Footnote 1 By implication, if the fisherman does not violate the regulation, then his utility is u i(0, x i, k i, p x, w). Furthermore, if caught, he receives a penalty  , where
 , the perceived fine, is the product of a fixed fine (
 ) and each fisherman's perceived probability of being fined given that the illegal fishing activity is detected (q i) (i.e.
 );
 is the expected penalty, which depends on the intensity of violation, e.g. the replacement cost of the illegal net. Note that
 .Footnote 2 Following Davis's dynamic deterrence model (1988), it is assumed that each violator does not know the exact time of detection but only some probability distribution of the time of detection, denoted g i(y i, t), where the probability that detection would have occurred at time t in the future is the cumulative density function (cdf), G i(t). The expected present value of the penalty is, therefore
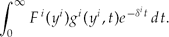
An infinite planning horizon is assumed because fishing gear is usually bequeathed to subsequent generations. Although violators do generally recidivate, artisanal fishermen are known to live in abject poverty and a generic violator of the mesh size regulation is not likely to repeat the offence if the illegal net is seized. Following the literature on dynamic deterrence (see e.g. Davis, Reference Davis1988; Nash, Reference Nash1991; Leung, Reference Leung1991, Reference Leung1994), by assuming an infinite planning horizon, the model becomes an illegal–legal two-segment dynamic problem. The value function is a discounted stream of profit given by

where V i(·) is the value-function and δ i is the individual benefit discount rate. It is assumed that the discount rate is positive, since the violator will prefer a given sum of money today to having the same amount in the future. Until detected, the offender will maximize profit from the illegal harvest. But after the act is detected, the net with the illegal mesh will be seized and he will now have to maximize his profit from legal harvesting. To establish a relationship between the intensity of violation and the timing of detection, let the probability that the offence will be detected within a very small interval of time t given that it had not been detected in the past (i.e. the hazard rate or the instantaneous conditional probability) be  , where
 is the perception of exogenous, government induced changes in the hazard rate of detection and
 is the hazard rate that depends on the intensity of violation, with
 .
Two important characteristics of the fishery under consideration are, first, that it experiences unpredictable seasonal upwelling that produces plankton on which the fish feed (Anang, Reference Anang1979) and, second, that it is organized as a regulated open access, where fishermen can harvest any quantity with the authorized mesh size. These factors make it difficult for artisanal fishermen to predict the trend of catch. It is therefore assumed that the fisherman's best forecast of future catches is the present catch. Consequently, if the periodic harvest in this model is assumed to be time invariant or constant over time,Footnote 3 then  . If the expression for g i(y i, t) (i.e.
 ) is substituted into the objective function and all other values are assumed to be constant over time, this gives equation (5). Moreover, since the offender's objective is to maximize benefit from the illegal activity, y i is the explicit choice variable in the optimization program

The first term on the right-hand side of equation (5) is the infinite discounted expected return from violating the regulation, with the discount factor adjusted by the hazard rate, and the second term is the infinite discounted stream of profit from harvesting legally. If the expected return is not positive, the fisherman will not violate the regulation. Thus, the magnitude of the expected return provides the incentive for the profit-maximizing agents to violate the regulation (Chang and Ehrlich, Reference Chang and Ehrlich1985). Moreover, the discount rate matters because if y i affects p i(y i), then y i affects future profits and the current value of this effect depends on δ i.
It is straightforward to see that, from equation (5), the elasticity (i.e. ηs = −∂ ln (V i)/∂ ln s i where  ) with respect to the perceived fine is less than the elasticity with respect to instantaneous conditional probability. This implies that the value function will be more sensitive to an increase in the conditional probability of detection than to an equal percentage increase in the fine. Thus, an increase in the probability of detection, say through increased monitoring effort, is more likely to prevent violation than an equal percentage increase in the fine. On the other hand, in a static setting, a given percentage increase in the probability of detection could be compensated for by an equal percentage reduction in penalty that may be imposed to keep the value function constant. This presents a clear distinction between modelling a repeating crime as a dynamic or a static problem. Furthermore, by modelling the problem as a dynamic one, an additional variable (i.e. discount rate) has been identified. From equation (5), the general form of the supply of violation function is specified as

where the vector Bi includes the perception variables that affect disutility from harvest and the socioeconomic characteristics of the skipper, such as age, which affect the individual specific costs of harvest. The psychological and socioeconomic variables are included because previous studies have found them to be important in explaining regulatory compliance in fisheries (see Kuperan and Sutinen, Reference Kuperan and Sutinen1994; Sutinen and Kuperan, Reference Sutinen and Kuperan1999; Hatcher et al., Reference Hatcher, Jaffry, Thébaud and Bennett2000). It is hypothesized that, for example, increasing social pressure, measured by the perception of the proportion of fishermen who violate the regulation, would motivate a fisherman to increase the intensity of violation. Similarly, a fisherman who is more inclined to perceive the regulation to be not legitimate, unfair, or less feasible is likely to have higher intensity of violation, all other things being equal. More importantly, the inclusion of age in the model is motivated by findings in the age–crime profile literature that younger adults are more likely to commit a crime than older ones (see e.g. Leung, Reference Leung1994). The following signs are expected:  . The proof of these comparative static results is presented in appendix A. Note that since px, py, and w are not individual specific but apply to all fishermen, these parameters will be captured by the intercept of the regression. Furthermore, if risk neutrality is assumed, the term at the right-hand side of equation (5) denotes the expected (indirect) utility from illegal harvesting. Moreover, since the profit function is additive separable in y i and x i, equation (6) does not have x i as an argument.
3. Survey design and data description
The data for the analysis were collected through a survey of fishermen from the Komenda-Edina-Eguafo-Abrew (KEEA) District, which is a district of Ghana where fishing activities are intense. Since some types of nets are known to have patches with varying mesh sizes, including the illegal sizes (i.e. meshes that are less than 25 mm in stretched diagonal length), the population included all the skippers in the district who use these nets. From the population, a random sample of 310 skippers, one each to a boat, constituting approximately 41 per cent of the total number of boats in the district, were interviewed between June and July 2005.
The fishery sector in Ghana has undergone considerable changes with regard to improvement in artisanal fishing gear, which has led to overexploitation of the fishery stock.Footnote 4 From the beginning of the twentieth century outboard motors were introduced, and fish processing, storage facilities, fishing nets, and netting materials were improved, resulting in larger catches (Koranteng, Reference Koranteng1992). First the beach seine net was introduced, and soon after that an encircling net, which was later developed into a purse seine net, known locally as a watsa net, with a mesh size of about 50 to 60 mm. This was further improved by using thinner twine and much smaller mesh sizes of 10 to 13 mm, known as poli. Fishery scientists consider this kind of net very destructive to the fish stock, since it is capable of harvesting large shoals of juvenile fish (Koranteng, Reference Koranteng1992). The most recent and popular gear is an ali-watsa net, which is a combination of a destructive drifting gillnet with mostly small mesh sizes known as ali, and watsa nets (Koranteng, Reference Koranteng1992; Walker, Reference Walker2002). Furthermore, some fishermen in the Central Region of Ghana have adapted the ali net into a type of purse net called a sarti. These nets are used along the entire coastal zone of Ghana. The target species include sardine, grunt, ilisha, threadfin, and mackerel.
By 1984, the practice of using nets with meshes smaller than the legal size had become pervasive, posing a serious threat to the resource sustainability. Consequently, the government, through the Fisheries Department, enacted a law banning the use of mesh sizes smaller than 25 mm in stretched diagonal length. Bodies charged with the responsibility of enforcing this law are the Ghana Navy, the Department of Fisheries, and the Judiciary. However, because the government's budget is limited, monitoring and enforcement are poor along the entire coastline.
Before the questionnaires were administered to the skippers, approval was sought from the chief fisherman of the district, who is highly respected by all the fishermen.Footnote 5 A questionnaire was administered to each of the skippers in a face-to-face interview. The interviewers informed the respondents of their mission and assured them that they were not collecting the information for the fishery department or the state and also that their responses would be treated with strict confidentiality. To guarantee that responses were not contaminated by the opinions of others, it was ensured that each respondent was interviewed alone. Furthermore, each was paid a participation fee of US$2.24, which is equivalent to what previous researchers who similarly interviewed the community had paid each skipper for his time. Since the payment was not conditional on the nature of the information provided by the respondent, it was not expected to generate any biases in the responses given. The questionnaire included questions about demographic characteristics, types of fishing nets used, other fishing activities of the fishing crew, the skipper's perception of the mesh size regulation and the violation rate, the subjective instantaneous conditional probability of detection, and how much he would be fined if caught. The skipper was also asked how much confidence he had in the ability of the chief fisherman and district fisheries officers to regulate fishing activities.
The questions about fishing activities included the type of net used, the various mesh sizes used in it, the value of catches of juvenile fish that could not have been caught without the illegal mesh, and the value of big fish in the catch attributable to mesh sizes of 25 mm or more during the last week of fishing. Since the chief fisherman in whom the fishermen have a great deal of confidence approved the survey, the respondents participated willingly.Footnote 6 Only three (0.010 per cent) respondents refused to supply information about the mesh sizes of their nets. Six (0.019 per cent) said they did not use illegal mesh sizes, but all the rest (i.e. 301) said they did.Footnote 7 The mean value of the catch of juvenile fishFootnote 8 was US$146, and that of the perceived fine for violation (i.e.  ) is the product of a fixed fine (f) of US$112 and the subjective probability of being fined given detection, which has a mean value of 0.101.
To ask the respondents about their perception of instantaneous conditional probability of detection in a simple way, a 5-point scale ranging from very high (50 per cent or more) to very low (1 per cent or less), from Hatcher et al. (Reference Hatcher, Jaffry, Thébaud and Bennett2000), was used.Footnote 9 Only 14 per cent indicated that the subjective probability of detection was 50 per cent or more, while the corresponding figure for the probability of 1 per cent or less was about 20 per cent. On the other hand, only 6 per cent indicated that the probability of being fined given detection was 50 per cent or more.
The question of the skipper's perception of violation rate required answers on a continuous scale. Sixty-five per cent indicated that at least 80 per cent of the fishermen in the district violate the regulation. Only half of the skippers who agreed that there was a general decline in the stock within the area where they fish thought that the main cause of the decline was over fishing. Moreover, in answer to the question about how they perceived the fishing regulation, only about 11 per cent agreed that the government was doing the right thing by imposing the regulation and that the regulation would improve the well-being of the fishermen as a group. As much as 70 per cent agreed that the mesh regulation was unfair to fishermen. The responses were measured on a five-point Likert-scale ranging from strongly agree to strongly disagree.
To determine the individual rate of time preference, the choice design of Cropper et al. (Reference Cropper, Aydede and Portney1992) and Poulos and Whittington (Reference Poulos and Whittington2000) was used. The respondents were asked to choose one of two hypothetical fishery projects. Project A could increase the skipper's income once by an amount at the end of the month in which the data were collected, and Project B could increase it once by twice the amount in six months’ time. After the choice was made, the respondent was asked to indicate the value for Project B that would make him indifferent between the two projects. This matching was used and, following Pender (Reference Pender1996) and Holden et al. (Reference Holden, Shiferaw and Wik1998), the instantaneous individual discount rate was computed as δi = log (α2i/α1i), where α2i is the amount quoted by the skipper, and α1i is the amount Project A would offer. About 39 per cent of the skippers had less than 100 per cent discount rate and the mean was 131 per cent.Footnote 10 Personal interviews with the fishermen revealed that usurious moneylenders charge a compounding monthly interest rate of between 20 per cent and 30 per cent on loans to fishermen, who usually live in abject poverty and do not have collaterals to secure loans from formal financial institutions. Aryeetey (Reference Aryeetey1994) also found very high informal quarterly lending rates of about 25 to 30 per cent. If this rate compounds, the corresponding annual lending rate is 127 to 134 per cent, the average of which approximates with that found in this research. Consequently, the high figures for the discount rate are not unexpected.Footnote 11 Furthermore, the fact that nearly half of the sample revealed discount rates that exceeded borrowing rates indicates that the fishermen are generally borrowing constrained. It is noteworthy that, since the cost of fishing equipment is high and it is usually recouped over a period of time, the high discount rate does not imply that the fishermen completely disregard possible future harvests, but rather less emphasis is put on it.
4. Estimation of intensity of violation function
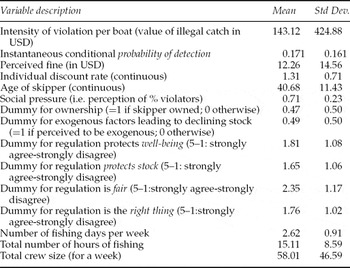
Since most of the variables could not be measured directly, proxies were used. First, the dependent variable, the intensity of violation, was calculated as the value of juvenile fish in an illegal catch per day, averaged over the last week's catch.Footnote 12 Besides this, the perceived proportion of fishermen who violate the regulation was used as an indicator for social pressure. The proxy for the legitimacy of the regulation was the statement that the government is doing the right thing by imposing the regulation, and the feasibility of the regulation, from the point of view of the fishermen, was denoted by the statements that the regulation will improve the well-being of fishermen as a group, and the regulation will protect the fish stock. The definitions of the variables used for the analysis and their summary statistics are provided in table 1 (see appendix B).
It is noteworthy that, as is typical of data on many socioeconomic characteristics, the data on the age of the skipper were positively skewed. Following Mukherjee et al. (Reference Mukherjee, White and Wuyts2003), the variables were logged to transform them towards normality before they were used in the regression. It is noteworthy that although the mean age was about 40 years, about 10 per cent of the sample were above 55, with the oldest being 81. Consequently, an individual who becomes a fisherman at say 19, which was the minimum age in the sample, could commit to fishing for many years.
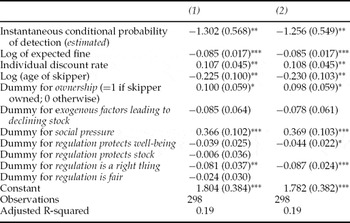
Since very few boats (i.e. less than 1 per cent) did not fish with nets with the small mesh size, the ordinary least square (OLS) estimation procedure was employed to estimate the intensity of violation equation. To check for robustness, the Tobit estimation procedure was also used and the results (coefficients) were similar. The results of the estimation of the intensity of violation equation are shown in table 2 (see appendix B). The second column of the table (i.e. the column headed (1)) presents the results that include all the perception variables. However, owing to the strong correlation among the variables – a finding which was also reported in Hatcher et al. (Reference Hatcher, Jaffry, Thébaud and Bennett2000) and Hatcher and Gordon (Reference Hatcher and Gordon2005) – two out of the four were included in the estimation and the results are reported in the last column (headed (2)).Footnote 13 Since the perceived probability of detection was likely to be endogenous, the instrumental variable estimation procedure was employed (see Maddala, Reference Maddala2001). Thus, the probability was regressed on some possible instruments (crew size of the boat, total fishing hours and days) and the predicted (estimated) values were used in the intensity of violation equation reported in table 2.
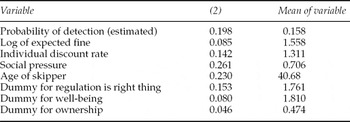
The traditional variables, i.e. the subjective instantaneous conditional probability of detection and the expected fine, are significantly different from zero at the 5 per cent level of significance and have the expected signs. The elasticity, reported in table 3 (see appendix B), is 0.198 for the probability of detection. This implies that a 1 per cent increase in the probability of being detected, given that the violator had escaped detection in the past, will decrease the intensity of violation by 0.198 per cent. Thus, the negative sign implies that the intensity of violation could be reduced, ceteris paribus, if inspection of the nets was increased.
The elasticity with respect to the log of the expected fine of 0.085 indicates that a 1 per cent increase in the severity of punishment is likely to reduce the intensity of violation by about 0.09 per cent. The value is, however, lower than that of the probability of detection, implying that increasing the risk of detection will be more likely to reduce violation than increase the severity of punishment. These very low values are likely to be due to poor monitoring and enforcement of the regulation.
The coefficient of the discount rate is positively related to the intensity of violation and significantly different from zero at a 5 per cent level of significance.Footnote 14 The positive coefficient of the rate implies that the more impatient fisherman has a higher intensity of violation of the mesh regulation. Numerous empirical findings have established a positive relationship between poverty or hunger and individual discount rates (see for example Holden et al., Reference Holden, Shiferaw and Wik1998), and since artisanal fishermen are known to be poor, this finding is not unexpected. The elasticity coefficient for the individual discount rate is higher than that of the severity of punishment, which implies that advancing any policy that reduces the discount rate among the artisanal fishermen is likely to decrease the intensity of violation much more than increasing severity of punishment. Since many of the fishermen are borrowing constrained because of imperfect credit market, improving the credit market may reduce the discount rates.
The variables for the perceived legitimacy and feasibility of the regulation and fairness are not significantly different from zero in the extended equation (i.e. second column of table 2), because of the strong correlation problem mentioned earlier. However, each of the variables is statistically significant if it is included in the regression alone. In the last column of table 2, the dummies for well-being and the regulation is the right thing were included and they were both statistically significant. Moreover, social pressure was consistently significantly different from zero, indicating that the skippers’ perceptions of other fishermen's compliance behaviour influence the intensity of their own. The elasticity coefficient of social pressure is the highest. Since social pressure is measured as the fishermen's perception of the proportion of fishermen who violate the regulation, it follows that reducing the level of non-compliance further increases compliance. Thus, all the social factors were very significant in explaining compliance with the mesh size regulation. Furthermore, the younger skippers had a higher intensity of violation of the regulation, with a very high elasticity coefficient that was greater than that of the risk of detection. Finally, skippers who were owners of fishing equipment had a higher intensity of violation, albeit a weak elasticity coefficient.
5. Conclusion
This study not only provides additional empirical support for the standard theory of criminal behaviour but also highlights the importance of the individual discount rate in violation of fishing regulations. It was found that the more impatient fishermen had a higher intensity of violation, with an elasticity coefficient of the discount rate that exceeded that of the risk and severity of punishment. It follows that if the underlying causes of high discount rates among the artisanal fishermen are addressed, a significant reduction in the intensity of violation is likely to be achieved. Moreover, about half of the fishermen had discount rates that were greater than borrowing rates, which indicates that they are generally borrowing constrained due to imperfections of credit markets. Correcting such market imperfection may result in lower discount rates and, consequently, a lower intensity of violation. Based on the strong effect of the discount rate on the intensity of violation, it is recommended that future empirical research on fisheries crimes that are committed repeatedly should incorporate individual discount rates.
Furthermore, the risk of punishment, i.e. the instantaneous conditional probability of detection and the severity of punishment, i.e. the fine, were found to be statistically significant and negatively related to the intensity of violation. However, the intensity of violation is more responsive to the risk of punishment than the severity of punishment. Moreover, since the younger skippers have a high intensity of violation, the Fisheries Department should focus on them rather than the older ones.
The violator's perception of social pressure was positively related to the intensity of violation. The perceived legitimacy and feasibility of the regulation were important in explaining compliance behaviour. Skippers who thought the regulation was not legitimate or feasible had a higher intensity of violation. This implies that the compliance rate is likely to improve if the management authorities intensify their efforts to educate fishermen about the destructive consequences of the illegal nets, all other things being equal, and aim this education particularly at the owners of fishing equipment since they have a higher intensity of violation.
Appendix A
To determine the effect of a change in  , and δ i on y i*, equation (5) is used. Thus

where  and
 . The first-order derivative of equation (5) with respect to y i is taken, and the result set to zero, to determine the optimal intensity of violation (i.e. y i*). Thus

and

Note that for y i* to be optimal (i.e. equation (A2) to hold with equality) it is required that the numerator of the first term at the right-hand side of equation (5) be positive (i.e. (u i(.) − p i(.)F i(.)) > 0). But we know from equation (A2) that  hence
 .
Furthermore, since y i* is implicit in equation (A2), the total derivative of the equation is taken to derive the comparative static properties of y i* with respect to  , and δ i. For example, regarding the effect of the change in
 on y i*, the total derivative with respect to the two variables is taken, holding all other variables constant. After rearranging the terms, it gives

Since the denominator of equation (A4) is negative, the numerator must also be negative for  . But
 if
 . Thus, for an increase in perceived probability of detection to decrease violation, the discounted marginal profit obtainable from increased violation must be lower than the expected marginal fine for the violation. Otherwise increased perceived probability of detection may not decrease the intensity of violation. Following the preceding procedure, the comparative static properties of the remaining two variables (i.e.
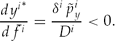
 and δ i), which are unambiguous, are presented below

Appendix B
Ghana – summary statistics and definition of variables for regression analysis of intensity of violation of mesh size regulation

Source: The data are from a survey conducted by the author in 2005.
Ghana – ordinary least square regression results for determinants of intensity of violation of mesh size regulation

Notes: Standard errors are in parentheses. *Significant at 10%; **significant at 5%; ***significant at 1%.
Ghana – Estimated elasticities of the determinants of intensity of violation of mesh size regulation (evaluated at the mean)