Introduction
This paper examines the causal impact of retirement on cognitive functioning using an unbalanced panel data-set for elderly male workers in Japan obtained from six waves of the Longitudinal Study of a National Survey of Japanese Elderly (NSJE) (1987, 1990, 1993, 1996, 1999 and 2002). This paper particularly focuses on how the job tasks of an individual's career job affects cognitive functioning after retirement. We do not believe that enough attention has been paid to how an individual's use of their brain during their prime age affects their cognitive functioning in their later life. In neuropsychological research, Stern (Reference Stern2002: 448) defines the cognitive reserve as ‘more efficient utilization of brain networks or of enhanced ability to recruit alternate brain networks as needed’. Stern (Reference Stern2002) distinguishes between passive models and active models for the brain reserve hypothesis. Passive models indicate that a larger reserve (larger brain) has a better capacity to replace damaged brain areas, and this enables the brain to maintain a higher functioning. In contrast, active models suggest that the brain actively compensates for the damaged area. Higher levels of intelligence, such as educational and occupational attainment, are good predictors of which individuals can sustain greater brain damage before demonstrating a functional deficit. This suggests taking account of the relationship between occupation and cognitive reserves (and functioning).
Some research has found that education plays a role in the cognitive reserve (Evans et al. Reference Evans, Beckett, Albert, Hebert, Scherr, Funkenstein and Taylor1993; Le Carret et al. Reference Le Carret, Lafont, Mayo and Fabrigoule2003). Other research has studied the effect of occupation on dementia and Alzheimer's disease, and the results suggested that cognitive decline is related to occupation (Andel et al. Reference Andel, Crowe, Pedersen, Mortimer, Crimmins, Johansson and Gatz2005; Schooler, Mulatu and Oates Reference Schooler, Mulatu and Oates1999; Stern et al. Reference Stern, Gurland, Tatemichi, Tang, Wilder and Mayeux1994). There is already a substantial literature that investigates the relationship between occupational characteristics and cognitive functioning (e.g. Andel et al. Reference Andel, Crowe, Pedersen, Mortimer, Crimmins, Johansson and Gatz2005, Reference Andel, Kåreholt, Parker, Thorslund and Gatz2007; Bosma et al. Reference Bosma, Van Boxtel, Ponds, Houx, Burdorf and Jolles2003; Finkel et al. Reference Finkel, Adel, Gatz and Pedersen2009; Fisher et al. Reference Fisher, Stachowski, Infurna, Faul, Grosch and Tetrick2014; Gow, Avlund and Mortensen Reference Gow, Avlund and Mortensen2014; Marquie et al. Reference Marquie, Duarte, Bessieres, Dalm, Gentil and Ruidavets2010; Potter, Helms and Plassman Reference Potter, Helms and Plassman2008; Potter et al. Reference Potter, Plassman, Helms, Foster and Edwards2006; Schooler, Mulatu and Oates Reference Schooler, Mulatu and Oates1999; Smart, Gow and Dreary Reference Smart, Gow and Dreary2014; Van der Elst, Van Boxtel and Jolles Reference Van der Elst, Van Boxtel and Jolles2012). Some of this literature employs data from the Dictionary of Occupational Titles (DOT) from the United States of America (USA) (US Employment Service, Department of Labor, Employment and Training Administration 1991) to measure various aspects of an individual's occupation, e.g. the job's relationship to people, to data and to things (see Andel et al. Reference Andel, Crowe, Pedersen, Mortimer, Crimmins, Johansson and Gatz2005, Reference Andel, Kåreholt, Parker, Thorslund and Gatz2007; Finkel et al. Reference Finkel, Adel, Gatz and Pedersen2009; Schooler, Mulatu and Oates Reference Schooler, Mulatu and Oates1999; Smart, Gow and Dreary Reference Smart, Gow and Dreary2014). Although the results of this research are not always consistent, a job's relationship with people appears to preserve cognitive ability in later life (for some recent evidence, see Smart, Gow and Dreary Reference Smart, Gow and Dreary2014).
However, these studies do not explore the effects of occupation after retirement, and the potential impact between the time that has elapsed since retirement and the characteristics of the career job. It has been argued that it may be beneficial to delay the retirement age because continued intellectual stimulation can potentially help reduce the deterioration of cognitive function. In a sample of Swedish twins aged 65 years or older, Andel et al. (Reference Andel, Crowe, Pedersen, Mortimer, Crimmins, Johansson and Gatz2005) find a lower risk of Alzheimer's disease was associated with more complex work with people, while Andel et al. (Reference Andel, Kåreholt, Parker, Thorslund and Gatz2007), with a study of Swedes aged 77 years or older, find that a greater complexity of work with data and people was associated with higher cognition. Adam et al. (Reference Adam, Bay, Bonsang, Germain and Perelman2006) contend that continuing professional activities can be a protective strategy against cognitive decline. On the other hand, Coe et al. (Reference Coe, von Gaudecker, Lindeboom and Maurer2012) compare white-collar workers to blue-collar workers, but they could not find a positive causal association between retirement and cognition among white-collar workers. Interestingly, they found some evidence that there is a positive effect of retirement on the cognitive skills for blue-collar workers. The effects of occupation on cognitive functioning are still ambiguous. Moreover, simple blue collar/white collar or professional/non-professional divisions do not necessarily capture variations in job characteristics which may lead to brain stimulation or deterioration. For instance, the work of doctors and nurses who engage in shift work may be more physically demanding than some blue collar or non-professional occupations. Similarly, electricians may require more mathematical skills than some white-collar occupations.
On the other hand, both Fisher et al. (Reference Fisher, Stachowski, Infurna, Faul, Grosch and Tetrick2014) and Finkel et al. (Reference Finkel, Adel, Gatz and Pedersen2009) use more concrete measurements of the complexity of occupation. Fisher et al. (Reference Fisher, Stachowski, Infurna, Faul, Grosch and Tetrick2014) use a one-dimensional composite index based on ten items from the Occupational Information Network database to measure the mental work demands of jobs, and provide evidence that working in an occupation with a high level of mental demands is associated with a slower rate of cognitive decline after retirement. Finkel et al. (Reference Finkel, Adel, Gatz and Pedersen2009) examine whether the complexity of work with data, people and things has impacts on cognitive ability in later life, and find that only complexity of work with people is associated with cognitive ability. They also find that high complexity of work with people is associated with faster decline after retirement on spatial factors. Although these findings are interesting, neither Fisher et al. (2009) nor Finkel et al. (2014) explicitly consider the endogeneity of retirement.
We merge the occupational characteristics in the DOT by three-digit occupational code, and examine how occupational task requirements associate with cognitive functioning after retirement. Rather than focusing on a simple division of blue collar/white collar occupations or professional/non-professional occupations which seems prevalent in the economics-related literature, we comprehensively cover all of the available eight job dimensions in the DOT to examine the issue. These eight dimensions of an occupation are physical demands, mathematical development, reasoning development, language development, the job's relationship to data, the job's relationship to people, the job's relationship to things and specific vocational preparation impact.
To our knowledge, this is the first study to examine the effects of duration of retirement on cognitive functioning in Japan. This paper's contribution is its multi-dimensional exploration of the effects of physical demands, mathematical development, reasoning development, language development, a job's relationship to data, a job's relationship to people, a job's relationship to things and the specific vocational preparation after retirement. Unlike Coe et al. (Reference Coe, von Gaudecker, Lindeboom and Maurer2012) or Adam et al. (Reference Adam, Bay, Bonsang, Germain and Perelman2006), we examine the effects of the required work tasks in the individual's career job rather than the effects of a simple binary occupational category such as blue collar/white collar or professional/non-professional. We argue that our strategy is likely to be better and more comprehensive in taking into account the heterogeneity of work tasks.
In analysing the causal impact of retirement on cognitive functioning, we will use retirement duration rather than retirement status as the variable of interest. Some studies use a 0–1 retirement dummy variable which takes the value one if the individual is retired and takes the value zero otherwise (Bonsang, Adam and Perelman Reference Bonsang, Adam and Perelman2012; Hashimoto Reference Hashimoto2013; Rohwedder and Willis Reference Rohwedder and Willis2010). However, this approach is problematic as it regards retirement as having an immediate constant shift effect on cognition. It is difficult to argue that two individuals one of whom retires on the day of the survey and is treated as retired, and one who retires on the day after the survey and who is treated as working would have significant differences in their cognitive functioning. As Coe et al. (Reference Coe, von Gaudecker, Lindeboom and Maurer2012) point out, it is more natural to assume that retirement gradually affects cognition, and modelling the ‘dose–response’ of retirement on cognition is more appropriate.
One potential problem in using retirement duration as the variable of interest is that the retirement duration is left-censored, that is, for individuals who are still working retirement duration is treated as being zero. Previous studies do not take account of these zero values in the retirement period variable. Here, we apply a Tobit model to deal with this problem in the first-stage estimation when we model retirement duration.
There is an advantage in using Japanese data to study the impact of retirement on cognition. Figure 1 shows the labour participation rates of elderly male workers (65+) in some developed countries. Although the Japanese labour participation rate has dropped dramatically over the past 35 years, Japanese elderly males (and females) tend to remain in the labour force longer than in other developed economies, so that the variation in the retirement age in Japan is larger than in other countries.
Labour force participation rate of males aged 65 years or older.

The rest of this paper consists of four sections: the first section describes the data and explains how we construct the job task variables, followed by a section discussing the models to be estimated and our identification strategy adopted. The next section reports the results of estimation and discusses their implications, and the paper ends with a brief conclusion.
Data
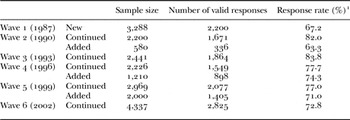
Our data are drawn from the first six waves of the NSJE (Zenkoku Koureisha no Seikatsu to Kenkou nikansuru Chouki Jyuudan Chousa), Wave 1 (1987), Wave 2 (1990), Wave 3 (1993), Wave 4 (1996), Wave 5 (1999) and Wave 6 (2002). For the purpose of this NSJE survey, the ‘elderly’ are defined as people who are 60 years of age or over. The population of aged 60 and over was extracted by two-stage stratified random sampling. Each survey includes information on the respondent's physical health, mental health, family relationships, social relationships and economic status. These panel surveys were conducted by the Tokyo Metropolitan Institute of Gerontology and the University of Michigan. The data were provided by the Social Science Japan Data Archive, Information Center for Social Science Research on Japan, Institute of Social Science, The University of Tokyo. The NSJE has been conducted every three years since 1987. The initial sample for the longitudinal study was obtained in 1987, but was supplemented by additional samples in 1990, 1996 and 1999. Table 1 provides details of the sample sizes and the response rate for each of the first six waves. Kan (Reference Kan2009) and Kajitani (Reference Kajitani2011) compare the differences between the sample distributions of the NSJE and the relevant Japanese Census data, and report that there is little difference between the two.
Response rates

Notes: The ‘Continued’ sample includes those who did not respond to the previous survey. Cases where a family member answered the survey on behalf of the respondent due to the respondent's poor health are excluded from the valid responses. 1. Excluding the dead.
Observations where for health reasons a family member answered the survey on behalf of the respondent are excluded from our analysis. It is important to note that these observations do not contain data on the memory test scores, but also do not have data on the timing of retirement. Thus, we could not include these extreme cases of deterioration of cognitive function into our analysis. We will conduct analysis by pooling the six waves of panel surveys with appropriate weighting.
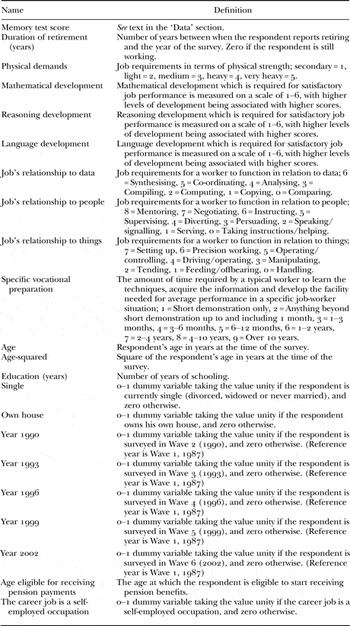
All the data on the variables used in this paper are drawn from the NSJE except for the information from the DOT. The definitions of all the variables are summarised in Table 2.
Definitions of variables

The analysis in this paper is restricted to males. In Japan, women are more likely to quit their jobs after marriage and child birth than in other developed countries. Some women come back to work after child birth and others do not. The NSJE survey does not contain any information on how long respondents are away from their jobs and at what age they returned to the workforce. More importantly, for females in our sample, in particular, there are a sizeable number of individuals who have never worked. These women, called Kaji Testudai in Japanese, help with domestic work in their parental home until they get married and then become a full-time housewife after their marriage. For these reasons, the analysis of job effects on cognitive functioning for females could be a little more complicated than the analysis for males.
Duration of retirement
It is important to note that the NSJE only asks respondents about their year of retirement in Wave 1 in 1987, and for individuals in the supplementary samples in Wave 2 (1990), Wave 4 (1996) and Wave 5 (1999). For those individuals who have retired before responding to the survey for the first time, their duration of retirement is computed as the number of years between their self-reported year of retirement and the year of the survey. However, for individuals who retire after responding to the survey for the first time, we do not know exactly their year of retirement. If they report they are not retired at Wave X and are retired at Wave X + 1, it is assumed that they retired exactly mid-way between the two waves, so their duration of retirement at Wave X + 1 is 1.5 years and at Wave X + J is (J – 1) × 3 + 1.5. The values of the duration of retirement which are in the top 1 per cent of our sample are omitted from our analysis. The observed values for the duration of retirement for people who have not retired are assumed to be left-truncated at zero, and are assigned the value of zero.
Cognitive test scores
The NSJE contains information on the respondents' answers to questions that test his or her memory. In an interview, the respondent is asked nine memory-related questions: (a) the respondent's address; (b) the date of the interview; (c) the day of the interview; (d) the respondent's mother's maiden name; (e) the name of the current Prime Minister; (f) the name of the previous Prime Minister; (g) the respondent's date of birth; (h) the respondent's age; and (i) a question that requires the respondent to continuously deduct 3 from 20. We use the accuracy of the respondent's answers to these questions as a measure of the respondent's cognitive functioning. For the question on successively deducting 3 from 20, the answer is recorded as being correct only if the respondent could successfully deduct 3 six times until the number becomes 2. Over 80 per cent of the respondents gave the correct answer to this question. This memory test is similar to the standard memory tests used in cognitive science (e.g. Teng et al. Reference Teng, Hasegawa, Homma, Imai, Larson, Graves, Sugimoto, Yamaguchi, Sasaki, Chiu and White1994), and is akin to Folstein's Mini-mental Status Exam (see Folstein, Folstein and McHugh Reference Folstein, Folstein and McHugh1975) which is used to detect gross cognitive decline.Footnote 1
We create a cognitive score variable based on seven of the nine questions by excluding the questions about the current and the previous Prime Ministers. These two questions are excluded because they do not necessarily capture the respondent's memory loss. There were 11 Prime Ministers within the sample period (1987–2002), and some of them did not even survive one quarter (e.g. Sosuke Uno lasted 69 days and Tsutomu Hata lasted 64 days). It is hard to identify if the wrong answer is the result of a memory loss or a lack of interest in politics. For each of the remaining seven questions, a correct answer to a question is allocated one point and an incorrect answer is allocated zero points, so the maximum possible score for an individual is seven and the minimum possible score is zero.
DOT
One main objective of this paper is to investigate how eight occupational characteristics of a respondent's career job are associated with cognitive functioning after retirement. There are 12,741 occupations listed in the DOT,Footnote 2 but our NSJE data-set only has 287 occupational categories. Thus, we merge the three-digit occupation codes in DOT with our data-set using the 287 occupations in the NSJE.Footnote 3 The Appendix provides some information on how we merged the DOT three-digit codes with the 287 NSJE occupational codes. With these merged codes, we then examine the effects of eight dimensions of the longest served job on cognitive functioning after retirement. The eight dimensions include physical demands, mathematical development, reasoning development, language development, the job's relationship to data, the job's relationship to people, the job's relationship to things and the specific vocational preparation required.
Following Fletcher, Sindelar and Yamaguchi (Reference Fletcher, Sindelar and Yamaguchi2011), in the physical demands category we focus on strength, which is measured as one of five categories: ‘secondary’, ‘light’, ‘medium’, ‘heavy’ and ‘very heavy’. We compute the physical strength variable by allocating scores to each category as follows: secondary = 1, light = 2, medium = 3, heavy = 4 and very heavy = 5.
The DOT also provides information on the General Educational Development associated with occupations. It describes the levels of educational aspects which are required of the worker for satisfactory job performance. Each of mathematical development, reasoning development and language development in the DOT is measured on a scale of one to six, with higher levels of development being associated with higher scores.
Furthermore, we incorporate the information in the DOT about a job's relationships to data, people and things, which are called ‘worker functions ratings’ in the DOT. These categories are expressed on different scales of zero to six for data, zero to eight for people and zero to seven for things (the higher the scale, the more complex the task is). In addition, we include ‘specific vocational preparation’ which captures the amount of lapsed time required by a typical worker to learn the techniques for that job.
One of the problems in merging the DOT three digit codes with the NSJE occupational codes is that the occupational characteristics in the American DOT may not necessarily match with the Japanese occupational characteristics. From this point of view, we should estimate the effects of occupational characteristics on cognitive functioning using Japanese occupational information. Unfortunately, comprehensive occupational information equivalent to the American DOT does not exist in Japan. The closest occupational information is the Japan Institute for Labour's (1997) Occupation Handbook for Youth (Shokugyo Hando Bukku) (OHBY). This handbook is designed to provide occupational information for the youth who start job-hunting. However, OHBY is not as informative as the three-digit occupational codes in DOT, and there are some major deficiencies in OHBY. As it is designed for young people's job searches, there are hardly any managerial occupations listed in OHBY. Moreover, the occupations listed are predominantly in the manufacturing industry. As a result, professional occupations or occupations in the service industry are not well documented. Thus, we prefer to use the DOT assuming that the cross-country differences in occupational characteristics between Japan and the USA are not so large.
Empirical model and identification issues
The main goal of this paper is to identify the causal effect of retirement on cognitive functioning and to examine whether aspects of an individual's career job have any effects on cognitive functioning after retirement. The following model is considered:
 $$\eqalign{& COG_{it} = \gamma _0 RET_{it} + \mathop \sum \limits_{\,j = 1}^8 \gamma _j RET_{it} \cdot DOT_{\,jit} + \mathop \sum \limits_{\,j = 1}^8 \delta _j DOT_{\,jit} + X_{it} {\rm \beta} + u_{it}, \cr & i = 1 \ldots, N,t = 1 \ldots, T_i} $$
where COG it is the outcome variable (cognitive test score), RET it is the duration of retirement, DOT jit is a job complexity score for the jth occupational characteristics of the respondent's career job, X it is a vector of control variables, u it is an error term, and the subscript i refers to the ith individual and the subscript t refers to the survey year t. DOT jit includes eight job characteristics: physical demands, mathematical development, reasoning development, language development, a job's relationship to data, a job's relationship to things people, a job's relationship to things and the specific vocational preparation required. X it includes a constant, the respondent's age and its square, the respondent's years of education, a dummy variable which indicates whether the individual is currently single and a dummy variable which indicates whether the individual owns a house. N is the number of individuals in the analysis, and T i is the number of observations on individual i. Following Roberts and Binder's (Reference Roberts and Binder2009) suggestion, we also include survey year dummies in X it to account for the fact that we are combining information from six surveys, the 1987, 1990, 1993, 1996, 1999 and 2002 surveys. Unfortunately, due to data unavailability, we are unable to control for the respondent's current time use and daily activity which could be crucial for cognitive functioning in their later life.
As Equation (1) indicates, there are multiple observations on the same participant. Rather than treating these observations on the same individuals as independent observations, the standard errors of the estimated coefficients of Equation (1) are adjusted for heterogeneous clustering.
The presence of the DOT jit term in Equation (1) allows for the possibility that the jth occupational characteristic of an individual's career job can influence the cognitive score test prior to the individual's retirement. The presence of the interaction term, RET it · DOT jit allows for the possibility that the jth occupational characteristic of an individual's career job can influence the cognitive score test after the individual's retirement and that the size of the impact increases with the length of retirement.
In Equation (1), this paper uses retirement duration rather than the status of retirement since we are more interested in uncovering any dynamic effects of retirement on cognitive functioning. In order to provide a link between cognitive abilities, ageing and retirement, Mazzonna and Peracchi (Reference Mazzonna and Peracchi2012) develop a theoretical framework based on Grossman's (Reference Grossman1972) health capital accumulation model. In this model, individuals can control for natural deterioration to some extent by investing in cognitive repair activity. People may lose market incentives to invest in cognitive repair activity, and this in turn accelerates natural deterioration in cognitive functioning after retirement. This can be viewed as one way of formalising the use it or lose it hypothesis. We expect, therefore, that as the duration of retirement gets longer, the decline in cognitive skills should get larger, that is γ0 < 0.
Previous research uses two measures of retirement, the self-reported status of retirement and the retirement period. Previous studies such as Bonsang, Adam and Perelman (Reference Bonsang, Adam and Perelman2012) and Rohwedder and Wills (2010) use a retirement dummy, which takes the value unity if the person reports not working, and the value zero if the person reports to be currently working for pay. However, the effects of retirement on cognitive functioning may not be an instantaneous shift. Bonsang, Adam and Perelman (Reference Bonsang, Adam and Perelman2012) found that the effect of retirement on cognitive functioning is not instantaneous, but appears with a lag. On the other hand, Coe et al. (Reference Coe, von Gaudecker, Lindeboom and Maurer2012) prefer to use the duration of retirement as the retirement variable, arguing that it is more natural to assume that retirement gradually affects cognition. They model the ‘dose–response’ of retirement on cognition. In order to capture the gradual effects of retirement, we will use the duration of retirement as the variable of interest.
When using the retirement duration variable, it is important to note that many respondents in our data-set are still in the workforce and the value of their retirement duration is assigned the value zero. We argue that there may be non-trivial differences in cognitive functioning between those who are still in the labour force and those who are already retired.
The possibility that the length of retirement in Equation (1) is endogenous is a major obstacle to estimating the causal impact of retirement on cognitive functioning. Individuals whose cognitive abilities are lower (higher) may retire earlier (later). Moreover, retirement choices may be correlated with unobservable factors such as health. We consider the following model to explain the length of retirement:
 $$\eqalign{& RET_{it}^{\ast} = \tau _1 SELF\_EMP_i + \tau _2 PENSION\_AGE_i + \mathop \sum \limits_{\,j = 1}^8 \theta _j DOT_{\,jit} + X_{it} {\rm \pi} + w_{it}, \cr & i = 1 \ldots, N,t = 1 \ldots, T_i} $$
 $$RET_{it} = 0\; \quad {\rm if} \,RET_{it}^{\ast} \les 0$$
 $$\quad\;\quad= RET_{it}^{\ast} \quad {\rm if}\,0 \lt RET_{it}^{\ast} $$
where
 $RET_{it}^{\ast} $
is an unobserved latent variable which is connected to the observed length of retirement RET
it
by Equation (3),
 $SELF\_EMP_i $
is a 0–1 dummy variable taking the value unity if individual i's career job is a self-employed job,
 $PENSION\_AGE_i $
is the age at which individual i is eligible to receive pension payments, X
it
is the same vector of control variables as used in Equation (1) and w
it
is a disturbance which is assumed to be normally independently and identically distributed with a zero mean and variance
 ${\rm \sigma} _w^2 $
. The combination of Equations (2), (3a) and (3b) together with the assumptions about w
it
means that this model can be estimated using the Tobit technique (with left-censoring).
By comparing Equations (1) and (2), it can be seen that our ‘instruments’ for RET
it
are a self-employed dummy variable,
 $SELF\_EMP_i $
and the age at which an individual is eligible for receiving pension payments,
 $PENSION\_AGE_i $
. The first instrument, the self-employment dummy, controls for whether the respondent's career job was self-employment. This variable aims to capture the differences in retirement rule/practices and the pension systems for different types of workers. Self-employed workers are covered by the National Pension System (Kokumin Nenkin), whereas employed workers are covered by the Employees' Pension Insurance System (Kousei Nenkin Hoken). We expect these schemes have different effects on the timing of retirement. Most Japanese firms adopt a mandatory retirement system. These firms are willing to employ workers on one day but force them to retire on the next, regardless of their cognitive skills. It should be noted that these mandatory ‘retired’ workers may still find jobs after their mandatory retirement. On the other hand, there is no mandatory retirement for the self-employed.
The second instrument is the age at which an individual is eligible for receiving pension payments. The typical identification strategy in previous studies is to use changes in the social security system as an instrument for the retirement variable (Bonsang, Adam and Perelman Reference Bonsang, Adam and Perelman2012; Coe and Zamarro Reference Coe and Zamarro2011; Mazzonna and Peracchi Reference Mazzonna and Peracchi2012; Rohwedder and Willis Reference Rohwedder and Willis2010). Oshio, Oishi and Shimizutani (Reference Oshio, Oishi and Shimizutani2011) show that social security reforms in Japan significantly delayed the timing of retirement of the Japanese elderly. In Japan, due to amendments to the pension law in 1954, the age at which men were eligible to start receiving pension benefits was gradually raised from 55 to 60 by raising the eligibility age one year every four years over a period of 16 years from 1957 to 1973. This variable is the most frequently used instrument in the area.
In order to estimate the parameters of Equation (1), taking account of the endogeneity of the duration of retirement, three alternative ways of estimating Equations (1)–(3) are maximum likelihood, instrumental variable estimation and two-step estimation. Here, we employ an instrumental variable estimator. First, we estimate the parameters in Equation (2) using a Tobit estimator to obtain estimates of the parameters of τ k (k = 1, 2) and θ j (j = 1, 2, …, 8) and π. From Equations (2) and (3), the conditional expectation of RET it can be computed as:
 $$E(RET_{it} {\vert} Z_{it} ) = {\rm \Phi} \left( {\displaystyle{{Z^{\prime}_{it} {\rm \alpha}} \over {{\rm \sigma} _w}}} \right)Z^{\prime}_{it} \alpha + \sigma _w {\rm \phi} \left( {\displaystyle{{Z^{\prime}_{it} {\rm \alpha}} \over {{\rm \sigma} _w}}} \right),$$
where Z
it
is the vector of regressors in Equation (2), α is the vector of parameters in Equation (2), Φ(.) is the cumulative distribution function of the standard normal distribution and Φ(.) is the probability distribution function of the standard normal distribution (see Greene Reference Greene and Sixth edition2008: 871). With estimates of the parameters of Equation (2), this conditional expectation can easily be estimated, and we denote this by
 $\widehat{{RET}}_{it} $
. In the second step,
 $\widehat{{RET}}_i $
, and
 $\widehat{{RET}}_{it} \cdot DOT_{jit} $
, are used as instruments for RET
it
, RET
it
· DOT
jit
.
Results and discussion
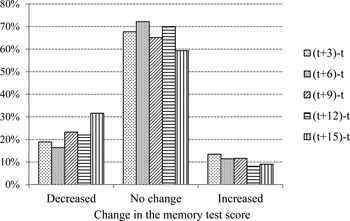
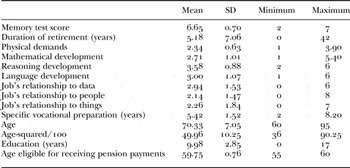
Descriptive statistics on the principal variables used in the analysis are reported in Table 3. The mean memory score of 6.65 (out of a maximum of 7) indicates that many individuals in the sample are scoring perfectly on the memory test. Figure 2 provides an indication of how the memory score changes between the first time an individual is surveyed and in later surveys. For a little over 60 per cent of individuals, there is no change in the memory score, while for around 20 per cent there is a fall in the score and for 10 per cent there is an increase. All estimates in this paper are obtained using Stata version 13.
Distribution of changes in memory test scores over time.

Descriptive statistics

Notes: N = 4,238 observations. SD: standard deviation.
Source: Authors' calculations using data from the National Survey of Japanese Elderly.
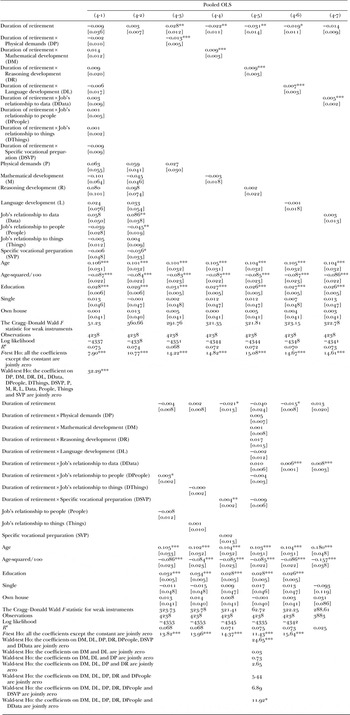
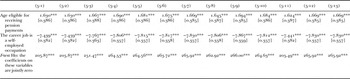
Tables 4 and 5 report the results of estimating Equations (1)–(3) by a two-stage procedure that takes into account both the endogeneity of retirement duration and the left-censoring of retirement duration. Table 4 reports the second-stage results, that is, the estimates of Equation (1), while Table 5 reports only the key parts of the first-stage results, namely the estimated coefficients on the instruments and their standard errors. The first-stage estimates in column (5-X) in Table 5 correspond to the second stage estimates in column (4-X) in Table 4. The results in Table 5 indicate that both instruments, the self-employment dummy and the age at which an individual is eligible for receiving pension payments, are individually and jointly statistically significant in explaining retirement duration. In estimating Equation (1) to take account of the fact that the T i observations on individual i are not independent, the standard errors of the estimated coefficients are adjusted for heterogeneous clustering.
Estimated results: cognitive equation

Notes: Column (4-X) reports the results of estimates of a cognitive equation where the first-stage estimates are reported in column (5-X) of Table 5. The models in columns (4-1)–(4-12) are estimated by instrumental variable estimation (values in square brackets are standard errors adjusted for heterogeneous clustering). The models in columns (4-1)–(4-12) also include year dummies and a constant. Estimates associated with these variables are not reported. The model in column (4-13) is estimated by fixed-effect instrumental variable estimation (values in square brackets are standard errors). We report the Cragg–Donald Wald F statistic using the ‘ivreg2’ command in Stata. H0: null hypothesis.
Significance levels: *, ** and *** indicate statistical significance at 10, 5 and 1 per cent levels, respectively.
Estimated results: duration of retirement equation (first step)

Notes: Column (5-X) reports the estimated coefficients and standard errors for the Age eligible for receiving pensions and The career job is a self-employed occupation that appear in the first-stage equation for the duration of retirement, that are then used in the estimation of the second-stage equation whose estimates are reported in column (4-X) of Table 4. The models are estimated by Tobit estimation (values in square brackets are standard errors adjusted for heterogeneity). All models also include Age, Age-squared/100, Education, Single, Own house, year dummies and a constant. The models in columns (5-1) and (5-2) additionally include Physical demands (P), Mathematical development (M), Reasoning development (R), Language development (L), Job's relationship to data (Data), Job's relationship to people (People), Job's relationship to things (Things) and Specific vocational preparation (SVP). The model in column (5-3) additionally includes P, the model in column (5-4) additionally includes M, the model in column (5-5) additionally includes R, the model in column (5-6) additionally includes L, the model in column (5-7) additionally includes Data, the model in column (5-8) additionally includes People, the model in column (5-9) additionally includes Things, the model in column (5-10) additionally includes SVP, the model in column (5-11) additionally includes P, M, R, L, Data, People and SVP, and the models in columns (5-12) and (5-13) additionally include Data. Estimates associated with these variables are not reported. H0: null hypothesis.
Significance levels: *, ** and *** indicate statistical significance at 10, 5 and 1 per cent levels, respectively.
Column (4-1) of Table 4 reports the estimated result of a two-stage procedure where the model includes all of the eight job characteristic variables and their interaction terms with the duration of retirement. The sign of the duration of retirement is negative as expected, but it is not significant. Moreover, none of the variables related to job characteristics are individually significant, but a Wald-test of the null hypothesis that the coefficients associated with all the job characteristics (including the interaction terms with retirement) are jointly zero clearly rejects the null hypothesis (see the bottom of column (4-1) for the value of the test statistic). Column (4-2) reports the results when all the interaction terms are excluded. In this case, the job's relationship to people is statistically significant, but with a negative sign suggesting that when an individual's job involves more complex interactions with people, his or her cognitive functioning is lower. This result does not appear to be consistent with Finkel et al. (Reference Finkel, Adel, Gatz and Pedersen2009), who found that high complexity of work with people is associated with faster decline after retirement on spatial factors.
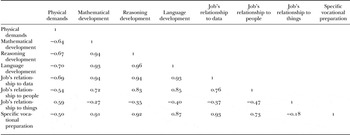
However, there may be multi-collinearity due to the correlation between job characteristics, and some other job characteristics may also be important factors in preventing the decline of cognitive function. Table 6, which reports the correlation coefficient between the job characteristics for all the observations in the sample, provides some support for this speculation. It should be noted that all the correlation coefficients are statistically significant at the 1 per cent significance level.
Correlation coefficients for pairs of job characteristics

Source: Authors' calculations using data from the National Survey of Japanese Elderly.
Given this, columns (4-3)–(4-10) report the results of including one at a time each job characteristic and its interaction term with retirement duration. In four of the eight cases, the sign of the duration of retirement is significantly negative and indicates that cognitive functioning declines as the length of retirement increases. With the exception of things (column (4-9)), the interaction terms of the job characteristics with the duration of retirement are all statistically significant at the 10 per cent level and except for physical demands all have positive signs indicating that a more complex career job in some degree leads to a slower cognitive impairment after retirement. Column (4–11) includes all the job characteristics and interaction terms that were found to be individually significant in columns (4-3)–(4-10). Given the number of added variables, it is perhaps not surprising that none of the variables associated with job characteristics are individually significant, but a Wald-test of the null hypothesis that they jointly have zero coefficients rejects this null hypothesis (χ2 = 24.65). From this equation, we proceeded to eliminate the job characteristic or its interaction term that was statistically insignificant and had the lowest absolute t-value, re-estimate the model and then continue with the same procedure. Column (4-11) reports a number of Wald-tests for eliminating various groups of variables, and the only significant test is when the variable group includes DData, the interaction of the duration of retirement and the job's relationship data. As column (4-12) indicates, this is the only job characteristic that remains after eliminating one at a time those job characteristics that were statistically insignificant. The results in column (4-12) indicate that increases in the duration of retirement lead to a fall in cognitive functions (memory loss), but this fall is abated for career jobs that required a complex relationship to data. As a robustness check, the model reported in column (4-12) is estimated with fixed effects (excluding variables that are independent of time) and the results are reported in column (4-13). The only change in the results is that the duration of retirement becomes insignificant.
It might be argued that workers may be selected into being self-employed, and that the cognitive test score may be correlated with the self-employed dummy. Replacing the self-employed dummy in the first stage by regional dummies and re-estimating all the results in Tables 4 and 5 leads to some quantitative changes, but the final results in (4-12) and (4-13), that the interaction term for the duration of retirement and the job's relationship to data is significant, does not change.Footnote 4
Conclusion
This paper examines the causal impact of retirement on cognitive functioning for elderly male workers in Japan using data from six waves of the NSJE. We contribute to the literature by exploring the effects of the characteristics of the longest tenured job (career job) on cognitive functioning. After merging the occupational characteristics in the three-digit occupational code of the DOT with 287 NSJE occupations, it is found that one characteristic of our career job, the job's relationship to data, is a good predictor of how well we maintain cognitive functioning after retirement. Even after taking account of the endogeneity of retirement duration, and the left-censoring of retirement duration, our empirical evidence suggests that if the individual's career job requires more complex interactions with data, the memory loss after retirement is slower. Unlike Finkel et al. (Reference Finkel, Adel, Gatz and Pedersen2009), we do not find strong support for a high complexity of work with people increases the pace of decline in cognitive functioning after retirement.
There are, of course, some reservations concerning the interpretation of our results. Although we found slower deterioration in the memory loss among people who engaged in the job tasks with a high complexity in work with data, this may not mean such activities stimulate brain and delay the pace of deterioration of memory loss. One alternative interpretation is that people who have high cognitive skills are sorted into the occupations that require high data skills. As we could not find enough instruments for each job characteristic, we cannot control for this type of endogeneity. Another interpretation is that people who worked in such occupations may have some specific patterns in how they spend time in their after-retirement life. In this case, occupational tasks may not have direct impacts on cognitive functioning. This issue needs to be dealt with in future research. With the data-set used in this paper, we were unable to control for the time use of the elderly due to the unavailability of such data. Even after retirement, people may continue to engage in activities which could delay their cognitive impairment. Thus, another extension of our study would be to examine the relationship between the time use of the elderly and their cognitive functioning. The Japanese Study of Aging and Retirement (JSTAR) contains some information on the time use of the elderly such as how much time they spend on commuting, work, hobbies, study, and community and volunteer work. Such information would enable us to examine what activities, if any, are significant and most effective in preventing cognitive impairment.
Unfortunately, we do not have other sophisticated measures of cognitive ability in our data-set. Hence, our results should be interpreted as indicating that career jobs with a high level of data manipulation lead to slower gross cognitive impairment than other jobs. However, in order to check the robustness of our results, we should use the information on various types of cognitive tests. Another extension of our study is to use JSTAR which contains various types of cognitive tests. It is important to note that the sample of JSTAR is drawn from five randomly chosen cities. Although it contains beneficial information, the national representativeness is not as good as our NSJE data-set.
Moreover, this study could not examine the effects of a gradual path to retirement on cognitive functioning. Japanese workers are less likely to retire immediately after hitting their mandatory retirement age. Many workers take a part-time position before finally retiring. Thus, it is important to examine whether full-time employment is crucial for delaying the deterioration of cognitive functioning or whether being employed, even if it is a part-time job, is important for maintaining a worker's cognitive functioning.
Acknowledgements
All three authors would like to thank Martin Hyde and two referees for their extremely constructive and helpful comments that led to a considerable improvement in the paper. They also would like to thank Haruko Noguchi and participants at the Globalization, Working Conditions and Health Conference, the Annual Conference of the European Society of Population Economics (ESPE2013), the Asian Meeting of the Econometric Society in Singapore, the International Conference: Health, Education and Retirement Over the Prolonged Life Cycle in Austria, the Spring 2013 Meeting of the Japanese Economic Association, seminars at Keio University, Ritsumeikan University and Meisei University, the National Institute of Population and Social Security Research, and a Workshop on Family Economics at the University of Bocconi for their helpful and constructive comments. They would like to gratefully acknowledge the financial assistance provided by the Japan Society for the Promotion of Science (JSPS) Grant in Aid for Scientific Research (B) Number 24330093 for a project on ‘Retirement Behavior of the Aged and their Cognitive Ability and Health’, and the kind permission of the Tokyo Metropolitan Institute of Gerontology, the University of Michigan and the Social Science Japan Data Archive, Information Center for Social Science Research on Japan, Institute of Social Science, University of Tokyo in making available the data in the Longitudinal Study of a National Survey of Japanese Elderly (Zenkoku Koureisha no Seikatsu to Kenkou ni kansuru Chouki Jyuudann Chousa) for use in the analysis in this paper. The first author would like to gratefully acknowledge the financial assistance provided by the JSPS Grant in Aid for Young Scientists (B) Number 22730237 for a project on ‘Health Disparity and Income Inequality’.
Appendix: merging DOT codes with NSJE codes
This Appendix explains how we merged the DOT three-digit codes with 287 NSJE occupational codes. Table A1 provides some illustrations of this merging process. Panel A in Table A1 shows how various occupations are categorised into DOT three-digit codes. Each DOT occupational group has its own scores for the eight characteristics we investigate: physical demands, mathematical development, reasoning development, language development, the job's relationship to data, the job's relationship to people, the job's relationship to data and the required specific vocational preparation. First, we compute the average score for each characteristic for the occupations listed in each DOT three-digit code. For example, in the DOT three-digit code ‘001’, six occupations are listed from ‘001.061-010 ARCHITECT (profess. & kin.)’ to ‘001.261-014 DRAFTER, LANDSCAPE (profess. & kin.)’. For this three-digit code, we compute the average score of the eight occupational characteristics for the six occupations. This computation was done for each DOT three-digit code from ‘002’ to ‘979’. Second, we merge the DOT three-digit code with the NSJE occupational codes. Panel B in Table A1 provides details of the matching for NSJE codes 001, 002, 003, 004, 005 and 287. Details of the all the other matches are available on request. In this matching process, each DOT three-digit code is allocated to what we consider to be the most appropriate NSJE occupational code. As can be seen from some of the NSJE occupational codes illustrated in Panel B of Table A1, there are sometimes more than one DOT three-digit codes for a single NSJE occupational code. When there are more than one DOT three-digit occupations for a NSJE code, we compute the average score of the characteristics for occupations in the DOT three-digit code which fall into the corresponding category in NSJE. For example, the occupation code 1 in NSJE is ‘Researcher in Natural Science’ and the corresponding occupations in this category in the three-digit code of DOT are ‘020’, ‘021’, ‘022’, ‘023’ ‘024’, ‘025’, ‘040’, ‘041’ and ‘045’. Similarly, the three-digit DOT codes ‘050’, ‘051’, ‘052’, ‘054’ and ‘055’ can be classified as a ‘Researcher in Humanities and Social Science’ category ‘002’ in NSJE. For each NSJE code, we compute the average score for each of the eight characteristics of the occupations for the DOT codes corresponding to one of the NSJE codes.
Examples of how to merge three-digit code in DOT with NSJE